Elsah, IL Map & Demographics
Elsah Map
Elsah Overview
$8,878
PER CAPITA INCOME
$120,000
AVG FAMILY INCOME
$83,125
AVG HOUSEHOLD INCOME
54.0%
WAGE / INCOME GAP [ % ]
46.0¢/ $1
WAGE / INCOME GAP [ $ ]
0.29
INEQUALITY / GINI INDEX
629
TOTAL POPULATION
259
MALE POPULATION
370
FEMALE POPULATION
70.00
MALES / 100 FEMALES
142.86
FEMALES / 100 MALES
20.4
MEDIAN AGE
2.4
AVG FAMILY SIZE
1.7
AVG HOUSEHOLD SIZE
283
LABOR FORCE [ PEOPLE ]
45.4%
PERCENT IN LABOR FORCE
4.6%
UNEMPLOYMENT RATE
Elsah Zip Codes
Elsah Area Codes
Income in Elsah
Income Overview in Elsah
Per Capita Income in Elsah is $8,878, while median incomes of families and households are $120,000 and $83,125 respectively.
| Characteristic | Number | Measure |
| Per Capita Income | 629 | $8,878 |
| Median Family Income | 18 | $120,000 |
| Mean Family Income | 18 | $123,594 |
| Median Household Income | 39 | $83,125 |
| Mean Household Income | 39 | $101,526 |
| Income Deficit | 18 | $0 |
| Wage / Income Gap (%) | 629 | 53.98% |
| Wage / Income Gap ($) | 629 | 46.02¢ per $1 |
| Gini / Inequality Index | 629 | 0.29 |
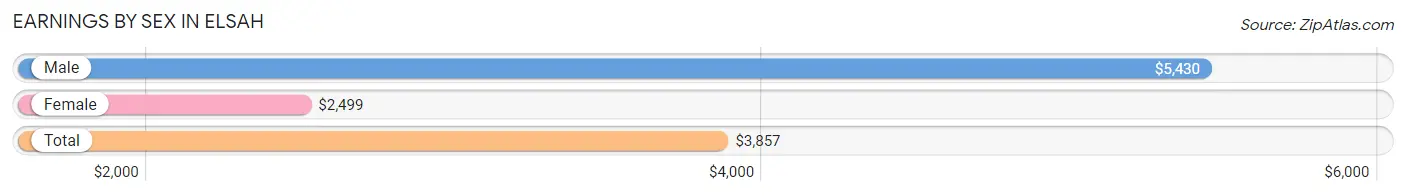
Earnings by Sex in Elsah
Average Earnings in Elsah are $3,857, $5,430 for men and $2,499 for women, a difference of 54.0%.
| Sex | Number | Average Earnings |
| Male | 207 (50.2%) | $5,430 |
| Female | 205 (49.8%) | $2,499 |
| Total | 412 (100.0%) | $3,857 |
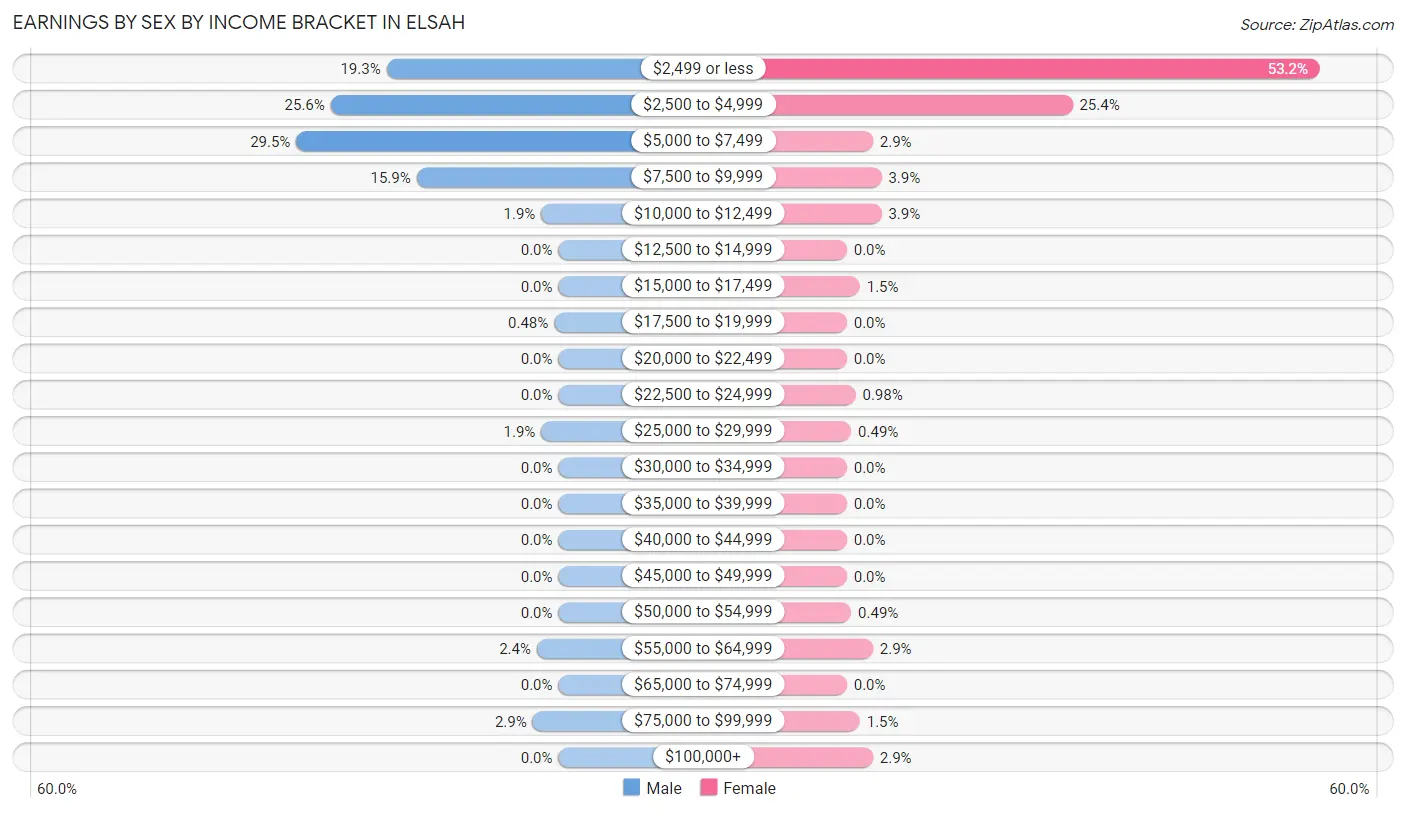
Earnings by Sex by Income Bracket in Elsah
The most common earnings brackets in Elsah are $5,000 to $7,499 for men (61 | 29.5%) and $2,499 or less for women (109 | 53.2%).
| Income | Male | Female |
| $2,499 or less | 40 (19.3%) | 109 (53.2%) |
| $2,500 to $4,999 | 53 (25.6%) | 52 (25.4%) |
| $5,000 to $7,499 | 61 (29.5%) | 6 (2.9%) |
| $7,500 to $9,999 | 33 (15.9%) | 8 (3.9%) |
| $10,000 to $12,499 | 4 (1.9%) | 8 (3.9%) |
| $12,500 to $14,999 | 0 (0.0%) | 0 (0.0%) |
| $15,000 to $17,499 | 0 (0.0%) | 3 (1.5%) |
| $17,500 to $19,999 | 1 (0.5%) | 0 (0.0%) |
| $20,000 to $22,499 | 0 (0.0%) | 0 (0.0%) |
| $22,500 to $24,999 | 0 (0.0%) | 2 (1.0%) |
| $25,000 to $29,999 | 4 (1.9%) | 1 (0.5%) |
| $30,000 to $34,999 | 0 (0.0%) | 0 (0.0%) |
| $35,000 to $39,999 | 0 (0.0%) | 0 (0.0%) |
| $40,000 to $44,999 | 0 (0.0%) | 0 (0.0%) |
| $45,000 to $49,999 | 0 (0.0%) | 0 (0.0%) |
| $50,000 to $54,999 | 0 (0.0%) | 1 (0.5%) |
| $55,000 to $64,999 | 5 (2.4%) | 6 (2.9%) |
| $65,000 to $74,999 | 0 (0.0%) | 0 (0.0%) |
| $75,000 to $99,999 | 6 (2.9%) | 3 (1.5%) |
| $100,000+ | 0 (0.0%) | 6 (2.9%) |
| Total | 207 (100.0%) | 205 (100.0%) |
Earnings by Sex by Educational Attainment in Elsah
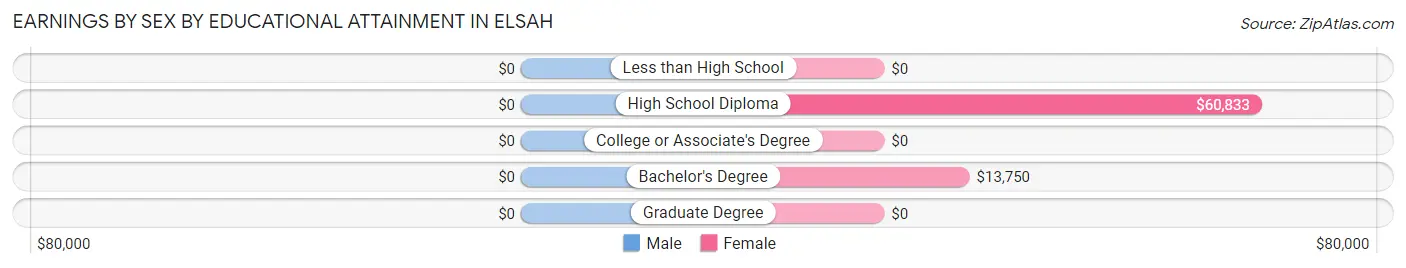
| Educational Attainment | Male Income | Female Income |
| Less than High School | - | - |
| High School Diploma | - | - |
| College or Associate's Degree | - | - |
| Bachelor's Degree | - | - |
| Graduate Degree | - | - |
| Total | - | - |
Family Income in Elsah
Family Income Brackets in Elsah
According to the Elsah family income data, there are 7 families falling into the $150,000 to $199,999 income range, which is the most common income bracket and makes up 38.9% of all families.
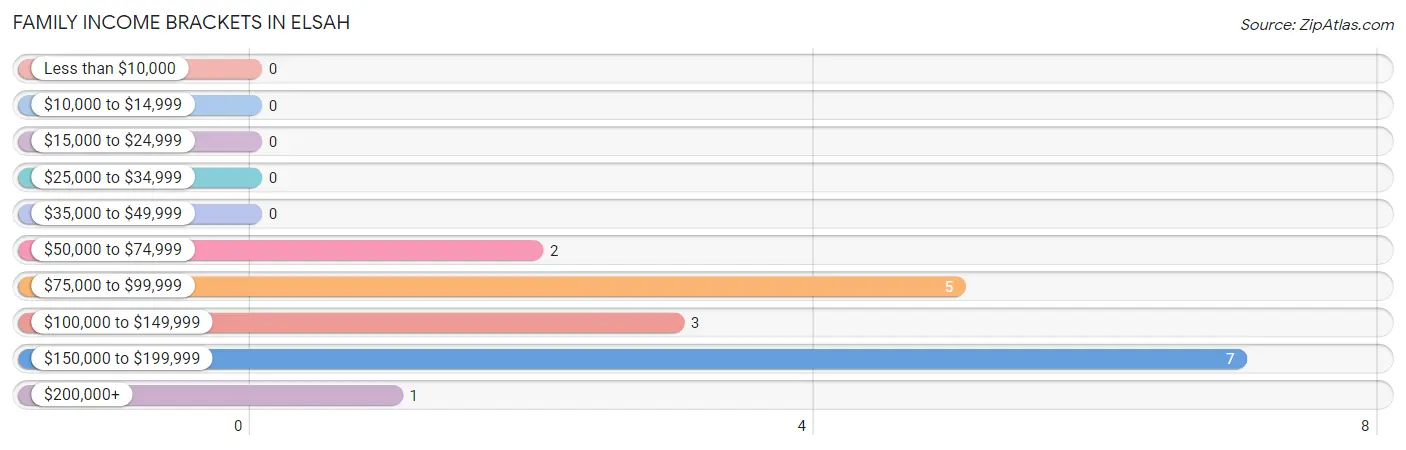
| Income Bracket | # Families | % Families |
| Less than $10,000 | 0 | 0.0% |
| $10,000 to $14,999 | 0 | 0.0% |
| $15,000 to $24,999 | 0 | 0.0% |
| $25,000 to $34,999 | 0 | 0.0% |
| $35,000 to $49,999 | 0 | 0.0% |
| $50,000 to $74,999 | 2 | 11.1% |
| $75,000 to $99,999 | 5 | 27.8% |
| $100,000 to $149,999 | 3 | 16.7% |
| $150,000 to $199,999 | 7 | 38.9% |
| $200,000+ | 1 | 5.6% |
Family Income by Famaliy Size in Elsah
2-person families (14 | 77.8%) account for the highest median family income in Elsah with $155,500 per family, while 2-person families (14 | 77.8%) have the highest median income of $77,750 per family member.
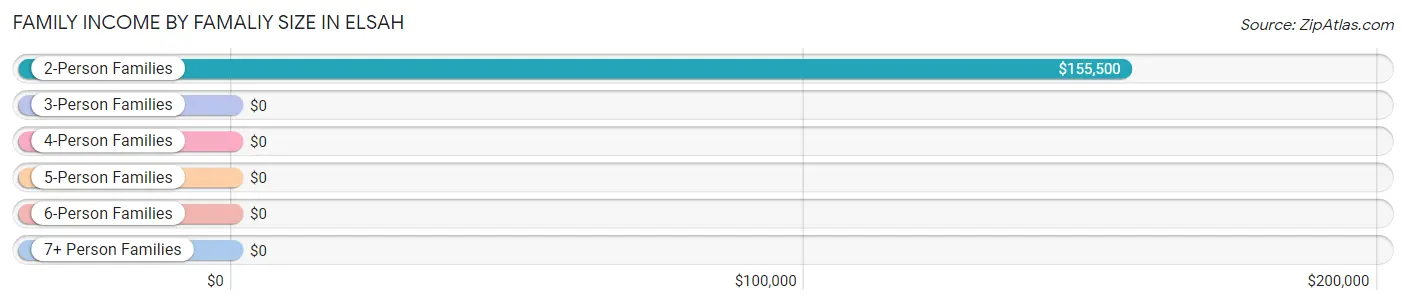
| Income Bracket | # Families | Median Income |
| 2-Person Families | 14 (77.8%) | $155,500 |
| 3-Person Families | 4 (22.2%) | $0 |
| 4-Person Families | 0 (0.0%) | $0 |
| 5-Person Families | 0 (0.0%) | $0 |
| 6-Person Families | 0 (0.0%) | $0 |
| 7+ Person Families | 0 (0.0%) | $0 |
| Total | 18 (100.0%) | $120,000 |
Family Income by Number of Earners in Elsah
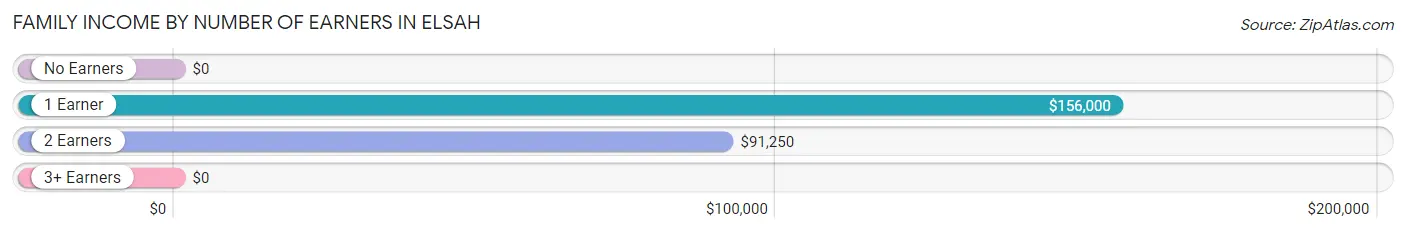
| Number of Earners | # Families | Median Income |
| No Earners | 0 (0.0%) | $0 |
| 1 Earner | 12 (66.7%) | $156,000 |
| 2 Earners | 5 (27.8%) | $91,250 |
| 3+ Earners | 1 (5.6%) | $0 |
| Total | 18 (100.0%) | $120,000 |
Household Income in Elsah
Household Income Brackets in Elsah
With 11 households falling in the category, the $50,000 to $74,999 income range is the most frequent in Elsah, accounting for 28.2% of all households.
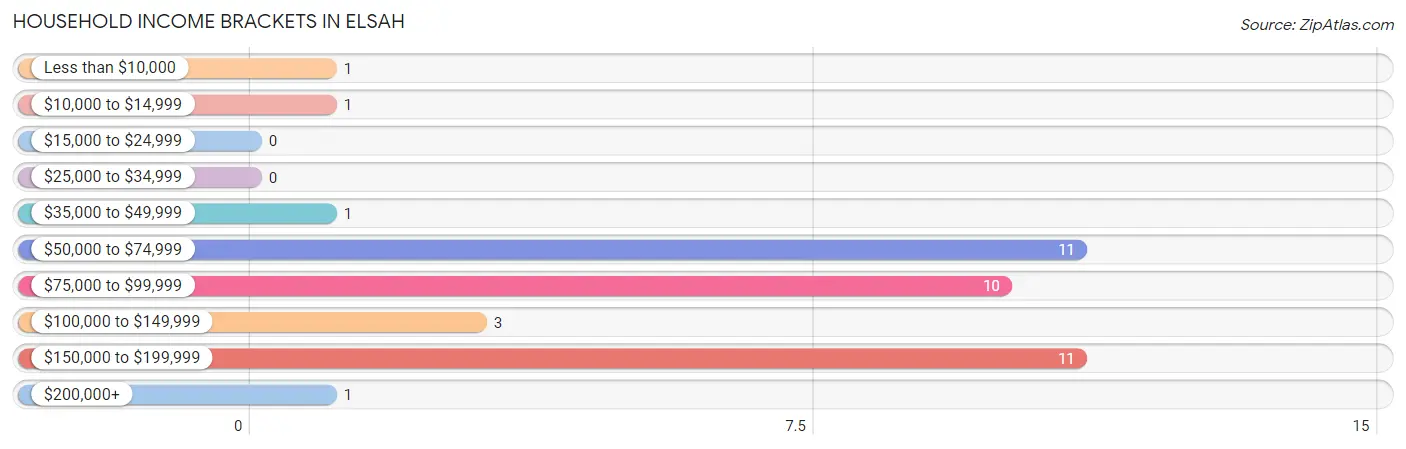
| Income Bracket | # Households | % Households |
| Less than $10,000 | 1 | 2.6% |
| $10,000 to $14,999 | 1 | 2.6% |
| $15,000 to $24,999 | 0 | 0.0% |
| $25,000 to $34,999 | 0 | 0.0% |
| $35,000 to $49,999 | 1 | 2.6% |
| $50,000 to $74,999 | 11 | 28.2% |
| $75,000 to $99,999 | 10 | 25.6% |
| $100,000 to $149,999 | 3 | 7.7% |
| $150,000 to $199,999 | 11 | 28.2% |
| $200,000+ | 1 | 2.6% |
Household Income by Householder Age in Elsah
The median household income in Elsah is $83,125, with the highest median household income of $97,500 found in the 45 to 64 years age bracket for the primary householder. A total of 10 households (25.6%) fall into this category.
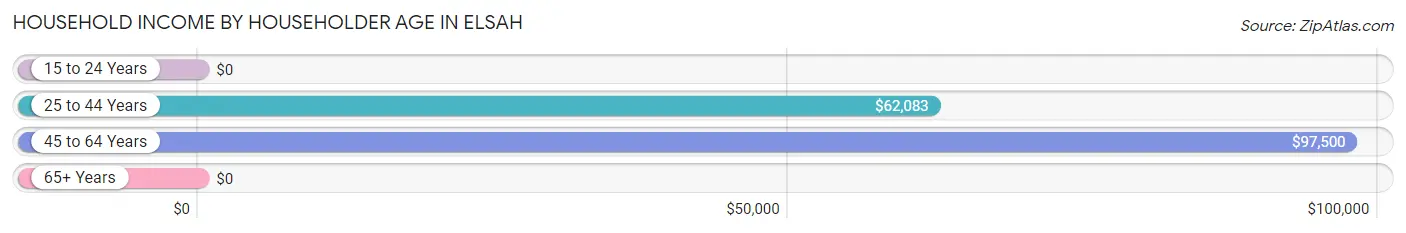
| Income Bracket | # Households | Median Income |
| 15 to 24 Years | 0 (0.0%) | $0 |
| 25 to 44 Years | 10 (25.6%) | $62,083 |
| 45 to 64 Years | 10 (25.6%) | $97,500 |
| 65+ Years | 19 (48.7%) | $0 |
| Total | 39 (100.0%) | $83,125 |
Poverty in Elsah
Income Below Poverty by Sex and Age in Elsah
With 21.9% poverty level for males and 2.4% for females among the residents of Elsah, 25 to 34 year old males and 65 to 74 year old females are the most vulnerable to poverty, with 4 males (100.0%) and 1 females (8.3%) in their respective age groups living below the poverty level.
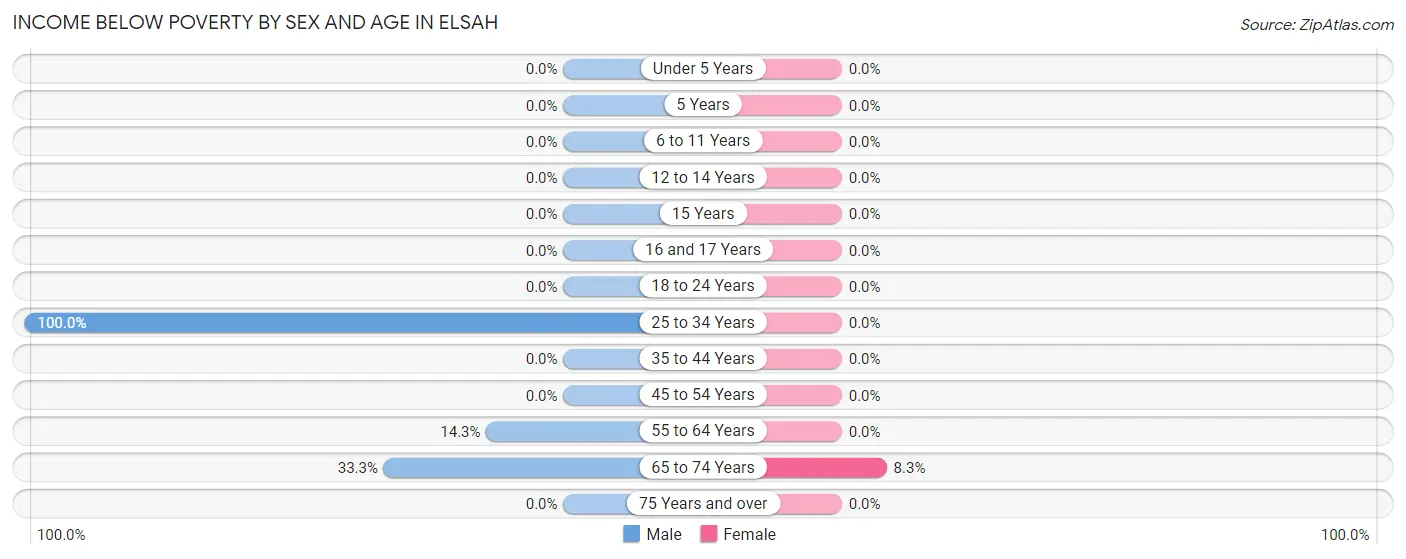
| Age Bracket | Male | Female |
| Under 5 Years | 0 (0.0%) | 0 (0.0%) |
| 5 Years | 0 (0.0%) | 0 (0.0%) |
| 6 to 11 Years | 0 (0.0%) | 0 (0.0%) |
| 12 to 14 Years | 0 (0.0%) | 0 (0.0%) |
| 15 Years | 0 (0.0%) | 0 (0.0%) |
| 16 and 17 Years | 0 (0.0%) | 0 (0.0%) |
| 18 to 24 Years | 0 (0.0%) | 0 (0.0%) |
| 25 to 34 Years | 4 (100.0%) | 0 (0.0%) |
| 35 to 44 Years | 0 (0.0%) | 0 (0.0%) |
| 45 to 54 Years | 0 (0.0%) | 0 (0.0%) |
| 55 to 64 Years | 1 (14.3%) | 0 (0.0%) |
| 65 to 74 Years | 2 (33.3%) | 1 (8.3%) |
| 75 Years and over | 0 (0.0%) | 0 (0.0%) |
| Total | 7 (21.9%) | 1 (2.4%) |
Income Above Poverty by Sex and Age in Elsah
According to the poverty statistics in Elsah, males aged 6 to 11 years and females aged 25 to 34 years are the age groups that are most secure financially, with 100.0% of males and 100.0% of females in these age groups living above the poverty line.
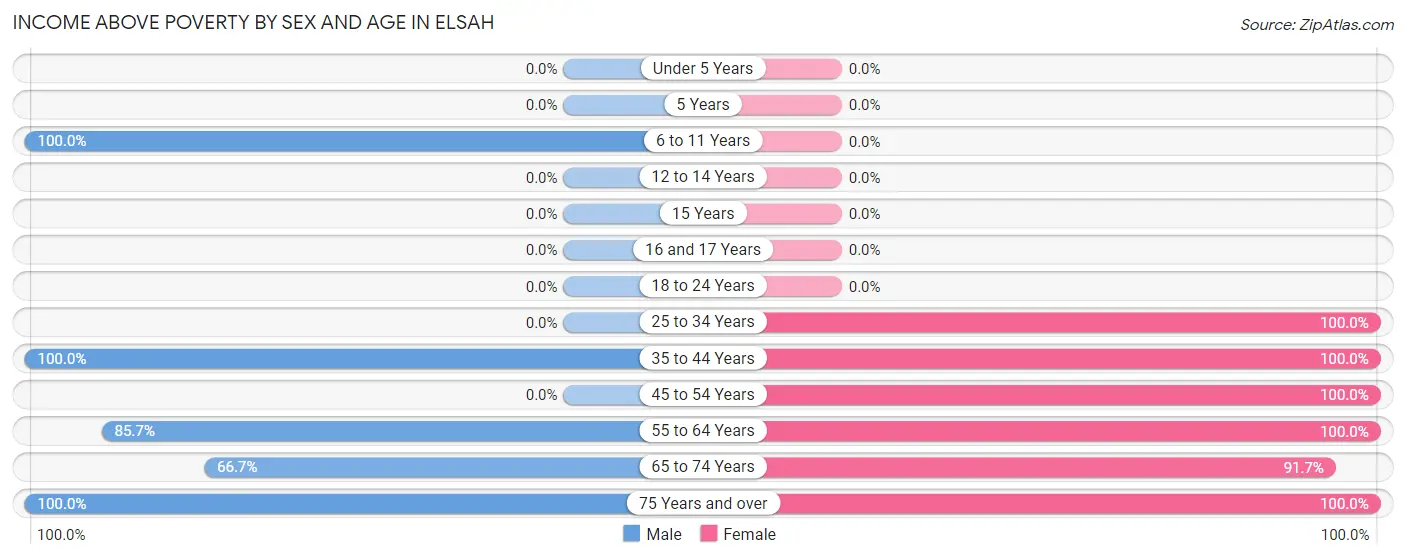
| Age Bracket | Male | Female |
| Under 5 Years | 0 (0.0%) | 0 (0.0%) |
| 5 Years | 0 (0.0%) | 0 (0.0%) |
| 6 to 11 Years | 6 (100.0%) | 0 (0.0%) |
| 12 to 14 Years | 0 (0.0%) | 0 (0.0%) |
| 15 Years | 0 (0.0%) | 0 (0.0%) |
| 16 and 17 Years | 0 (0.0%) | 0 (0.0%) |
| 18 to 24 Years | 0 (0.0%) | 0 (0.0%) |
| 25 to 34 Years | 0 (0.0%) | 3 (100.0%) |
| 35 to 44 Years | 4 (100.0%) | 9 (100.0%) |
| 45 to 54 Years | 0 (0.0%) | 2 (100.0%) |
| 55 to 64 Years | 6 (85.7%) | 9 (100.0%) |
| 65 to 74 Years | 4 (66.7%) | 11 (91.7%) |
| 75 Years and over | 5 (100.0%) | 7 (100.0%) |
| Total | 25 (78.1%) | 41 (97.6%) |
Income Below Poverty Among Married-Couple Families in Elsah
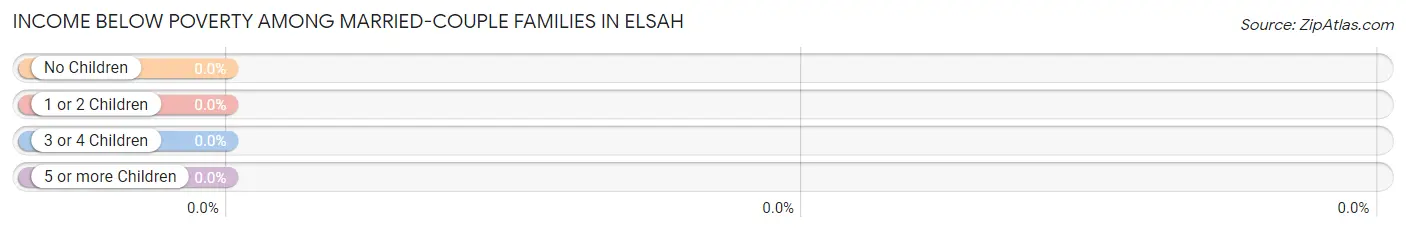
| Children | Above Poverty | Below Poverty |
| No Children | 15 (100.0%) | 0 (0.0%) |
| 1 or 2 Children | 3 (100.0%) | 0 (0.0%) |
| 3 or 4 Children | 0 (0.0%) | 0 (0.0%) |
| 5 or more Children | 0 (0.0%) | 0 (0.0%) |
| Total | 18 (100.0%) | 0 (0.0%) |
Income Below Poverty Among Single-Parent Households in Elsah
| Children | Single Father | Single Mother |
| No Children | 0 (0.0%) | 0 (0.0%) |
| 1 or 2 Children | 0 (0.0%) | 0 (0.0%) |
| 3 or 4 Children | 0 (0.0%) | 0 (0.0%) |
| 5 or more Children | 0 (0.0%) | 0 (0.0%) |
| Total | 0 (0.0%) | 0 (0.0%) |
Income Below Poverty Among Married-Couple vs Single-Parent Households in Elsah
| Children | Married-Couple Families | Single-Parent Households |
| No Children | 0 (0.0%) | 0 (0.0%) |
| 1 or 2 Children | 0 (0.0%) | 0 (0.0%) |
| 3 or 4 Children | 0 (0.0%) | 0 (0.0%) |
| 5 or more Children | 0 (0.0%) | 0 (0.0%) |
| Total | 0 (0.0%) | 0 (0.0%) |
Race in Elsah
The most populous races in Elsah are White / Caucasian (452 | 71.9%), Black / African American (86 | 13.7%), and Asian (51 | 8.1%).
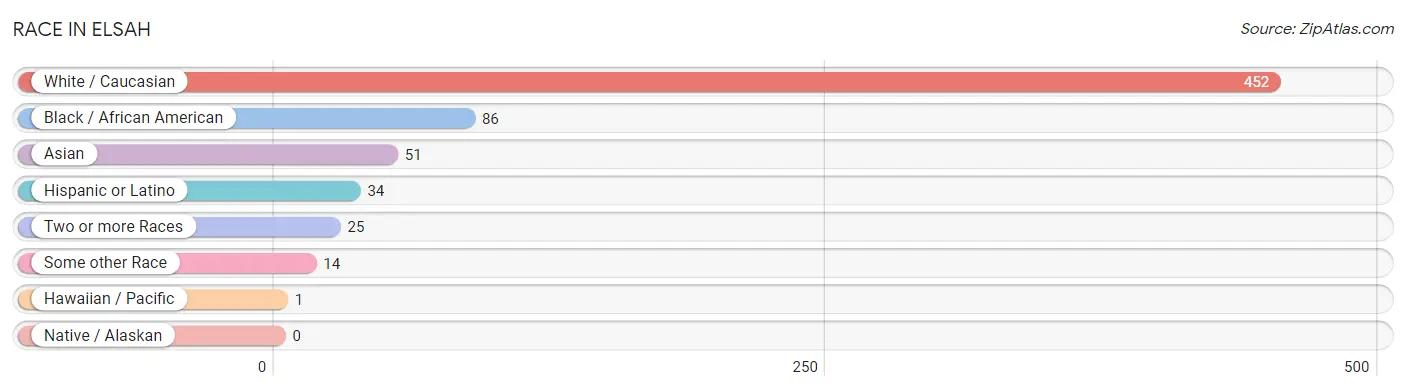
| Race | # Population | % Population |
| Asian | 51 | 8.1% |
| Black / African American | 86 | 13.7% |
| Hawaiian / Pacific | 1 | 0.2% |
| Hispanic or Latino | 34 | 5.4% |
| Native / Alaskan | 0 | 0.0% |
| White / Caucasian | 452 | 71.9% |
| Two or more Races | 25 | 4.0% |
| Some other Race | 14 | 2.2% |
| Total | 629 | 100.0% |
Ancestry in Elsah
The most populous ancestries reported in Elsah are German (147 | 23.4%), English (126 | 20.0%), Irish (50 | 8.0%), Burmese (35 | 5.6%), and Mexican (23 | 3.7%), together accounting for 60.6% of all Elsah residents.
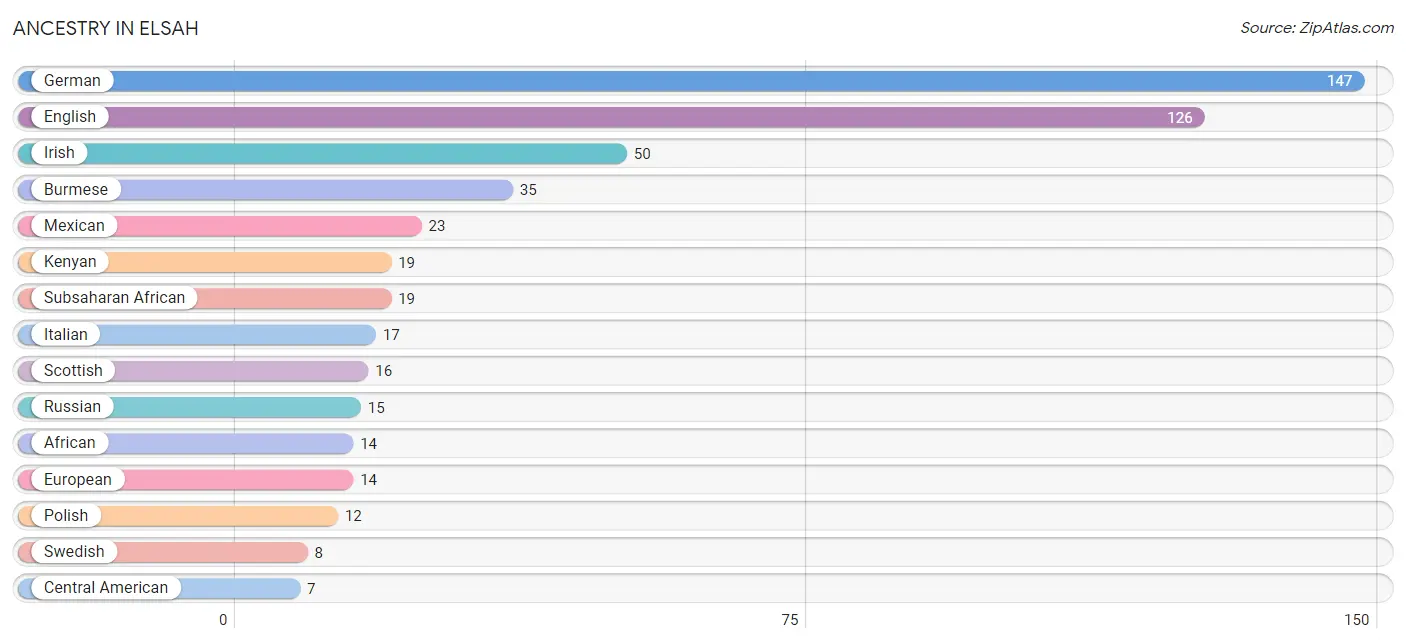
| Ancestry | # Population | % Population |
| African | 14 | 2.2% |
| American | 4 | 0.6% |
| Arab | 1 | 0.2% |
| Bangladeshi | 1 | 0.2% |
| British | 5 | 0.8% |
| Burmese | 35 | 5.6% |
| Central American | 7 | 1.1% |
| Colombian | 4 | 0.6% |
| Danish | 2 | 0.3% |
| Dutch | 5 | 0.8% |
| English | 126 | 20.0% |
| European | 14 | 2.2% |
| French | 6 | 0.9% |
| French Canadian | 5 | 0.8% |
| German | 147 | 23.4% |
| Hungarian | 3 | 0.5% |
| Indian (Asian) | 7 | 1.1% |
| Irish | 50 | 8.0% |
| Italian | 17 | 2.7% |
| Kenyan | 19 | 3.0% |
| Laotian | 5 | 0.8% |
| Lebanese | 1 | 0.2% |
| Mexican | 23 | 3.7% |
| Norwegian | 7 | 1.1% |
| Polish | 12 | 1.9% |
| Russian | 15 | 2.4% |
| Salvadoran | 7 | 1.1% |
| Scandinavian | 3 | 0.5% |
| Scotch-Irish | 1 | 0.2% |
| Scottish | 16 | 2.5% |
| South American | 4 | 0.6% |
| Subsaharan African | 19 | 3.0% |
| Swedish | 8 | 1.3% |
| Swiss | 3 | 0.5% |
| Tongan | 1 | 0.2% |
| Welsh | 6 | 0.9% | View All 36 Rows |
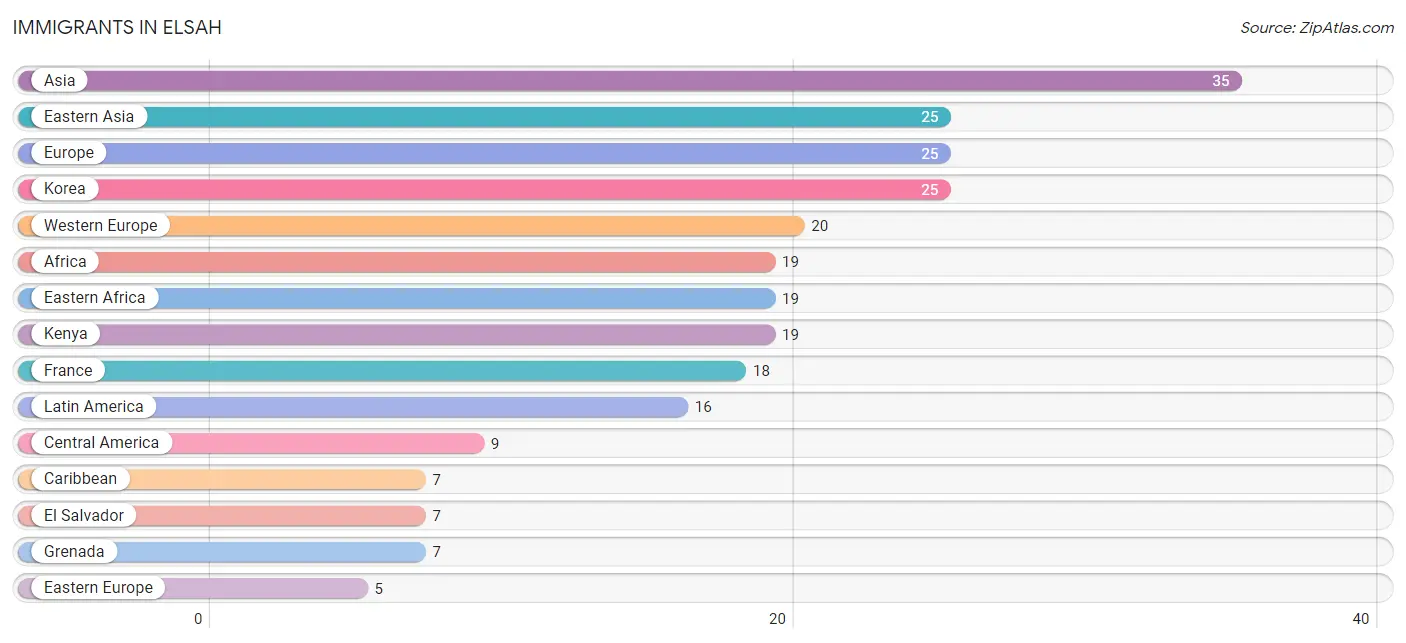
Immigrants in Elsah
The most numerous immigrant groups reported in Elsah came from Asia (35 | 5.6%), Eastern Asia (25 | 4.0%), Europe (25 | 4.0%), Korea (25 | 4.0%), and Western Europe (20 | 3.2%), together accounting for 20.7% of all Elsah residents.
| Immigration Origin | # Population | % Population |
| Africa | 19 | 3.0% |
| Asia | 35 | 5.6% |
| Caribbean | 7 | 1.1% |
| Central America | 9 | 1.4% |
| Eastern Africa | 19 | 3.0% |
| Eastern Asia | 25 | 4.0% |
| Eastern Europe | 5 | 0.8% |
| El Salvador | 7 | 1.1% |
| Europe | 25 | 4.0% |
| France | 18 | 2.9% |
| Germany | 2 | 0.3% |
| Grenada | 7 | 1.1% |
| India | 3 | 0.5% |
| Indonesia | 5 | 0.8% |
| Kenya | 19 | 3.0% |
| Korea | 25 | 4.0% |
| Latin America | 16 | 2.5% |
| Mexico | 2 | 0.3% |
| Poland | 5 | 0.8% |
| South Central Asia | 3 | 0.5% |
| South Eastern Asia | 5 | 0.8% |
| Western Europe | 20 | 3.2% | View All 22 Rows |
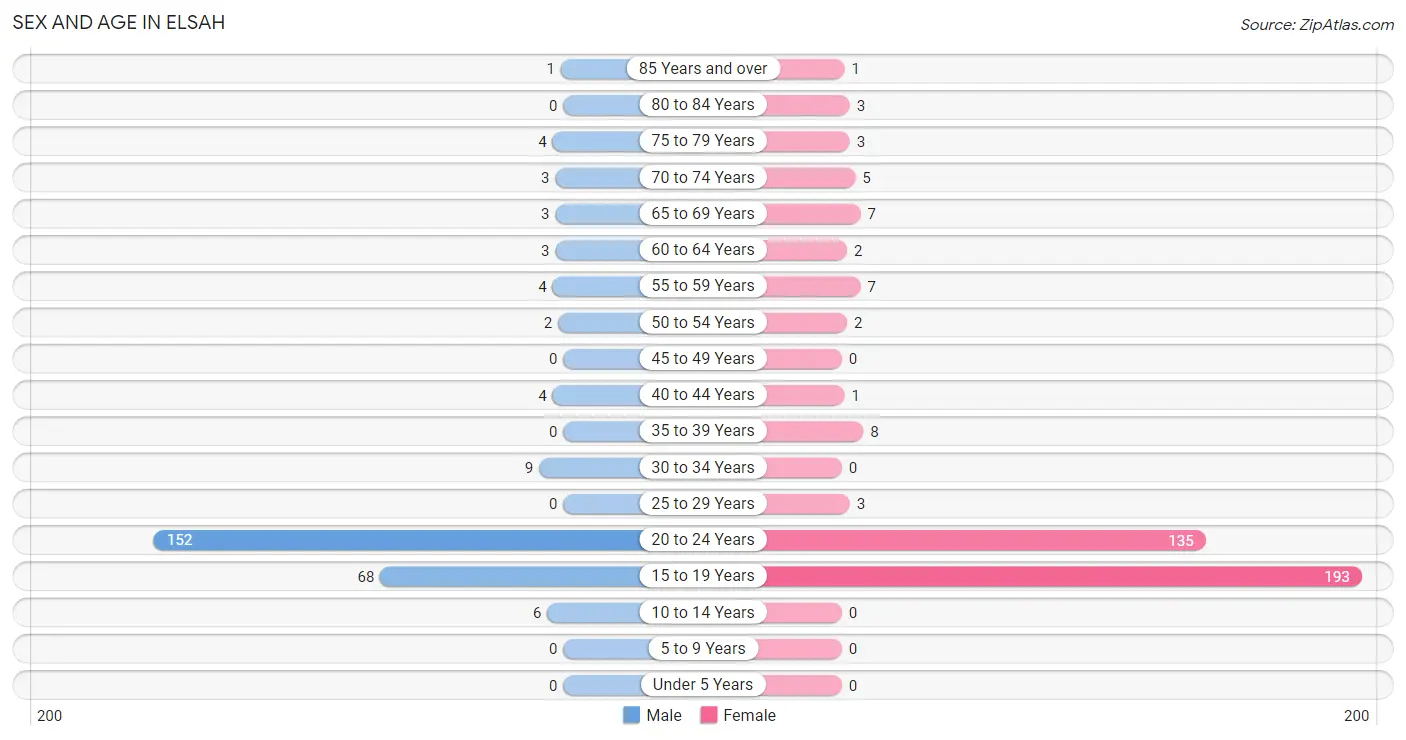
Sex and Age in Elsah
Sex and Age in Elsah
The most populous age groups in Elsah are 20 to 24 Years (152 | 58.7%) for men and 15 to 19 Years (193 | 52.2%) for women.
| Age Bracket | Male | Female |
| Under 5 Years | 0 (0.0%) | 0 (0.0%) |
| 5 to 9 Years | 0 (0.0%) | 0 (0.0%) |
| 10 to 14 Years | 6 (2.3%) | 0 (0.0%) |
| 15 to 19 Years | 68 (26.3%) | 193 (52.2%) |
| 20 to 24 Years | 152 (58.7%) | 135 (36.5%) |
| 25 to 29 Years | 0 (0.0%) | 3 (0.8%) |
| 30 to 34 Years | 9 (3.5%) | 0 (0.0%) |
| 35 to 39 Years | 0 (0.0%) | 8 (2.2%) |
| 40 to 44 Years | 4 (1.5%) | 1 (0.3%) |
| 45 to 49 Years | 0 (0.0%) | 0 (0.0%) |
| 50 to 54 Years | 2 (0.8%) | 2 (0.5%) |
| 55 to 59 Years | 4 (1.5%) | 7 (1.9%) |
| 60 to 64 Years | 3 (1.2%) | 2 (0.5%) |
| 65 to 69 Years | 3 (1.2%) | 7 (1.9%) |
| 70 to 74 Years | 3 (1.2%) | 5 (1.3%) |
| 75 to 79 Years | 4 (1.5%) | 3 (0.8%) |
| 80 to 84 Years | 0 (0.0%) | 3 (0.8%) |
| 85 Years and over | 1 (0.4%) | 1 (0.3%) |
| Total | 259 (100.0%) | 370 (100.0%) |
Families and Households in Elsah
Median Family Size in Elsah
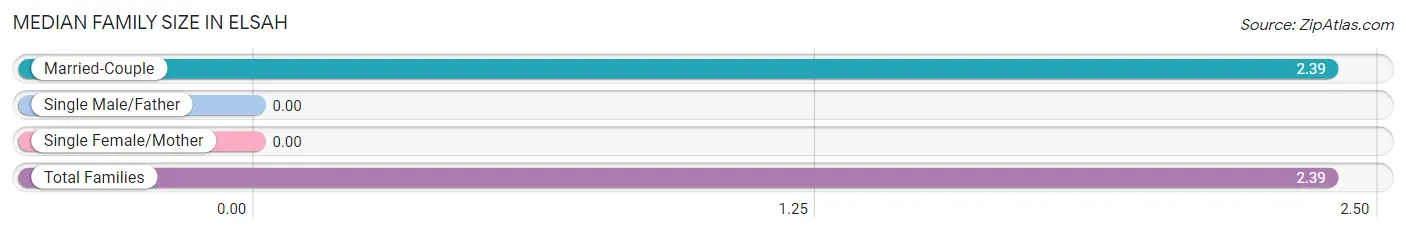
| Family Type | # Families | Family Size |
| Married-Couple | 18 (100.0%) | 2.39 |
| Single Male/Father | 0 (0.0%) | - |
| Single Female/Mother | 0 (0.0%) | - |
| Total Families | 18 (100.0%) | 2.39 |
Median Household Size in Elsah
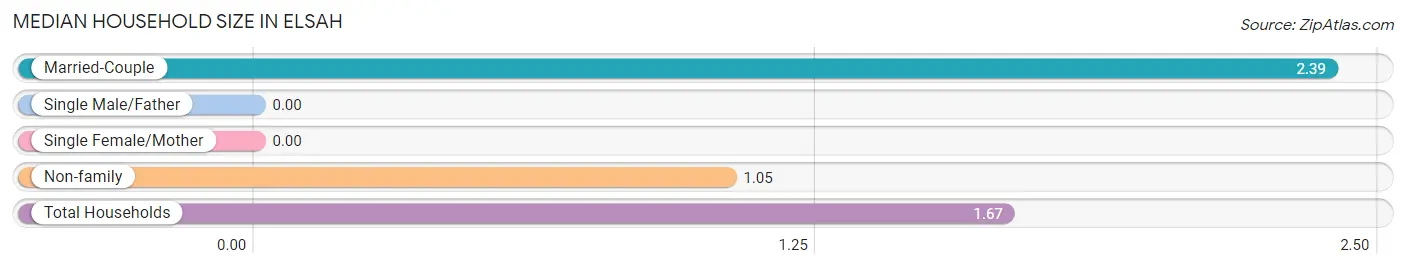
| Household Type | # Households | Household Size |
| Married-Couple | 18 (46.2%) | 2.39 |
| Single Male/Father | 0 (0.0%) | - |
| Single Female/Mother | 0 (0.0%) | - |
| Non-family | 21 (53.8%) | 1.05 |
| Total Households | 39 (100.0%) | 1.67 |
Household Size by Marriage Status in Elsah
Out of a total of 39 households in Elsah, 18 (46.2%) are family households, while 21 (53.8%) are nonfamily households. The most numerous type of family households are 2-person households, comprising 14, and the most common type of nonfamily households are 1-person households, comprising 20.
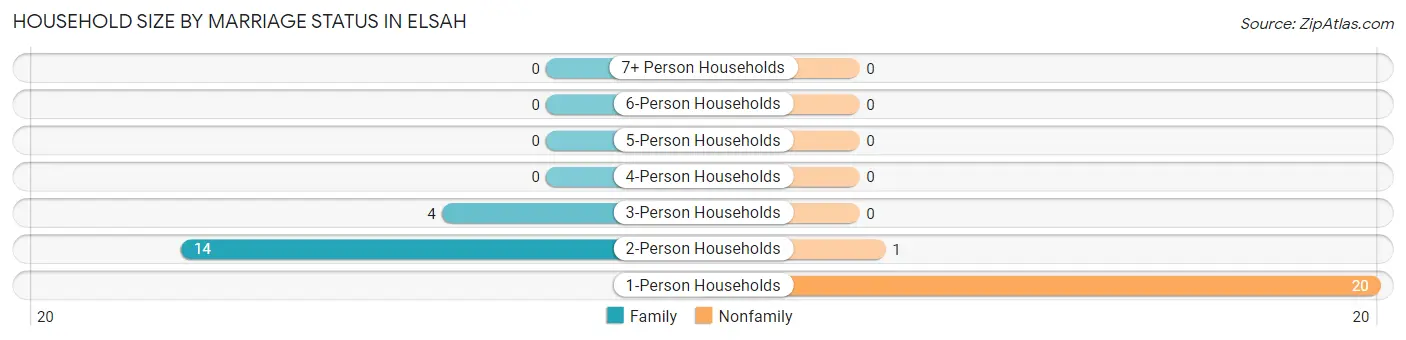
| Household Size | Family Households | Nonfamily Households |
| 1-Person Households | - | 20 (51.3%) |
| 2-Person Households | 14 (35.9%) | 1 (2.6%) |
| 3-Person Households | 4 (10.3%) | 0 (0.0%) |
| 4-Person Households | 0 (0.0%) | 0 (0.0%) |
| 5-Person Households | 0 (0.0%) | 0 (0.0%) |
| 6-Person Households | 0 (0.0%) | 0 (0.0%) |
| 7+ Person Households | 0 (0.0%) | 0 (0.0%) |
| Total | 18 (46.2%) | 21 (53.8%) |
Female Fertility in Elsah
Fertility by Age in Elsah
| Age Bracket | Women with Births | Births / 1,000 Women |
| 15 to 19 years | 0 (0.0%) | 0.0 |
| 20 to 34 years | 0 (0.0%) | 0.0 |
| 35 to 50 years | 0 (0.0%) | 0.0 |
| Total | 0 (0.0%) | 0.0 |
Fertility by Age by Marriage Status in Elsah
| Age Bracket | Married | Unmarried |
| 15 to 19 years | 0 (0.0%) | 0 (0.0%) |
| 20 to 34 years | 0 (0.0%) | 0 (0.0%) |
| 35 to 50 years | 0 (0.0%) | 0 (0.0%) |
| Total | 0 (0.0%) | 0 (0.0%) |
Fertility by Education in Elsah
| Educational Attainment | Women with Births | Births / 1,000 Women |
| Less than High School | 0 (0.0%) | 0.0 |
| High School Diploma | 0 (0.0%) | 0.0 |
| College or Associate's Degree | 0 (0.0%) | 0.0 |
| Bachelor's Degree | 0 (0.0%) | 0.0 |
| Graduate Degree | 0 (0.0%) | 0.0 |
| Total | 0 (0.0%) | 0.0 |
Fertility by Education by Marriage Status in Elsah
| Educational Attainment | Married | Unmarried |
| Less than High School | 0 (0.0%) | 0 (0.0%) |
| High School Diploma | 0 (0.0%) | 0 (0.0%) |
| College or Associate's Degree | 0 (0.0%) | 0 (0.0%) |
| Bachelor's Degree | 0 (0.0%) | 0 (0.0%) |
| Graduate Degree | 0 (0.0%) | 0 (0.0%) |
| Total | 0 (0.0%) | 0 (0.0%) |
Employment Characteristics in Elsah
Employment by Class of Employer in Elsah
Among the 233 employed individuals in Elsah, not-for-profit organizations (116 | 49.8%), private company employees (99 | 42.5%), and state government employees (10 | 4.3%) make up the most common classes of employment.
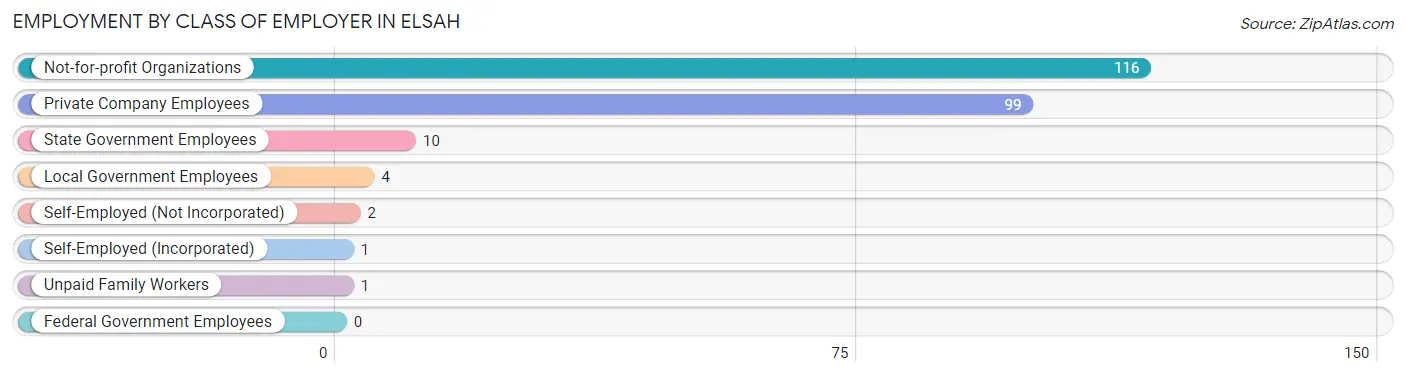
| Employer Class | # Employees | % Employees |
| Private Company Employees | 99 | 42.5% |
| Self-Employed (Incorporated) | 1 | 0.4% |
| Self-Employed (Not Incorporated) | 2 | 0.9% |
| Not-for-profit Organizations | 116 | 49.8% |
| Local Government Employees | 4 | 1.7% |
| State Government Employees | 10 | 4.3% |
| Federal Government Employees | 0 | 0.0% |
| Unpaid Family Workers | 1 | 0.4% |
| Total | 233 | 100.0% |
Employment Status by Age in Elsah
According to the labor force statistics for Elsah, out of the total population over 16 years of age (623), 45.4% or 283 individuals are in the labor force, with 4.6% or 13 of them unemployed. The age group with the highest labor force participation rate is 25 to 29 years, with 100.0% or 3 individuals in the labor force. Within the labor force, the 30 to 34 years age range has the highest percentage of unemployed individuals, with 28.6% or 2 of them being unemployed.
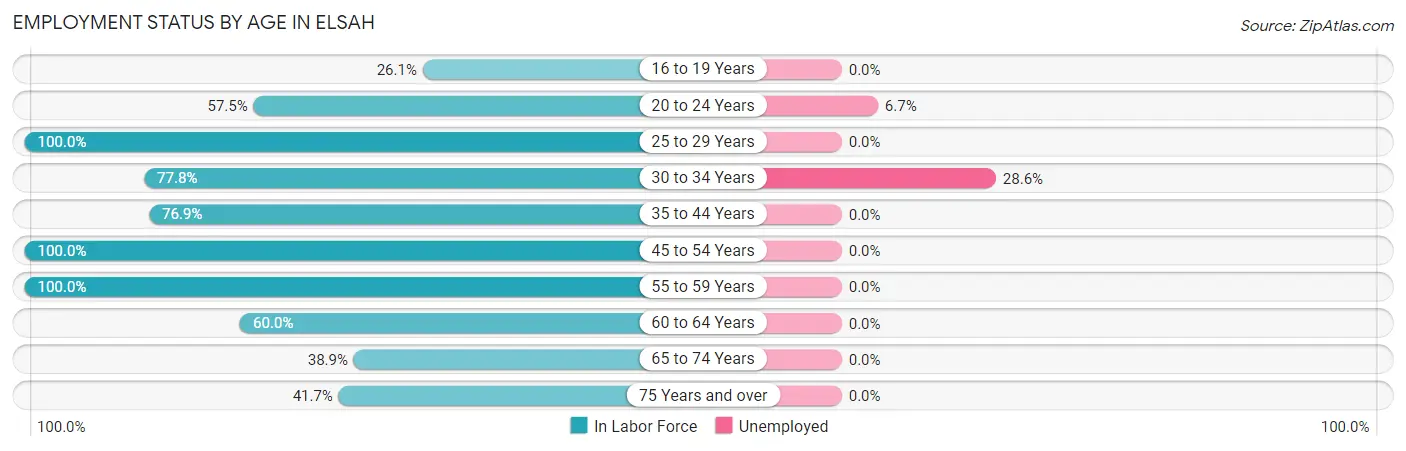
| Age Bracket | In Labor Force | Unemployed |
| 16 to 19 Years | 68 (26.1%) | 0 (0.0%) |
| 20 to 24 Years | 165 (57.5%) | 11 (6.7%) |
| 25 to 29 Years | 3 (100.0%) | 0 (0.0%) |
| 30 to 34 Years | 7 (77.8%) | 2 (28.6%) |
| 35 to 44 Years | 10 (76.9%) | 0 (0.0%) |
| 45 to 54 Years | 4 (100.0%) | 0 (0.0%) |
| 55 to 59 Years | 11 (100.0%) | 0 (0.0%) |
| 60 to 64 Years | 3 (60.0%) | 0 (0.0%) |
| 65 to 74 Years | 7 (38.9%) | 0 (0.0%) |
| 75 Years and over | 5 (41.7%) | 0 (0.0%) |
| Total | 283 (45.4%) | 13 (4.6%) |
Employment Status by Educational Attainment in Elsah
According to labor force statistics for Elsah, 84.4% of individuals (38) out of the total population between 25 and 64 years of age (45) are in the labor force, with 5.3% or 2 of them being unemployed. The group with the highest labor force participation rate are those with the educational attainment of less than high school, with 100.0% or 2 individuals in the labor force. Within the labor force, individuals with less than high school education have the highest percentage of unemployment, with 100.0% or 2 of them being unemployed.
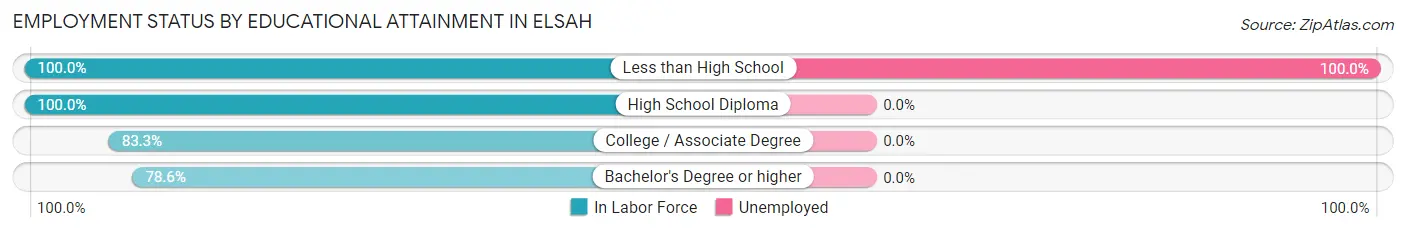
| Educational Attainment | In Labor Force | Unemployed |
| Less than High School | 2 (100.0%) | 2 (100.0%) |
| High School Diploma | 9 (100.0%) | 0 (0.0%) |
| College / Associate Degree | 5 (83.3%) | 0 (0.0%) |
| Bachelor's Degree or higher | 22 (78.6%) | 0 (0.0%) |
| Total | 38 (84.4%) | 2 (5.3%) |
Employment Occupations by Sex in Elsah
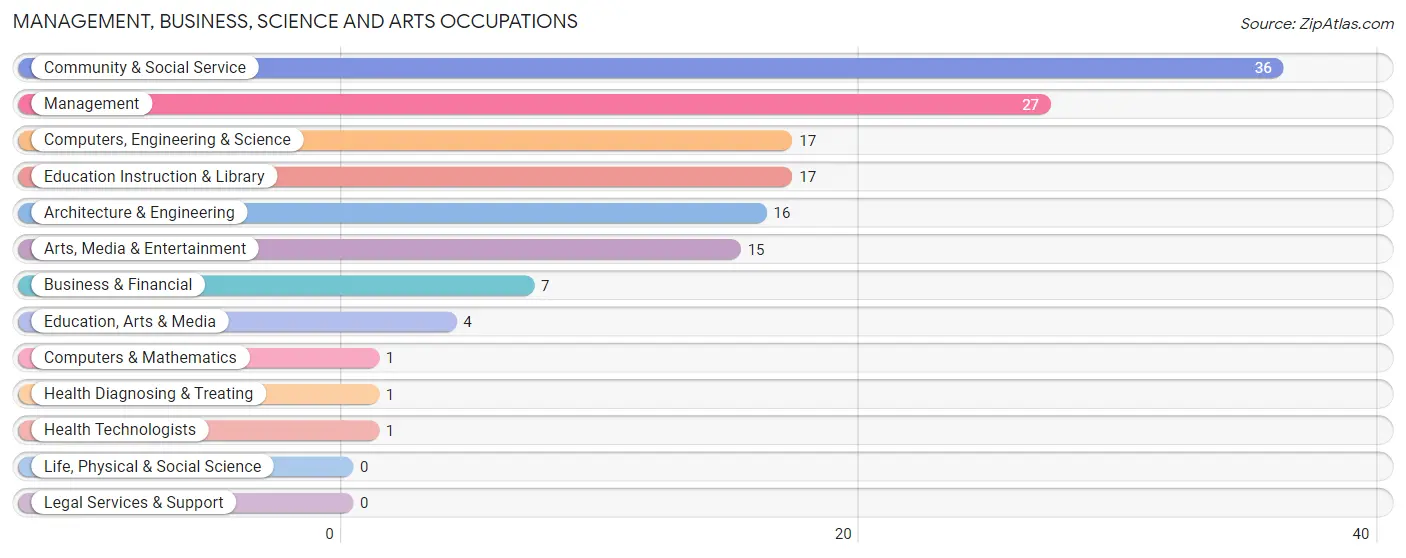
Management, Business, Science and Arts Occupations
The most common Management, Business, Science and Arts occupations in Elsah are Community & Social Service (36 | 13.3%), Management (27 | 10.0%), Computers, Engineering & Science (17 | 6.3%), Education Instruction & Library (17 | 6.3%), and Architecture & Engineering (16 | 5.9%).
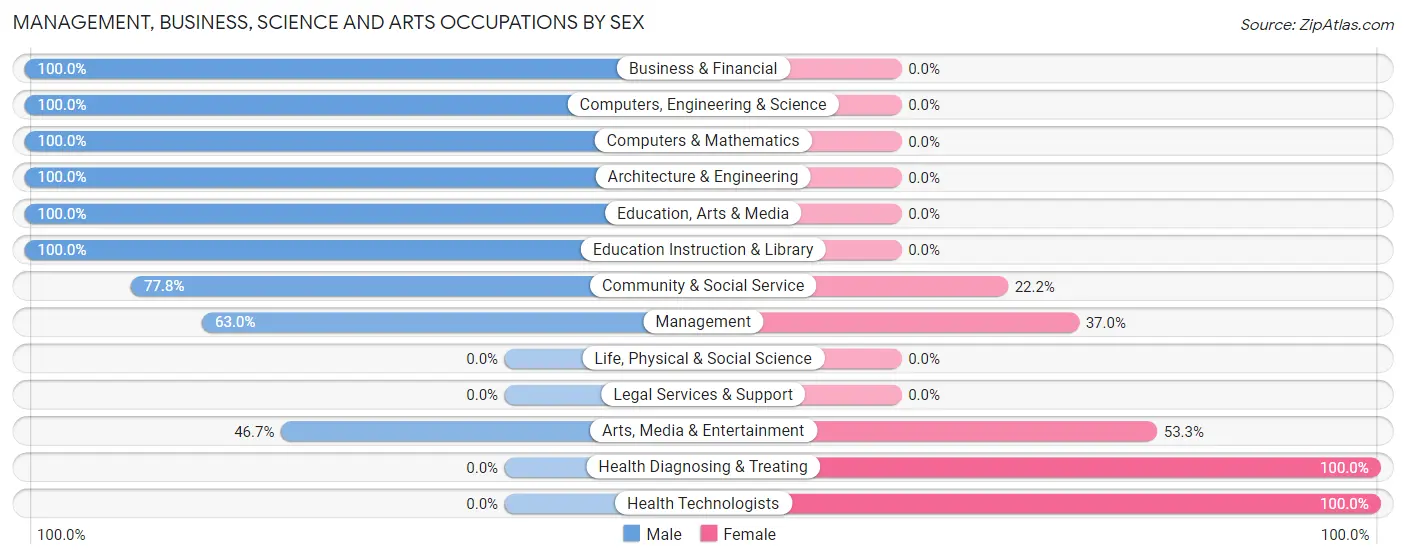
Management, Business, Science and Arts Occupations by Sex
Within the Management, Business, Science and Arts occupations in Elsah, the most male-oriented occupations are Business & Financial (100.0%), Computers, Engineering & Science (100.0%), and Computers & Mathematics (100.0%), while the most female-oriented occupations are Health Diagnosing & Treating (100.0%), Health Technologists (100.0%), and Arts, Media & Entertainment (53.3%).
| Occupation | Male | Female |
| Management | 17 (63.0%) | 10 (37.0%) |
| Business & Financial | 7 (100.0%) | 0 (0.0%) |
| Computers, Engineering & Science | 17 (100.0%) | 0 (0.0%) |
| Computers & Mathematics | 1 (100.0%) | 0 (0.0%) |
| Architecture & Engineering | 16 (100.0%) | 0 (0.0%) |
| Life, Physical & Social Science | 0 (0.0%) | 0 (0.0%) |
| Community & Social Service | 28 (77.8%) | 8 (22.2%) |
| Education, Arts & Media | 4 (100.0%) | 0 (0.0%) |
| Legal Services & Support | 0 (0.0%) | 0 (0.0%) |
| Education Instruction & Library | 17 (100.0%) | 0 (0.0%) |
| Arts, Media & Entertainment | 7 (46.7%) | 8 (53.3%) |
| Health Diagnosing & Treating | 0 (0.0%) | 1 (100.0%) |
| Health Technologists | 0 (0.0%) | 1 (100.0%) |
| Total (Category) | 69 (78.4%) | 19 (21.6%) |
| Total (Overall) | 153 (56.7%) | 117 (43.3%) |
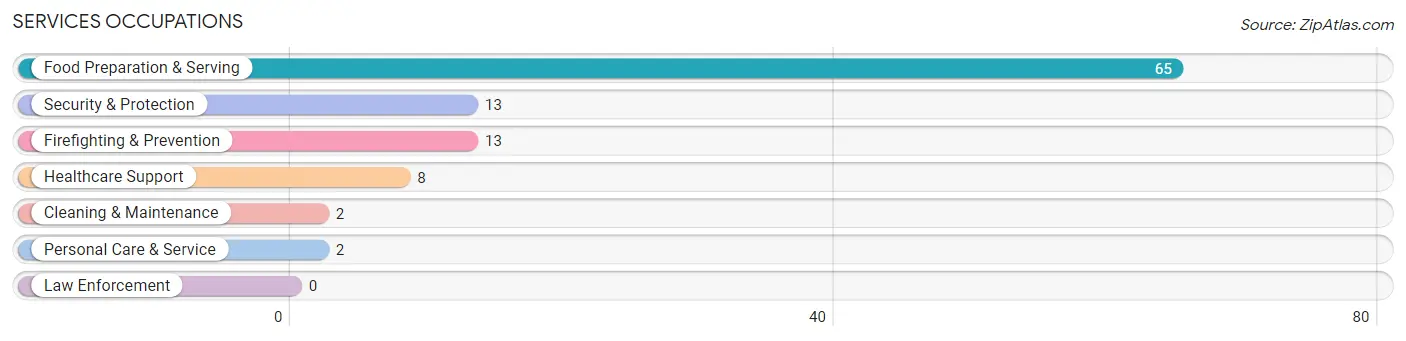
Services Occupations
The most common Services occupations in Elsah are Food Preparation & Serving (65 | 24.1%), Security & Protection (13 | 4.8%), Firefighting & Prevention (13 | 4.8%), Healthcare Support (8 | 3.0%), and Cleaning & Maintenance (2 | 0.7%).
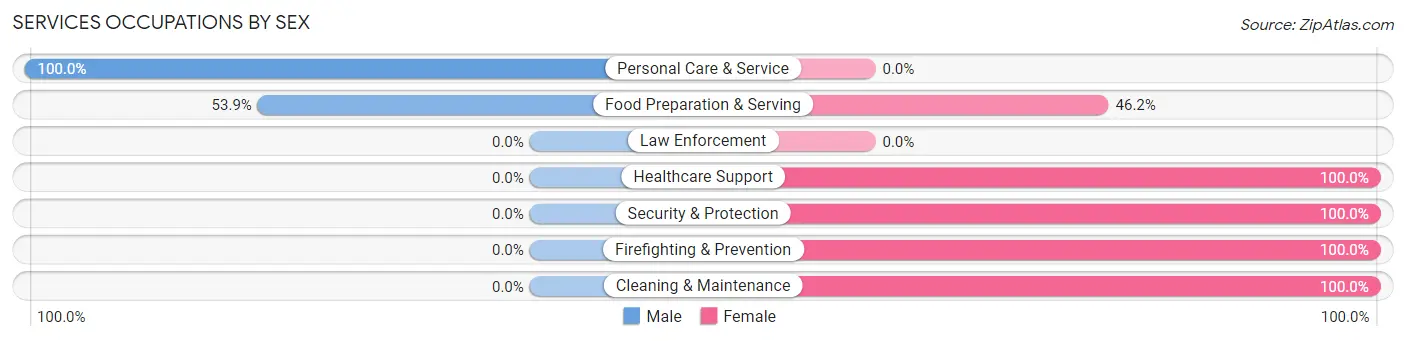
Services Occupations by Sex
Within the Services occupations in Elsah, the most male-oriented occupations are Personal Care & Service (100.0%), and Food Preparation & Serving (53.8%), while the most female-oriented occupations are Healthcare Support (100.0%), Security & Protection (100.0%), and Firefighting & Prevention (100.0%).
| Occupation | Male | Female |
| Healthcare Support | 0 (0.0%) | 8 (100.0%) |
| Security & Protection | 0 (0.0%) | 13 (100.0%) |
| Firefighting & Prevention | 0 (0.0%) | 13 (100.0%) |
| Law Enforcement | 0 (0.0%) | 0 (0.0%) |
| Food Preparation & Serving | 35 (53.8%) | 30 (46.2%) |
| Cleaning & Maintenance | 0 (0.0%) | 2 (100.0%) |
| Personal Care & Service | 2 (100.0%) | 0 (0.0%) |
| Total (Category) | 37 (41.1%) | 53 (58.9%) |
| Total (Overall) | 153 (56.7%) | 117 (43.3%) |
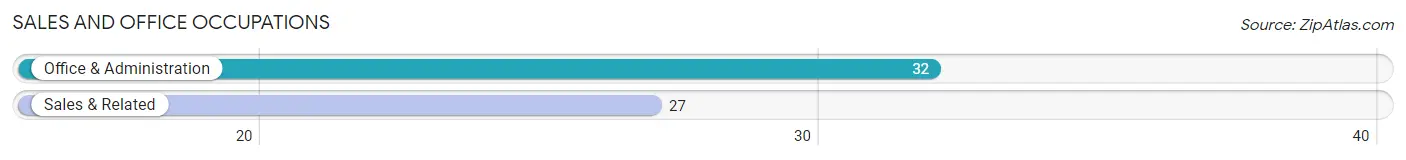
Sales and Office Occupations
The most common Sales and Office occupations in Elsah are Office & Administration (32 | 11.8%), and Sales & Related (27 | 10.0%).
Sales and Office Occupations by Sex
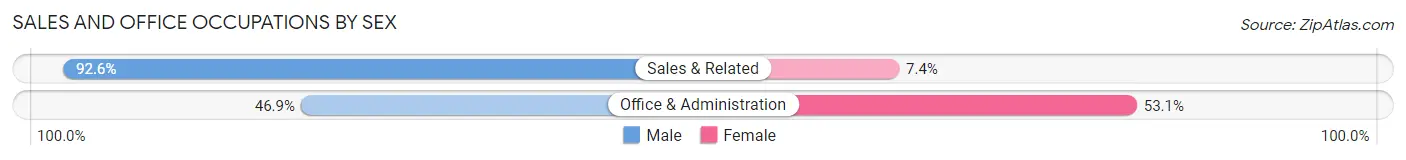
| Occupation | Male | Female |
| Sales & Related | 25 (92.6%) | 2 (7.4%) |
| Office & Administration | 15 (46.9%) | 17 (53.1%) |
| Total (Category) | 40 (67.8%) | 19 (32.2%) |
| Total (Overall) | 153 (56.7%) | 117 (43.3%) |
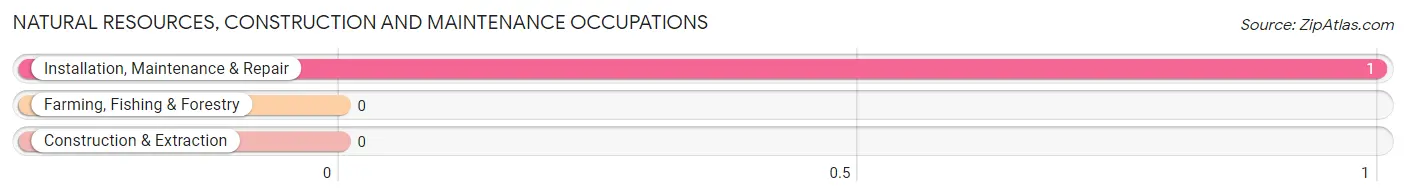
Natural Resources, Construction and Maintenance Occupations
The most common Natural Resources, Construction and Maintenance occupations in Elsah are , and Installation, Maintenance & Repair (1 | 0.4%).
Natural Resources, Construction and Maintenance Occupations by Sex
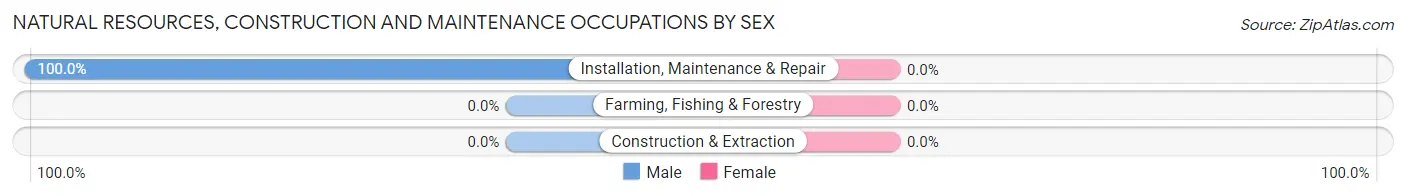
| Occupation | Male | Female |
| Farming, Fishing & Forestry | 0 (0.0%) | 0 (0.0%) |
| Construction & Extraction | 0 (0.0%) | 0 (0.0%) |
| Installation, Maintenance & Repair | 1 (100.0%) | 0 (0.0%) |
| Total (Category) | 1 (100.0%) | 0 (0.0%) |
| Total (Overall) | 153 (56.7%) | 117 (43.3%) |
Production, Transportation and Moving Occupations
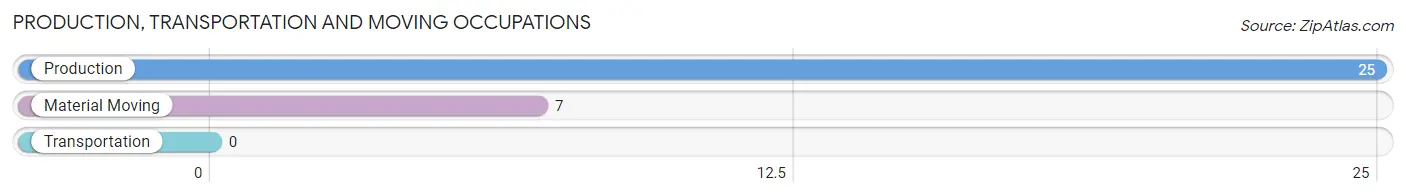
The most common Production, Transportation and Moving occupations in Elsah are Production (25 | 9.3%), and Material Moving (7 | 2.6%).
Production, Transportation and Moving Occupations by Sex
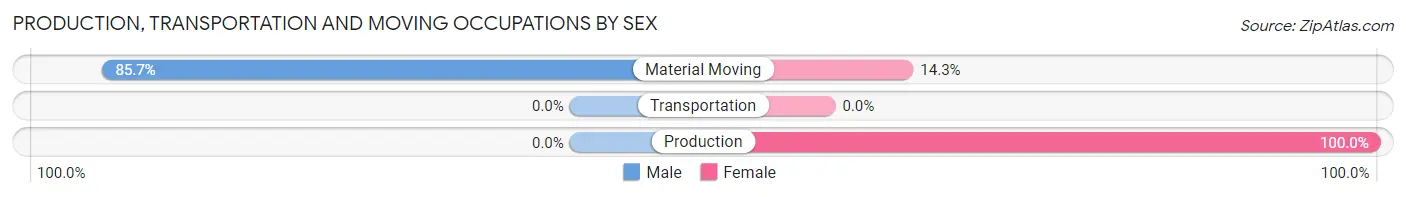
| Occupation | Male | Female |
| Production | 0 (0.0%) | 25 (100.0%) |
| Transportation | 0 (0.0%) | 0 (0.0%) |
| Material Moving | 6 (85.7%) | 1 (14.3%) |
| Total (Category) | 6 (18.8%) | 26 (81.2%) |
| Total (Overall) | 153 (56.7%) | 117 (43.3%) |
Employment Industries by Sex in Elsah
Employment Industries in Elsah
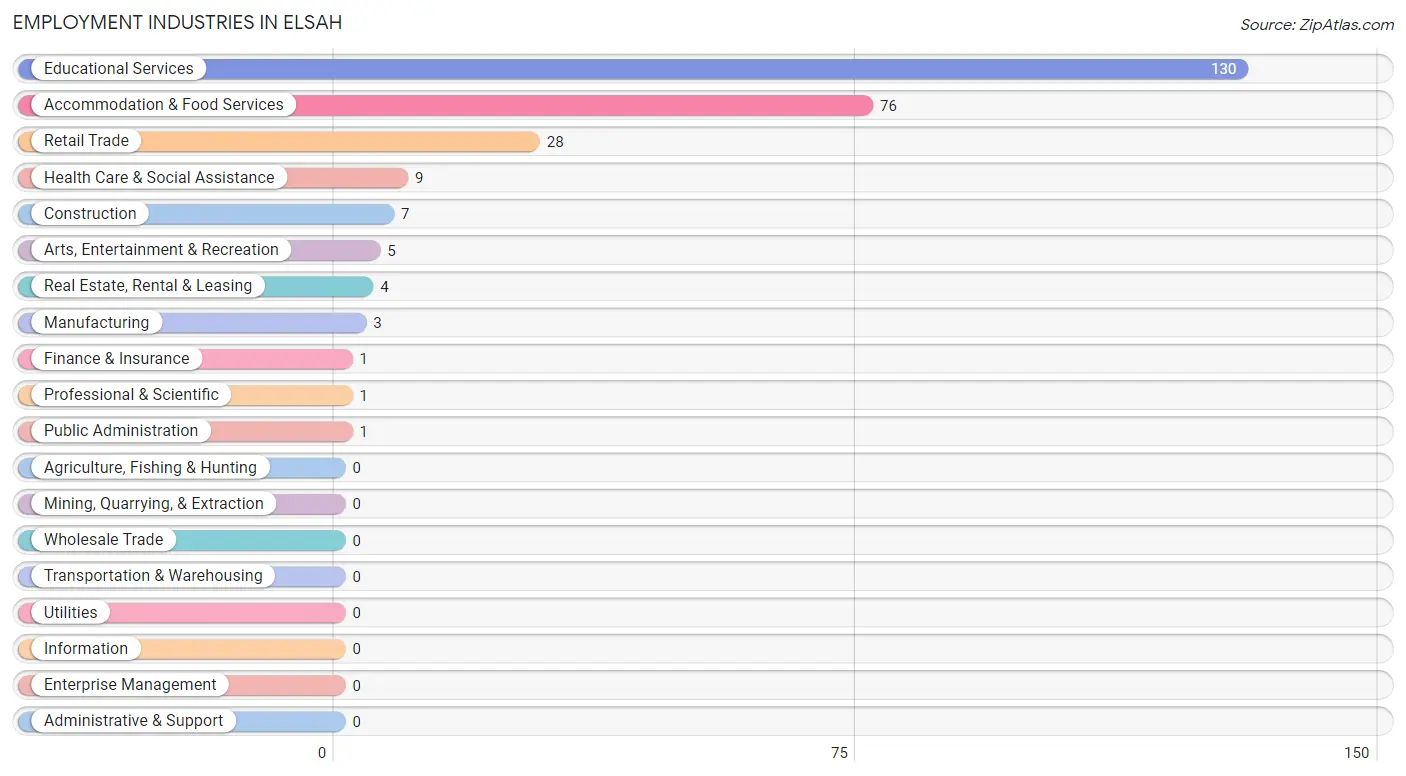
The major employment industries in Elsah include Educational Services (130 | 48.1%), Accommodation & Food Services (76 | 28.1%), Retail Trade (28 | 10.4%), Health Care & Social Assistance (9 | 3.3%), and Construction (7 | 2.6%).
Employment Industries by Sex in Elsah
The Elsah industries that see more men than women are Manufacturing (100.0%), Finance & Insurance (100.0%), and Professional & Scientific (100.0%), whereas the industries that tend to have a higher number of women are Real Estate, Rental & Leasing (100.0%), Health Care & Social Assistance (100.0%), and Arts, Entertainment & Recreation (100.0%).
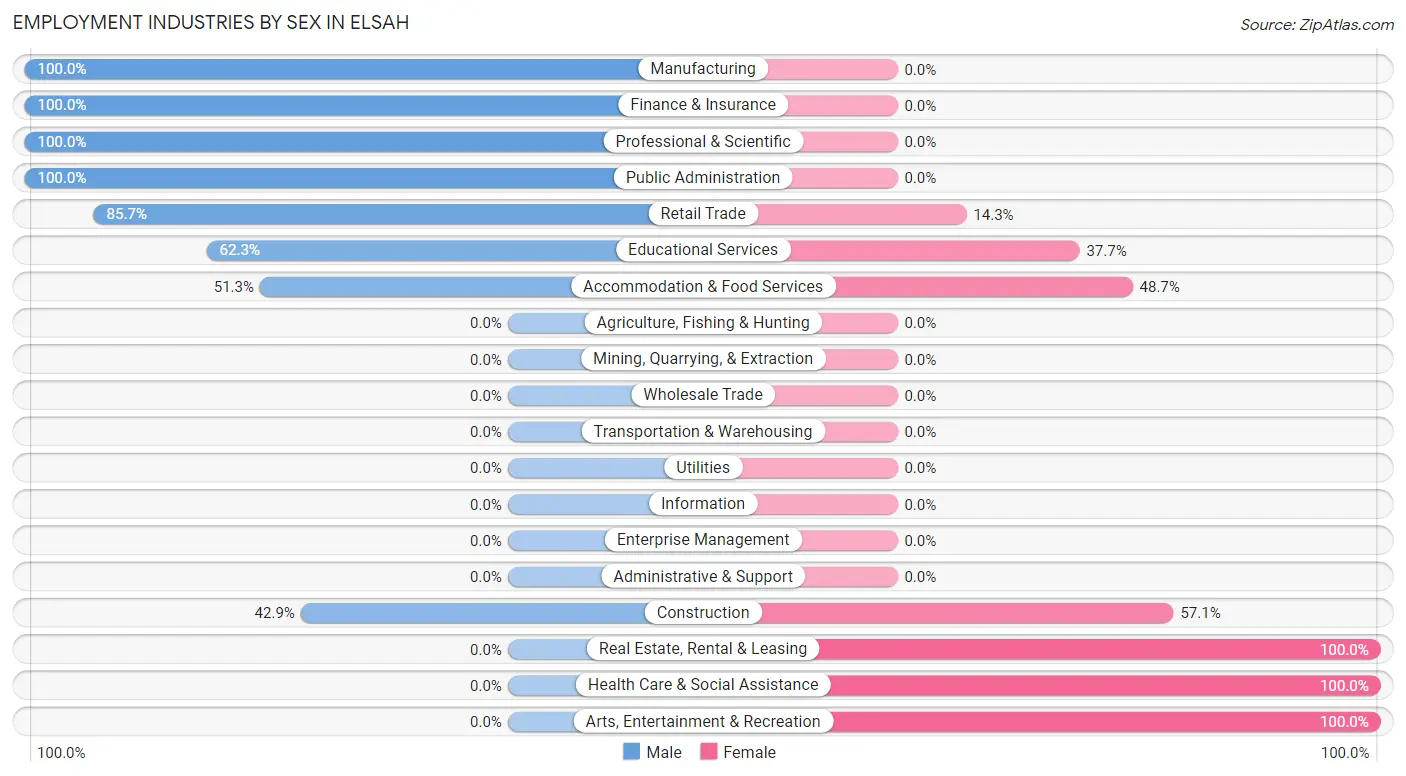
| Industry | Male | Female |
| Agriculture, Fishing & Hunting | 0 (0.0%) | 0 (0.0%) |
| Mining, Quarrying, & Extraction | 0 (0.0%) | 0 (0.0%) |
| Construction | 3 (42.9%) | 4 (57.1%) |
| Manufacturing | 3 (100.0%) | 0 (0.0%) |
| Wholesale Trade | 0 (0.0%) | 0 (0.0%) |
| Retail Trade | 24 (85.7%) | 4 (14.3%) |
| Transportation & Warehousing | 0 (0.0%) | 0 (0.0%) |
| Utilities | 0 (0.0%) | 0 (0.0%) |
| Information | 0 (0.0%) | 0 (0.0%) |
| Finance & Insurance | 1 (100.0%) | 0 (0.0%) |
| Real Estate, Rental & Leasing | 0 (0.0%) | 4 (100.0%) |
| Professional & Scientific | 1 (100.0%) | 0 (0.0%) |
| Enterprise Management | 0 (0.0%) | 0 (0.0%) |
| Administrative & Support | 0 (0.0%) | 0 (0.0%) |
| Educational Services | 81 (62.3%) | 49 (37.7%) |
| Health Care & Social Assistance | 0 (0.0%) | 9 (100.0%) |
| Arts, Entertainment & Recreation | 0 (0.0%) | 5 (100.0%) |
| Accommodation & Food Services | 39 (51.3%) | 37 (48.7%) |
| Public Administration | 1 (100.0%) | 0 (0.0%) |
| Total | 153 (56.7%) | 117 (43.3%) |
Education in Elsah
School Enrollment in Elsah
The most common levels of schooling among the 568 students in Elsah are college / undergraduate (525 | 92.4%), graduate / professional (37 | 6.5%), and middle school (6 | 1.1%).
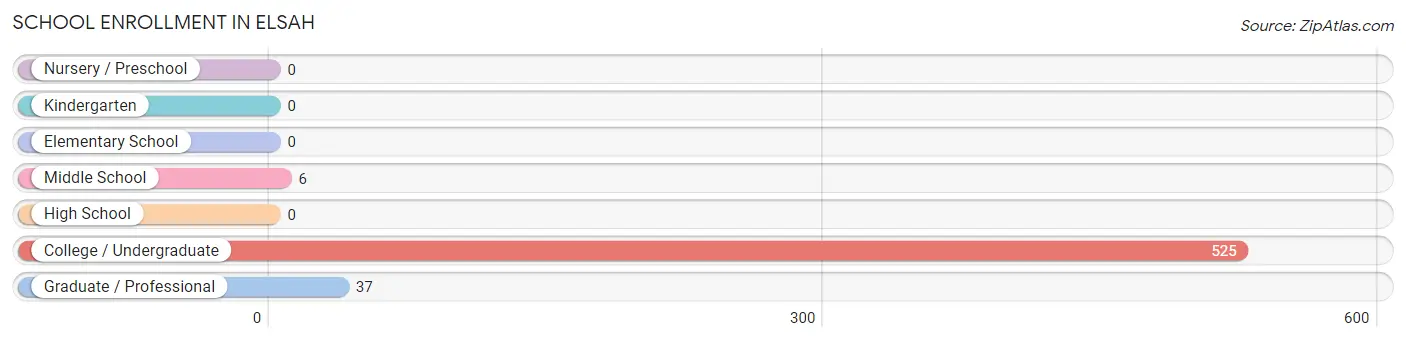
| School Level | # Students | % Students |
| Nursery / Preschool | 0 | 0.0% |
| Kindergarten | 0 | 0.0% |
| Elementary School | 0 | 0.0% |
| Middle School | 6 | 1.1% |
| High School | 0 | 0.0% |
| College / Undergraduate | 525 | 92.4% |
| Graduate / Professional | 37 | 6.5% |
| Total | 568 | 100.0% |
School Enrollment by Age by Funding Source in Elsah
Out of a total of 568 students who are enrolled in schools in Elsah, 402 (70.8%) attend a private institution, while the remaining 166 (29.2%) are enrolled in public schools. The age group of 20 to 24 year olds has the highest likelihood of being enrolled in private schools, with 231 (80.5% in the age bracket) enrolled. Conversely, the age group of 10 to 14 year olds has the lowest likelihood of being enrolled in a private school, with 6 (100.0% in the age bracket) attending a public institution.
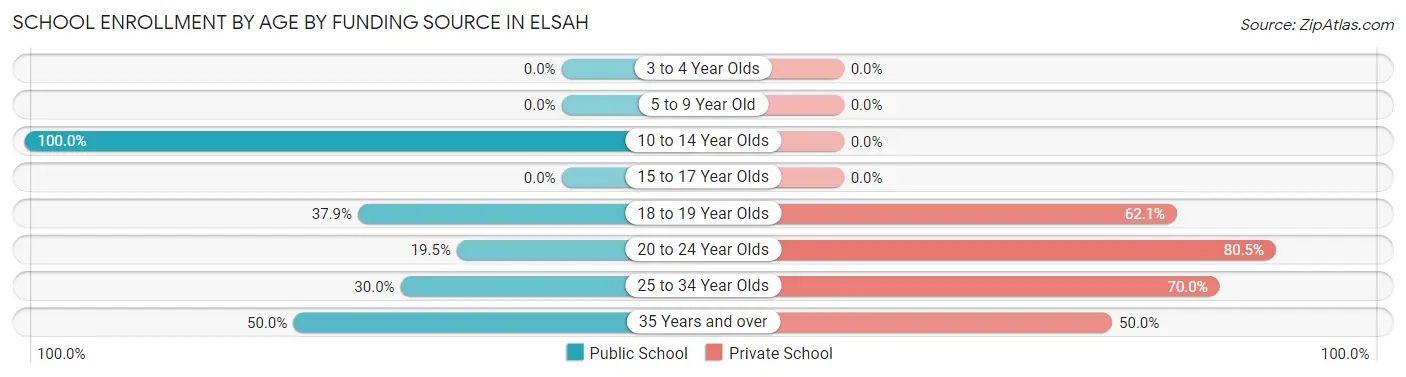
| Age Bracket | Public School | Private School |
| 3 to 4 Year Olds | 0 (0.0%) | 0 (0.0%) |
| 5 to 9 Year Old | 0 (0.0%) | 0 (0.0%) |
| 10 to 14 Year Olds | 6 (100.0%) | 0 (0.0%) |
| 15 to 17 Year Olds | 0 (0.0%) | 0 (0.0%) |
| 18 to 19 Year Olds | 99 (37.9%) | 162 (62.1%) |
| 20 to 24 Year Olds | 56 (19.5%) | 231 (80.5%) |
| 25 to 34 Year Olds | 3 (30.0%) | 7 (70.0%) |
| 35 Years and over | 2 (50.0%) | 2 (50.0%) |
| Total | 166 (29.2%) | 402 (70.8%) |
Educational Attainment by Field of Study in Elsah
Social sciences (11 | 22.5%), education (9 | 18.4%), liberal arts & history (8 | 16.3%), business (7 | 14.3%), and bio, nature & agricultural (6 | 12.2%) are the most common fields of study among 49 individuals in Elsah who have obtained a bachelor's degree or higher.
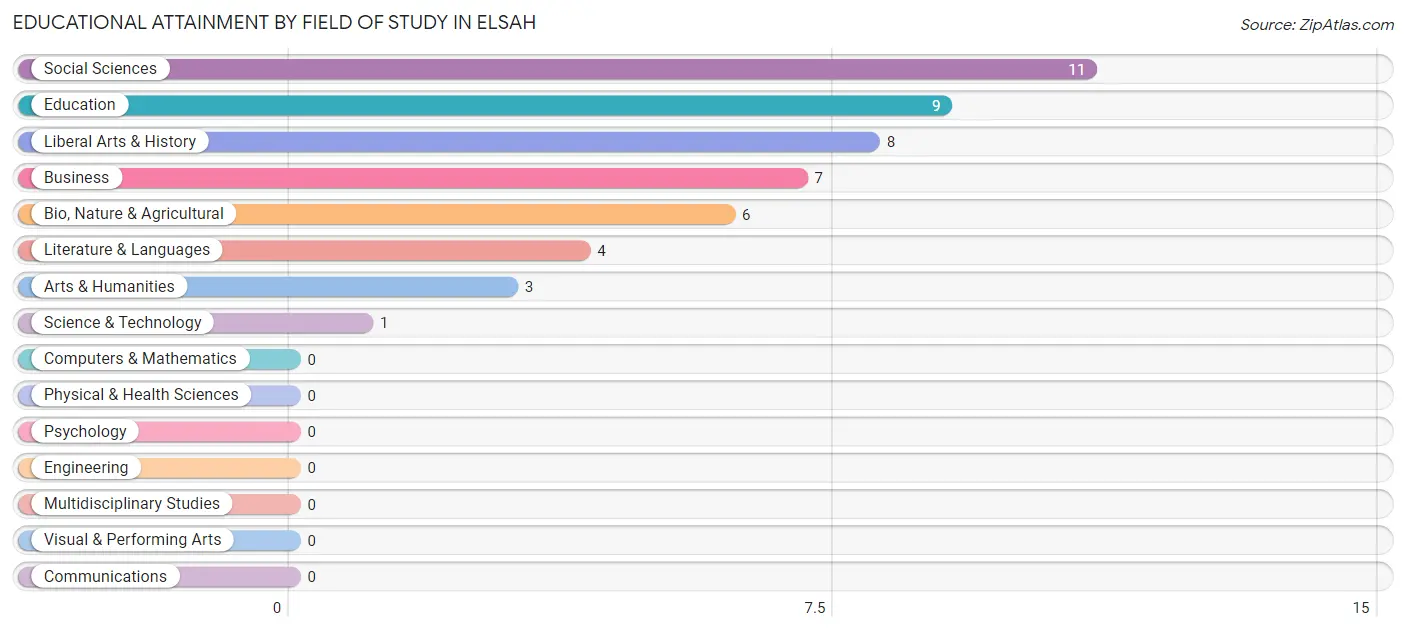
| Field of Study | # Graduates | % Graduates |
| Computers & Mathematics | 0 | 0.0% |
| Bio, Nature & Agricultural | 6 | 12.2% |
| Physical & Health Sciences | 0 | 0.0% |
| Psychology | 0 | 0.0% |
| Social Sciences | 11 | 22.5% |
| Engineering | 0 | 0.0% |
| Multidisciplinary Studies | 0 | 0.0% |
| Science & Technology | 1 | 2.0% |
| Business | 7 | 14.3% |
| Education | 9 | 18.4% |
| Literature & Languages | 4 | 8.2% |
| Liberal Arts & History | 8 | 16.3% |
| Visual & Performing Arts | 0 | 0.0% |
| Communications | 0 | 0.0% |
| Arts & Humanities | 3 | 6.1% |
| Total | 49 | 100.0% |
Transportation & Commute in Elsah
Vehicle Availability by Sex in Elsah
The most prevalent vehicle ownership categories in Elsah are males with 2 vehicles (12, accounting for 92.3%) and females with 2 vehicles (8, making up 48.0%).
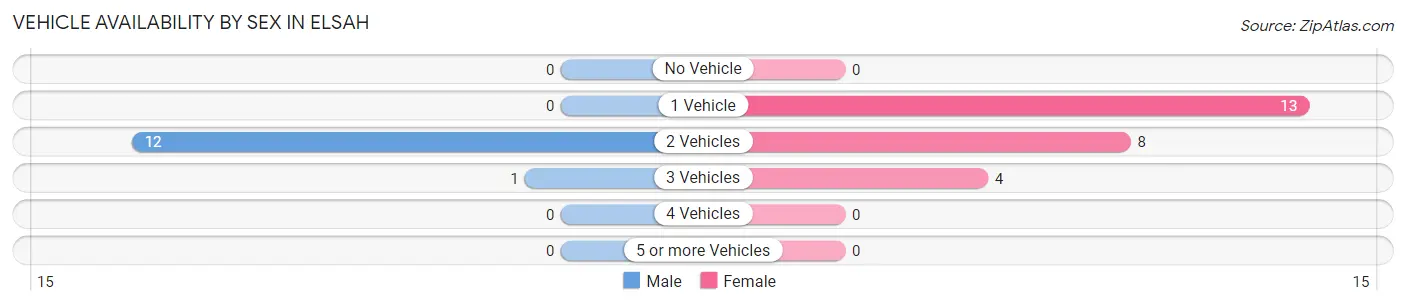
| Vehicles Available | Male | Female |
| No Vehicle | 0 (0.0%) | 0 (0.0%) |
| 1 Vehicle | 0 (0.0%) | 13 (52.0%) |
| 2 Vehicles | 12 (92.3%) | 8 (32.0%) |
| 3 Vehicles | 1 (7.7%) | 4 (16.0%) |
| 4 Vehicles | 0 (0.0%) | 0 (0.0%) |
| 5 or more Vehicles | 0 (0.0%) | 0 (0.0%) |
| Total | 13 (100.0%) | 25 (100.0%) |
Commute Time in Elsah
The most frequently occuring commute durations in Elsah are 5 to 9 minutes (87 commuters, 43.5%), 10 to 14 minutes (55 commuters, 27.5%), and less than 5 minutes (30 commuters, 15.0%).
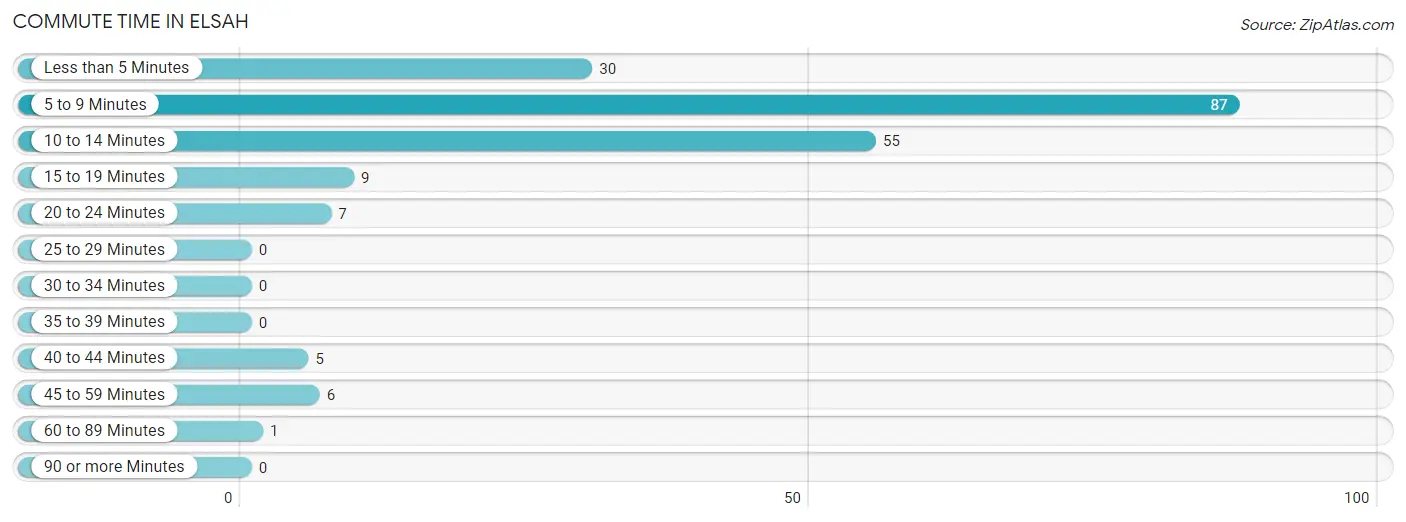
| Commute Time | # Commuters | % Commuters |
| Less than 5 Minutes | 30 | 15.0% |
| 5 to 9 Minutes | 87 | 43.5% |
| 10 to 14 Minutes | 55 | 27.5% |
| 15 to 19 Minutes | 9 | 4.5% |
| 20 to 24 Minutes | 7 | 3.5% |
| 25 to 29 Minutes | 0 | 0.0% |
| 30 to 34 Minutes | 0 | 0.0% |
| 35 to 39 Minutes | 0 | 0.0% |
| 40 to 44 Minutes | 5 | 2.5% |
| 45 to 59 Minutes | 6 | 3.0% |
| 60 to 89 Minutes | 1 | 0.5% |
| 90 or more Minutes | 0 | 0.0% |
Commute Time by Sex in Elsah
The most common commute times in Elsah are 5 to 9 minutes (48 commuters, 43.2%) for males and 5 to 9 minutes (39 commuters, 43.8%) for females.
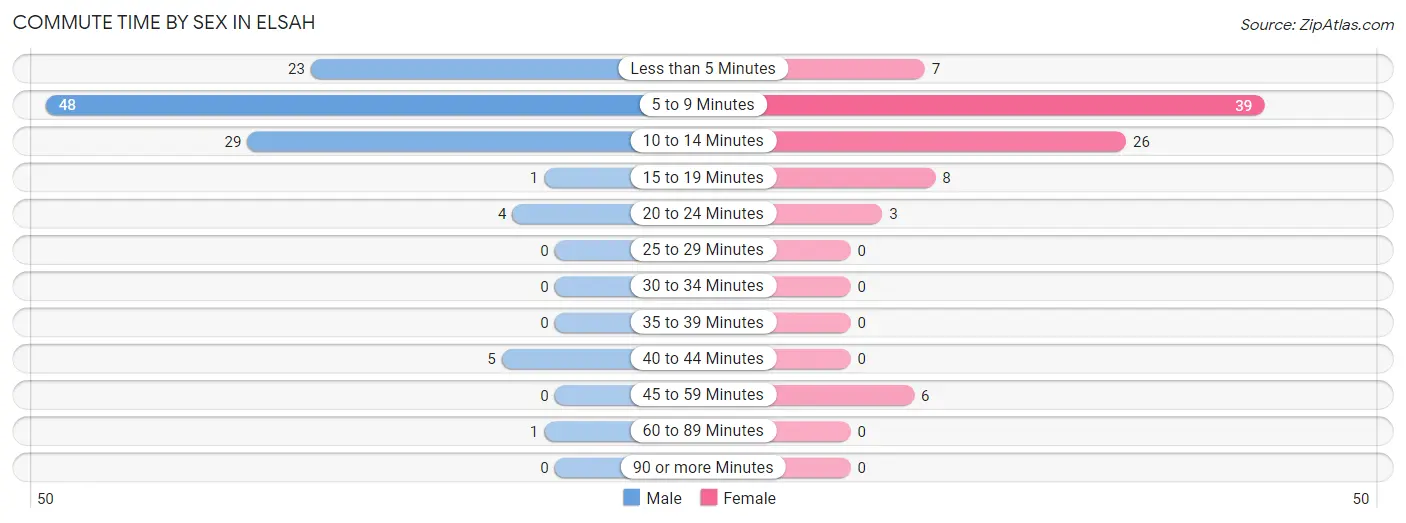
| Commute Time | Male | Female |
| Less than 5 Minutes | 23 (20.7%) | 7 (7.9%) |
| 5 to 9 Minutes | 48 (43.2%) | 39 (43.8%) |
| 10 to 14 Minutes | 29 (26.1%) | 26 (29.2%) |
| 15 to 19 Minutes | 1 (0.9%) | 8 (9.0%) |
| 20 to 24 Minutes | 4 (3.6%) | 3 (3.4%) |
| 25 to 29 Minutes | 0 (0.0%) | 0 (0.0%) |
| 30 to 34 Minutes | 0 (0.0%) | 0 (0.0%) |
| 35 to 39 Minutes | 0 (0.0%) | 0 (0.0%) |
| 40 to 44 Minutes | 5 (4.5%) | 0 (0.0%) |
| 45 to 59 Minutes | 0 (0.0%) | 6 (6.7%) |
| 60 to 89 Minutes | 1 (0.9%) | 0 (0.0%) |
| 90 or more Minutes | 0 (0.0%) | 0 (0.0%) |
Time of Departure to Work by Sex in Elsah
The most frequent times of departure to work in Elsah are 8:00 AM to 8:29 AM (53, 47.7%) for males and 7:00 AM to 7:29 AM (20, 22.5%) for females.
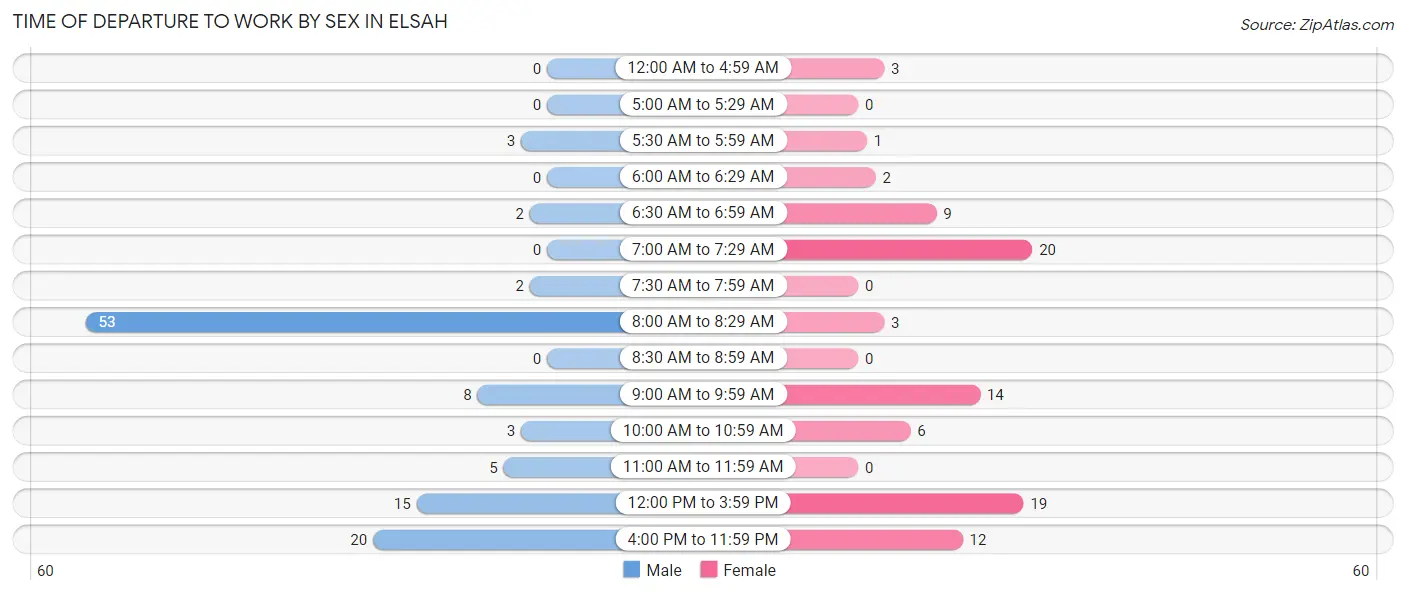
| Time of Departure | Male | Female |
| 12:00 AM to 4:59 AM | 0 (0.0%) | 3 (3.4%) |
| 5:00 AM to 5:29 AM | 0 (0.0%) | 0 (0.0%) |
| 5:30 AM to 5:59 AM | 3 (2.7%) | 1 (1.1%) |
| 6:00 AM to 6:29 AM | 0 (0.0%) | 2 (2.2%) |
| 6:30 AM to 6:59 AM | 2 (1.8%) | 9 (10.1%) |
| 7:00 AM to 7:29 AM | 0 (0.0%) | 20 (22.5%) |
| 7:30 AM to 7:59 AM | 2 (1.8%) | 0 (0.0%) |
| 8:00 AM to 8:29 AM | 53 (47.7%) | 3 (3.4%) |
| 8:30 AM to 8:59 AM | 0 (0.0%) | 0 (0.0%) |
| 9:00 AM to 9:59 AM | 8 (7.2%) | 14 (15.7%) |
| 10:00 AM to 10:59 AM | 3 (2.7%) | 6 (6.7%) |
| 11:00 AM to 11:59 AM | 5 (4.5%) | 0 (0.0%) |
| 12:00 PM to 3:59 PM | 15 (13.5%) | 19 (21.3%) |
| 4:00 PM to 11:59 PM | 20 (18.0%) | 12 (13.5%) |
| Total | 111 (100.0%) | 89 (100.0%) |
Housing Occupancy in Elsah
Occupancy by Ownership in Elsah
Of the total 39 dwellings in Elsah, owner-occupied units account for 28 (71.8%), while renter-occupied units make up 11 (28.2%).
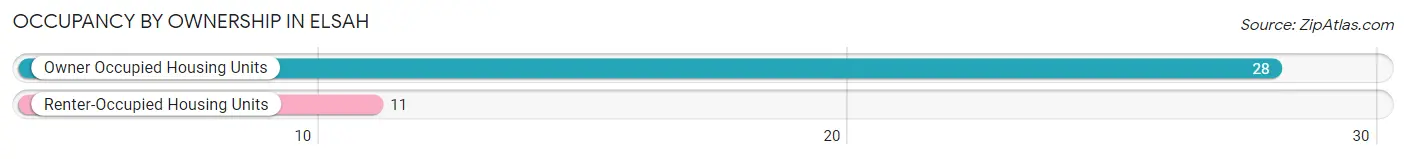
| Occupancy | # Housing Units | % Housing Units |
| Owner Occupied Housing Units | 28 | 71.8% |
| Renter-Occupied Housing Units | 11 | 28.2% |
| Total Occupied Housing Units | 39 | 100.0% |
Occupancy by Household Size in Elsah
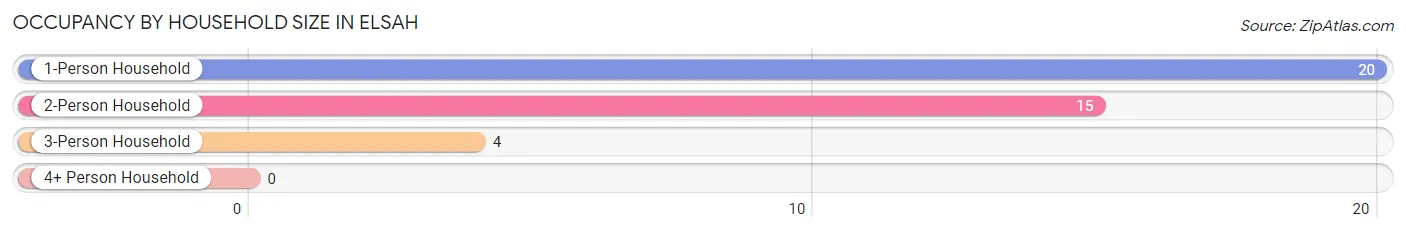
| Household Size | # Housing Units | % Housing Units |
| 1-Person Household | 20 | 51.3% |
| 2-Person Household | 15 | 38.5% |
| 3-Person Household | 4 | 10.3% |
| 4+ Person Household | 0 | 0.0% |
| Total Housing Units | 39 | 100.0% |
Occupancy by Ownership by Household Size in Elsah
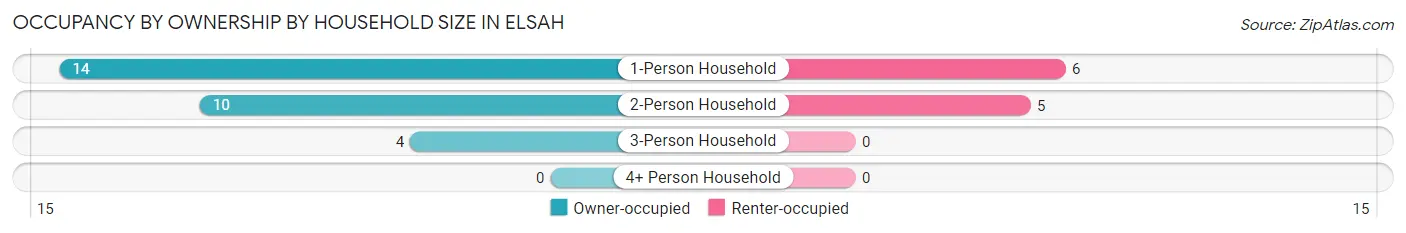
| Household Size | Owner-occupied | Renter-occupied |
| 1-Person Household | 14 (70.0%) | 6 (30.0%) |
| 2-Person Household | 10 (66.7%) | 5 (33.3%) |
| 3-Person Household | 4 (100.0%) | 0 (0.0%) |
| 4+ Person Household | 0 (0.0%) | 0 (0.0%) |
| Total Housing Units | 28 (71.8%) | 11 (28.2%) |
Occupancy by Educational Attainment in Elsah
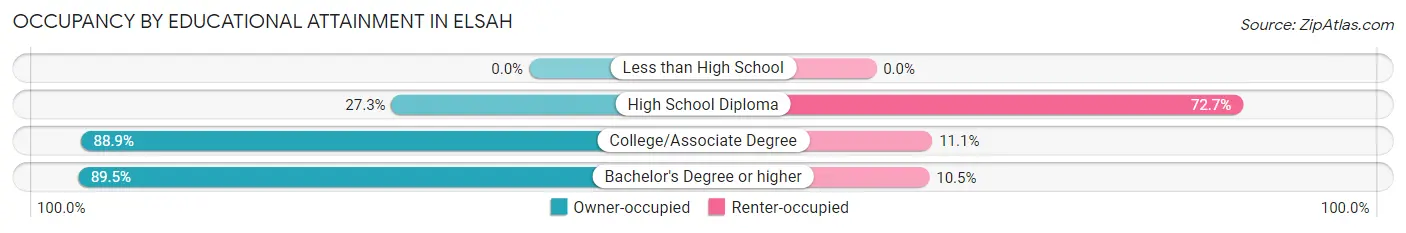
| Household Size | Owner-occupied | Renter-occupied |
| Less than High School | 0 (0.0%) | 0 (0.0%) |
| High School Diploma | 3 (27.3%) | 8 (72.7%) |
| College/Associate Degree | 8 (88.9%) | 1 (11.1%) |
| Bachelor's Degree or higher | 17 (89.5%) | 2 (10.5%) |
Occupancy by Age of Householder in Elsah
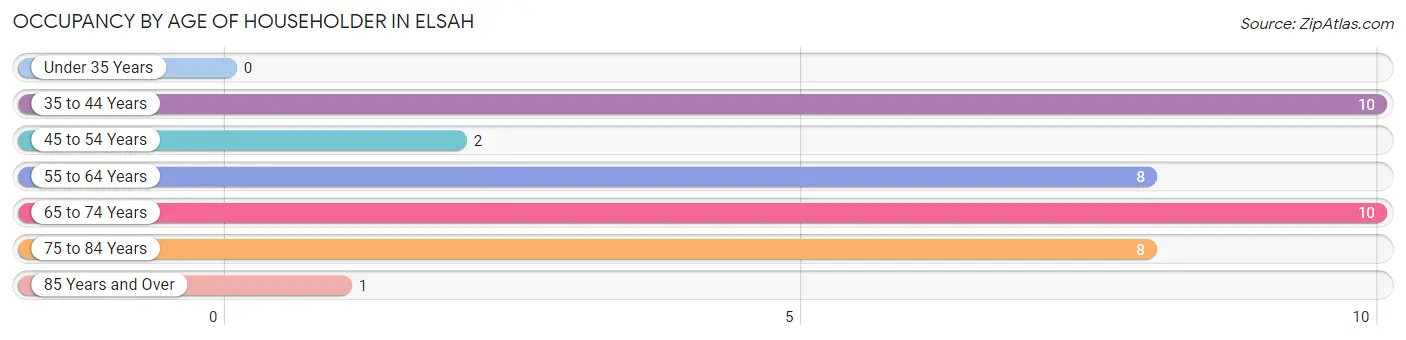
| Age Bracket | # Households | % Households |
| Under 35 Years | 0 | 0.0% |
| 35 to 44 Years | 10 | 25.6% |
| 45 to 54 Years | 2 | 5.1% |
| 55 to 64 Years | 8 | 20.5% |
| 65 to 74 Years | 10 | 25.6% |
| 75 to 84 Years | 8 | 20.5% |
| 85 Years and Over | 1 | 2.6% |
| Total | 39 | 100.0% |
Housing Finances in Elsah
Median Income by Occupancy in Elsah
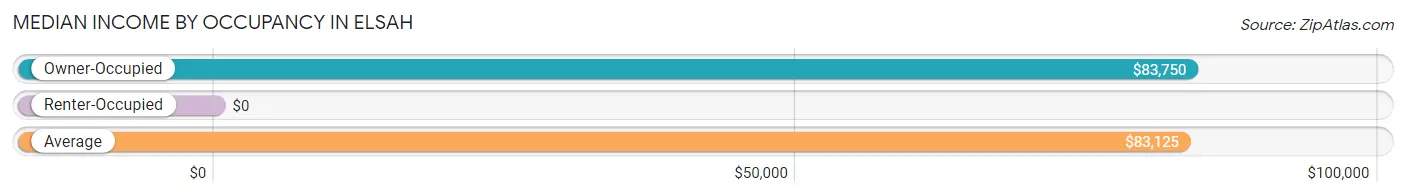
| Occupancy Type | # Households | Median Income |
| Owner-Occupied | 28 (71.8%) | $83,750 |
| Renter-Occupied | 11 (28.2%) | $0 |
| Average | 39 (100.0%) | $83,125 |
Occupancy by Householder Income Bracket in Elsah
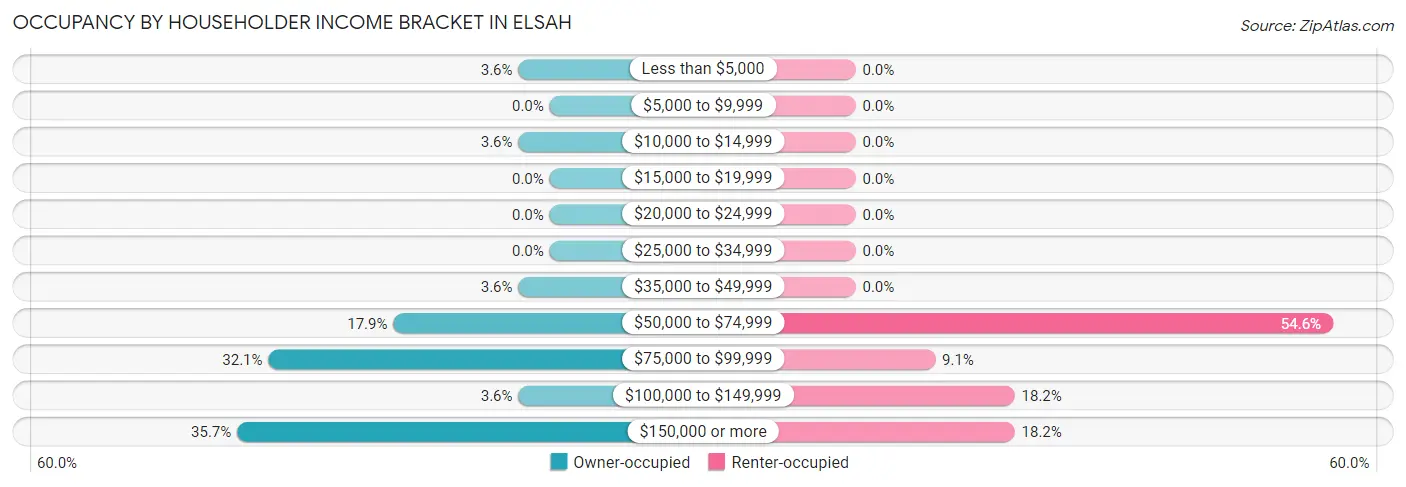
| Income Bracket | Owner-occupied | Renter-occupied |
| Less than $5,000 | 1 (3.6%) | 0 (0.0%) |
| $5,000 to $9,999 | 0 (0.0%) | 0 (0.0%) |
| $10,000 to $14,999 | 1 (3.6%) | 0 (0.0%) |
| $15,000 to $19,999 | 0 (0.0%) | 0 (0.0%) |
| $20,000 to $24,999 | 0 (0.0%) | 0 (0.0%) |
| $25,000 to $34,999 | 0 (0.0%) | 0 (0.0%) |
| $35,000 to $49,999 | 1 (3.6%) | 0 (0.0%) |
| $50,000 to $74,999 | 5 (17.9%) | 6 (54.5%) |
| $75,000 to $99,999 | 9 (32.1%) | 1 (9.1%) |
| $100,000 to $149,999 | 1 (3.6%) | 2 (18.2%) |
| $150,000 or more | 10 (35.7%) | 2 (18.2%) |
| Total | 28 (100.0%) | 11 (100.0%) |
Monthly Housing Cost Tiers in Elsah
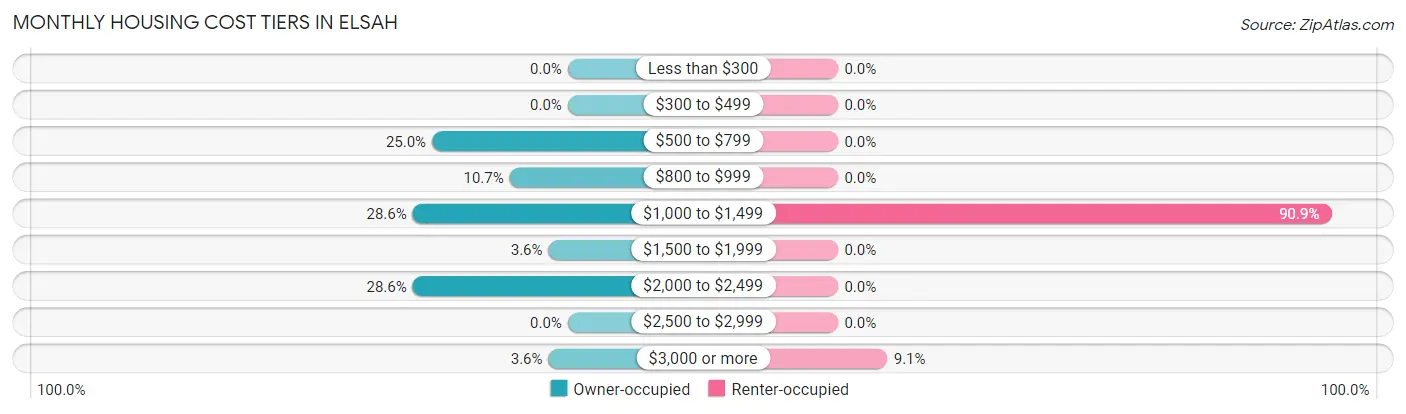
| Monthly Cost | Owner-occupied | Renter-occupied |
| Less than $300 | 0 (0.0%) | 0 (0.0%) |
| $300 to $499 | 0 (0.0%) | 0 (0.0%) |
| $500 to $799 | 7 (25.0%) | 0 (0.0%) |
| $800 to $999 | 3 (10.7%) | 0 (0.0%) |
| $1,000 to $1,499 | 8 (28.6%) | 10 (90.9%) |
| $1,500 to $1,999 | 1 (3.6%) | 0 (0.0%) |
| $2,000 to $2,499 | 8 (28.6%) | 0 (0.0%) |
| $2,500 to $2,999 | 0 (0.0%) | 0 (0.0%) |
| $3,000 or more | 1 (3.6%) | 1 (9.1%) |
| Total | 28 (100.0%) | 11 (100.0%) |
Physical Housing Characteristics in Elsah
Housing Structures in Elsah
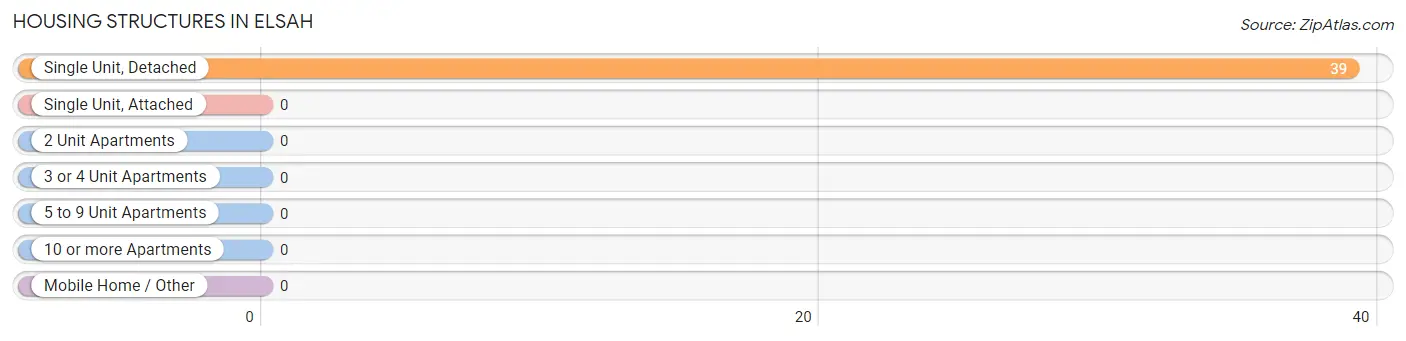
| Structure Type | # Housing Units | % Housing Units |
| Single Unit, Detached | 39 | 100.0% |
| Single Unit, Attached | 0 | 0.0% |
| 2 Unit Apartments | 0 | 0.0% |
| 3 or 4 Unit Apartments | 0 | 0.0% |
| 5 to 9 Unit Apartments | 0 | 0.0% |
| 10 or more Apartments | 0 | 0.0% |
| Mobile Home / Other | 0 | 0.0% |
| Total | 39 | 100.0% |
Housing Structures by Occupancy in Elsah
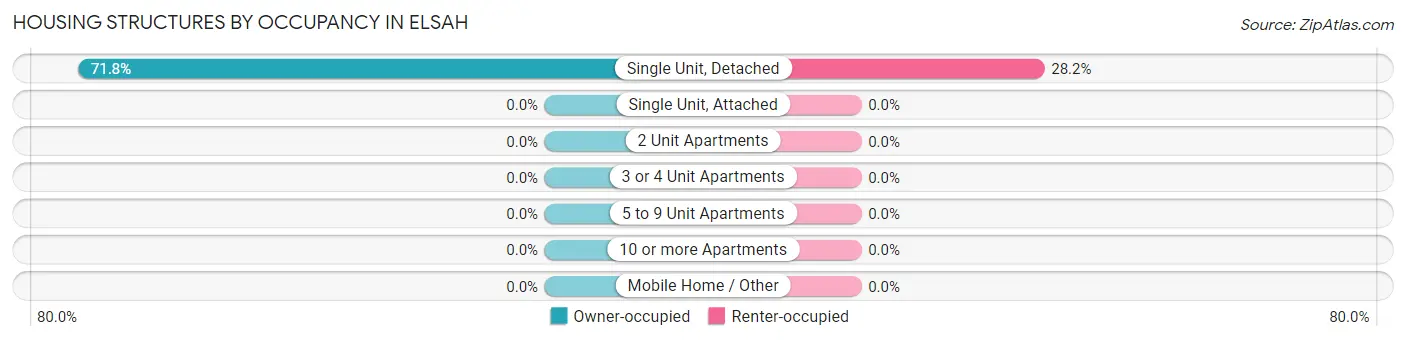
| Structure Type | Owner-occupied | Renter-occupied |
| Single Unit, Detached | 28 (71.8%) | 11 (28.2%) |
| Single Unit, Attached | 0 (0.0%) | 0 (0.0%) |
| 2 Unit Apartments | 0 (0.0%) | 0 (0.0%) |
| 3 or 4 Unit Apartments | 0 (0.0%) | 0 (0.0%) |
| 5 to 9 Unit Apartments | 0 (0.0%) | 0 (0.0%) |
| 10 or more Apartments | 0 (0.0%) | 0 (0.0%) |
| Mobile Home / Other | 0 (0.0%) | 0 (0.0%) |
| Total | 28 (71.8%) | 11 (28.2%) |
Housing Structures by Number of Rooms in Elsah
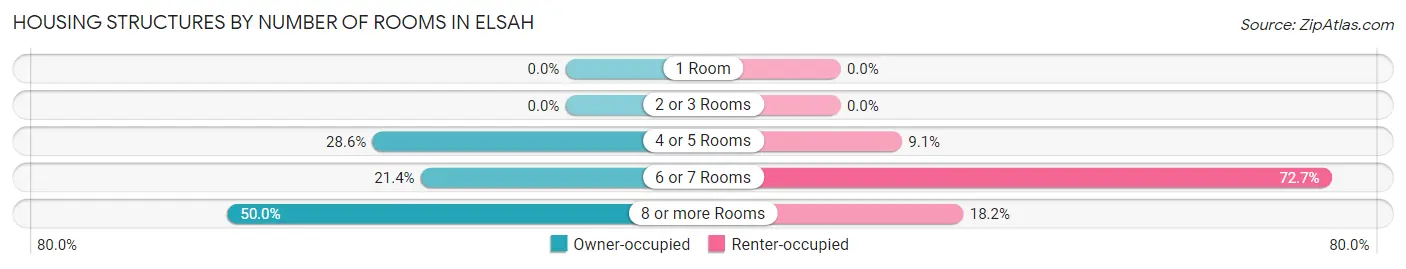
| Number of Rooms | Owner-occupied | Renter-occupied |
| 1 Room | 0 (0.0%) | 0 (0.0%) |
| 2 or 3 Rooms | 0 (0.0%) | 0 (0.0%) |
| 4 or 5 Rooms | 8 (28.6%) | 1 (9.1%) |
| 6 or 7 Rooms | 6 (21.4%) | 8 (72.7%) |
| 8 or more Rooms | 14 (50.0%) | 2 (18.2%) |
| Total | 28 (100.0%) | 11 (100.0%) |
Housing Structure by Heating Type in Elsah
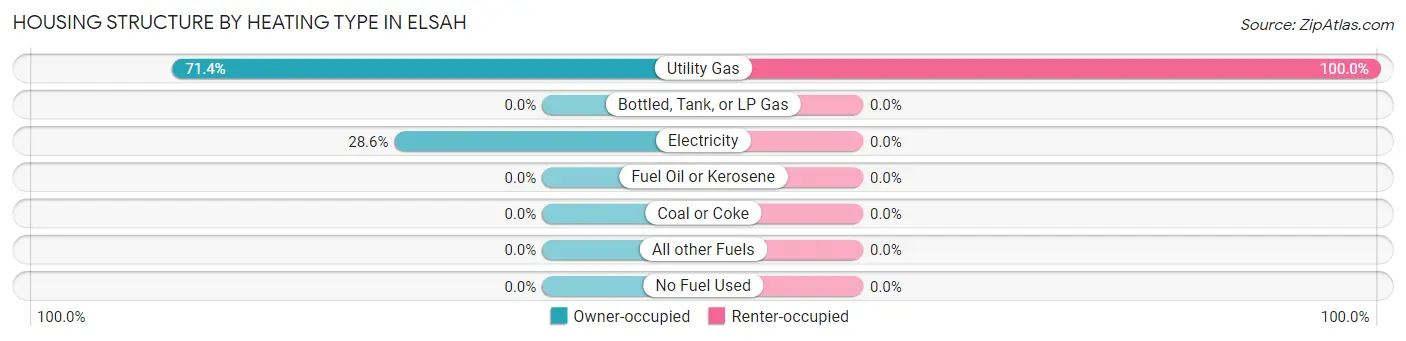
| Heating Type | Owner-occupied | Renter-occupied |
| Utility Gas | 20 (71.4%) | 11 (100.0%) |
| Bottled, Tank, or LP Gas | 0 (0.0%) | 0 (0.0%) |
| Electricity | 8 (28.6%) | 0 (0.0%) |
| Fuel Oil or Kerosene | 0 (0.0%) | 0 (0.0%) |
| Coal or Coke | 0 (0.0%) | 0 (0.0%) |
| All other Fuels | 0 (0.0%) | 0 (0.0%) |
| No Fuel Used | 0 (0.0%) | 0 (0.0%) |
| Total | 28 (100.0%) | 11 (100.0%) |
Household Vehicle Usage in Elsah
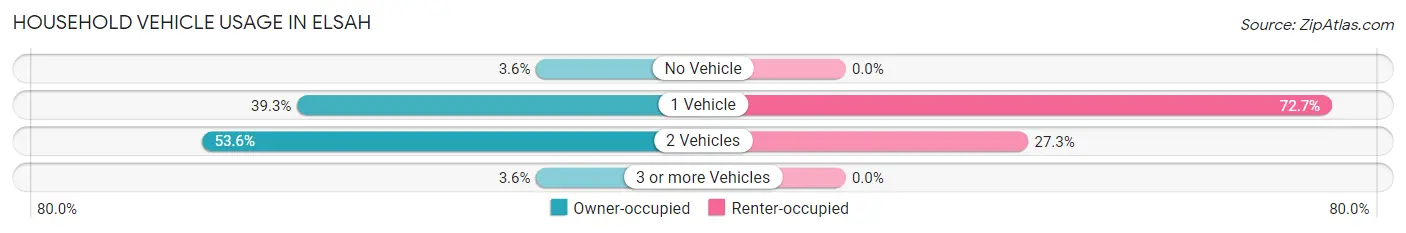
| Vehicles per Household | Owner-occupied | Renter-occupied |
| No Vehicle | 1 (3.6%) | 0 (0.0%) |
| 1 Vehicle | 11 (39.3%) | 8 (72.7%) |
| 2 Vehicles | 15 (53.6%) | 3 (27.3%) |
| 3 or more Vehicles | 1 (3.6%) | 0 (0.0%) |
| Total | 28 (100.0%) | 11 (100.0%) |
Real Estate & Mortgages in Elsah
Real Estate and Mortgage Overview in Elsah
| Characteristic | Without Mortgage | With Mortgage |
| Housing Units | 7 | 21 |
| Median Property Value | - | - |
| Median Household Income | $52,083 | $10 |
| Monthly Housing Costs | $588 | $1 |
| Real Estate Taxes | $3,500 | $2 |
Property Value by Mortgage Status in Elsah
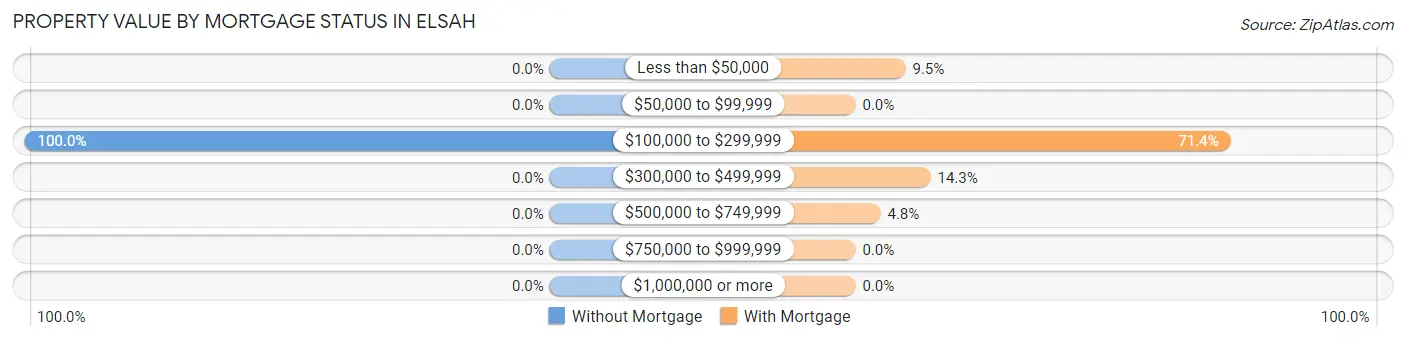
| Property Value | Without Mortgage | With Mortgage |
| Less than $50,000 | 0 (0.0%) | 2 (9.5%) |
| $50,000 to $99,999 | 0 (0.0%) | 0 (0.0%) |
| $100,000 to $299,999 | 7 (100.0%) | 15 (71.4%) |
| $300,000 to $499,999 | 0 (0.0%) | 3 (14.3%) |
| $500,000 to $749,999 | 0 (0.0%) | 1 (4.8%) |
| $750,000 to $999,999 | 0 (0.0%) | 0 (0.0%) |
| $1,000,000 or more | 0 (0.0%) | 0 (0.0%) |
| Total | 7 (100.0%) | 21 (100.0%) |
Household Income by Mortgage Status in Elsah
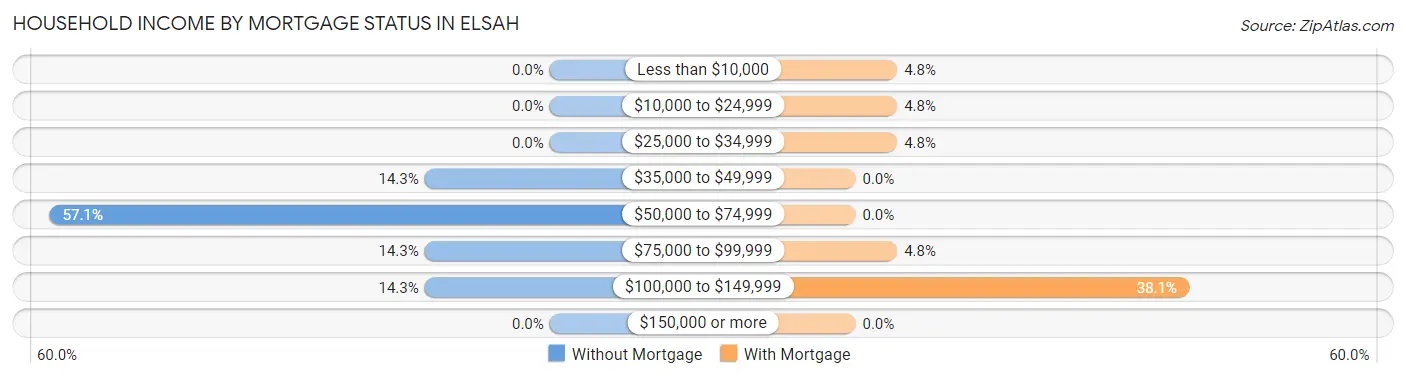
| Household Income | Without Mortgage | With Mortgage |
| Less than $10,000 | 0 (0.0%) | 1 (4.8%) |
| $10,000 to $24,999 | 0 (0.0%) | 1 (4.8%) |
| $25,000 to $34,999 | 0 (0.0%) | 1 (4.8%) |
| $35,000 to $49,999 | 1 (14.3%) | 0 (0.0%) |
| $50,000 to $74,999 | 4 (57.1%) | 0 (0.0%) |
| $75,000 to $99,999 | 1 (14.3%) | 1 (4.8%) |
| $100,000 to $149,999 | 1 (14.3%) | 8 (38.1%) |
| $150,000 or more | 0 (0.0%) | 0 (0.0%) |
| Total | 7 (100.0%) | 21 (100.0%) |
Property Value to Household Income Ratio in Elsah
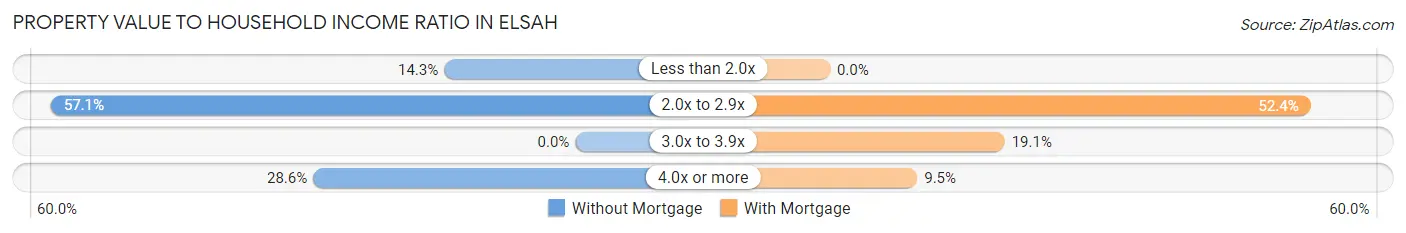
| Value-to-Income Ratio | Without Mortgage | With Mortgage |
| Less than 2.0x | 1 (14.3%) | 0 (0.0%) |
| 2.0x to 2.9x | 4 (57.1%) | 11 (52.4%) |
| 3.0x to 3.9x | 0 (0.0%) | 4 (19.1%) |
| 4.0x or more | 2 (28.6%) | 2 (9.5%) |
| Total | 7 (100.0%) | 21 (100.0%) |
Real Estate Taxes by Mortgage Status in Elsah
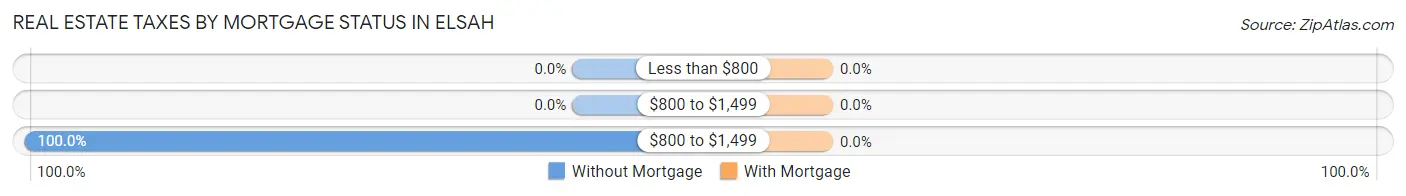
| Property Taxes | Without Mortgage | With Mortgage |
| Less than $800 | 0 (0.0%) | 0 (0.0%) |
| $800 to $1,499 | 0 (0.0%) | 0 (0.0%) |
| $800 to $1,499 | 7 (100.0%) | 0 (0.0%) |
| Total | 7 (100.0%) | 21 (100.0%) |
Health & Disability in Elsah
Health Insurance Coverage by Age in Elsah
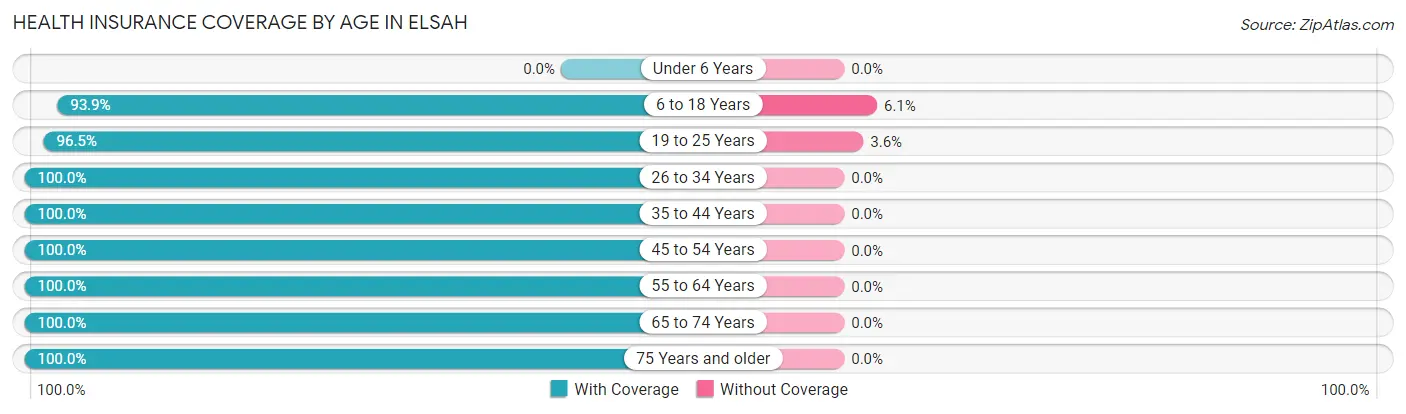
| Age Bracket | With Coverage | Without Coverage |
| Under 6 Years | 0 (0.0%) | 0 (0.0%) |
| 6 to 18 Years | 123 (93.9%) | 8 (6.1%) |
| 19 to 25 Years | 408 (96.5%) | 15 (3.5%) |
| 26 to 34 Years | 12 (100.0%) | 0 (0.0%) |
| 35 to 44 Years | 13 (100.0%) | 0 (0.0%) |
| 45 to 54 Years | 4 (100.0%) | 0 (0.0%) |
| 55 to 64 Years | 16 (100.0%) | 0 (0.0%) |
| 65 to 74 Years | 18 (100.0%) | 0 (0.0%) |
| 75 Years and older | 12 (100.0%) | 0 (0.0%) |
| Total | 606 (96.3%) | 23 (3.7%) |
Health Insurance Coverage by Citizenship Status in Elsah
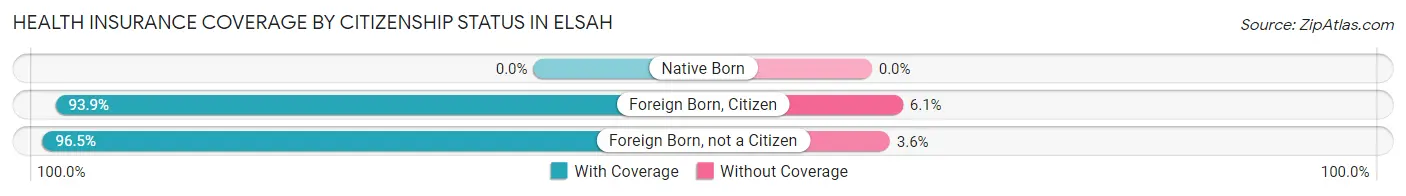
| Citizenship Status | With Coverage | Without Coverage |
| Native Born | 0 (0.0%) | 0 (0.0%) |
| Foreign Born, Citizen | 123 (93.9%) | 8 (6.1%) |
| Foreign Born, not a Citizen | 408 (96.5%) | 15 (3.5%) |
Health Insurance Coverage by Household Income in Elsah
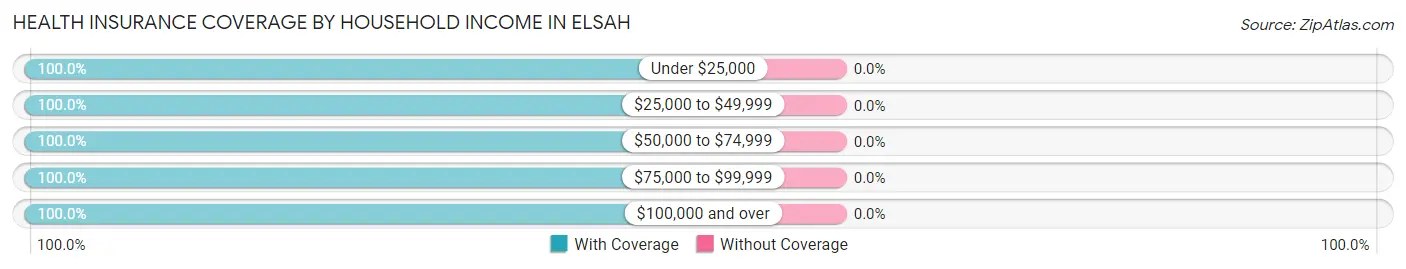
| Household Income | With Coverage | Without Coverage |
| Under $25,000 | 2 (100.0%) | 0 (0.0%) |
| $25,000 to $49,999 | 1 (100.0%) | 0 (0.0%) |
| $50,000 to $74,999 | 13 (100.0%) | 0 (0.0%) |
| $75,000 to $99,999 | 21 (100.0%) | 0 (0.0%) |
| $100,000 and over | 28 (100.0%) | 0 (0.0%) |
Public vs Private Health Insurance Coverage by Age in Elsah
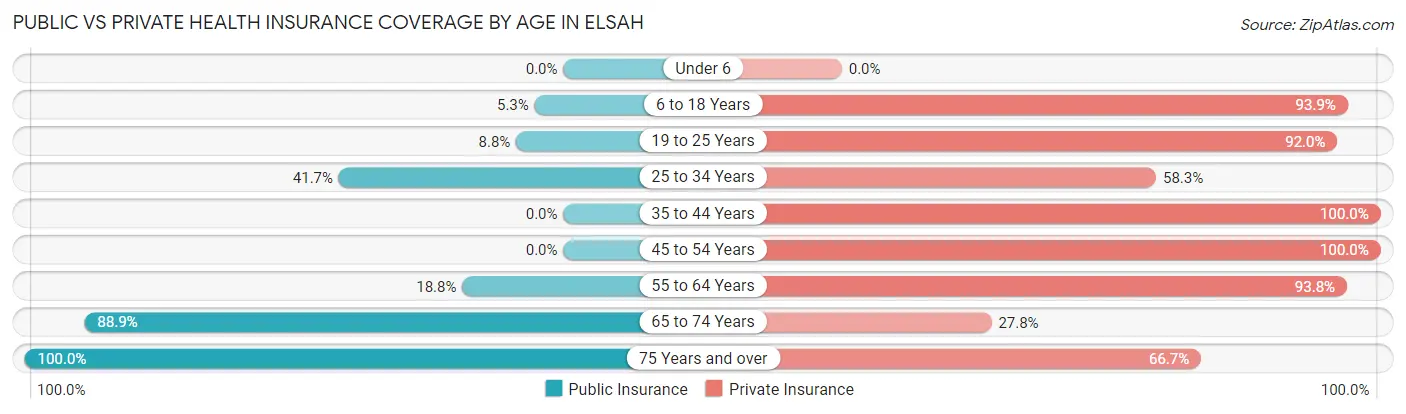
| Age Bracket | Public Insurance | Private Insurance |
| Under 6 | 0 (0.0%) | 0 (0.0%) |
| 6 to 18 Years | 7 (5.3%) | 123 (93.9%) |
| 19 to 25 Years | 37 (8.7%) | 389 (92.0%) |
| 25 to 34 Years | 5 (41.7%) | 7 (58.3%) |
| 35 to 44 Years | 0 (0.0%) | 13 (100.0%) |
| 45 to 54 Years | 0 (0.0%) | 4 (100.0%) |
| 55 to 64 Years | 3 (18.8%) | 15 (93.8%) |
| 65 to 74 Years | 16 (88.9%) | 5 (27.8%) |
| 75 Years and over | 12 (100.0%) | 8 (66.7%) |
| Total | 80 (12.7%) | 564 (89.7%) |
Disability Status by Sex by Age in Elsah
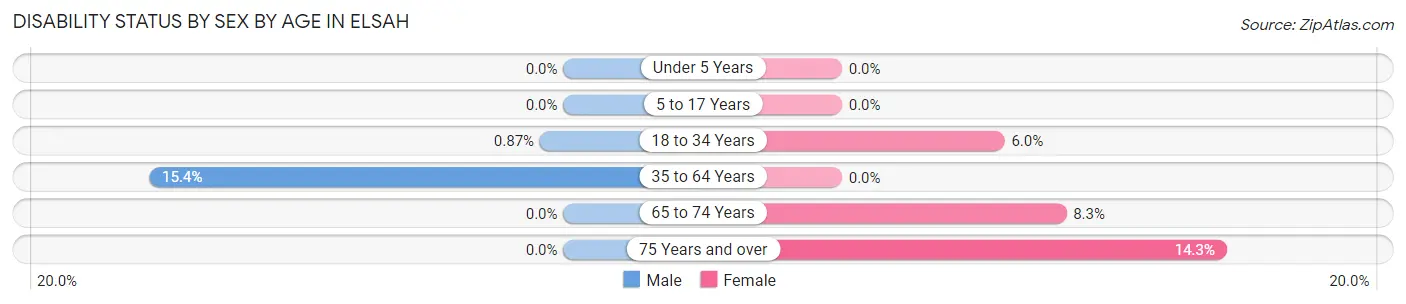
| Age Bracket | Male | Female |
| Under 5 Years | 0 (0.0%) | 0 (0.0%) |
| 5 to 17 Years | 0 (0.0%) | 0 (0.0%) |
| 18 to 34 Years | 2 (0.9%) | 20 (6.0%) |
| 35 to 64 Years | 2 (15.4%) | 0 (0.0%) |
| 65 to 74 Years | 0 (0.0%) | 1 (8.3%) |
| 75 Years and over | 0 (0.0%) | 1 (14.3%) |
Disability Class by Sex by Age in Elsah
Disability Class: Hearing Difficulty
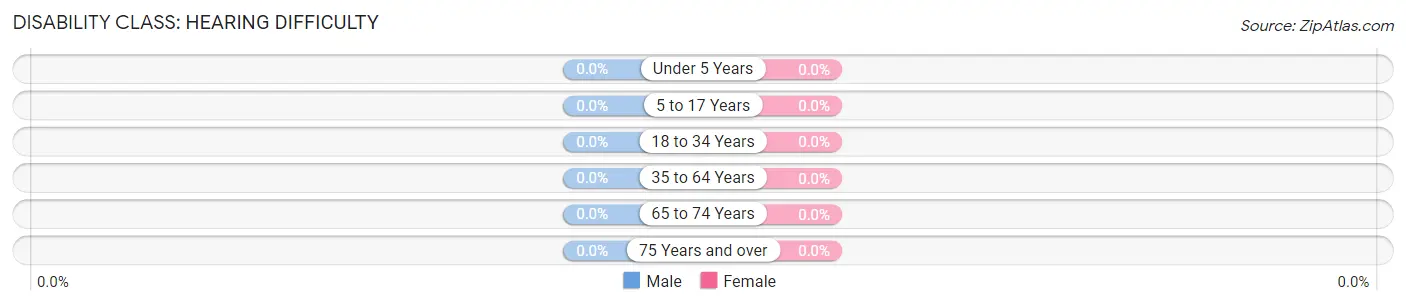
| Age Bracket | Male | Female |
| Under 5 Years | 0 (0.0%) | 0 (0.0%) |
| 5 to 17 Years | 0 (0.0%) | 0 (0.0%) |
| 18 to 34 Years | 0 (0.0%) | 0 (0.0%) |
| 35 to 64 Years | 0 (0.0%) | 0 (0.0%) |
| 65 to 74 Years | 0 (0.0%) | 0 (0.0%) |
| 75 Years and over | 0 (0.0%) | 0 (0.0%) |
Disability Class: Vision Difficulty
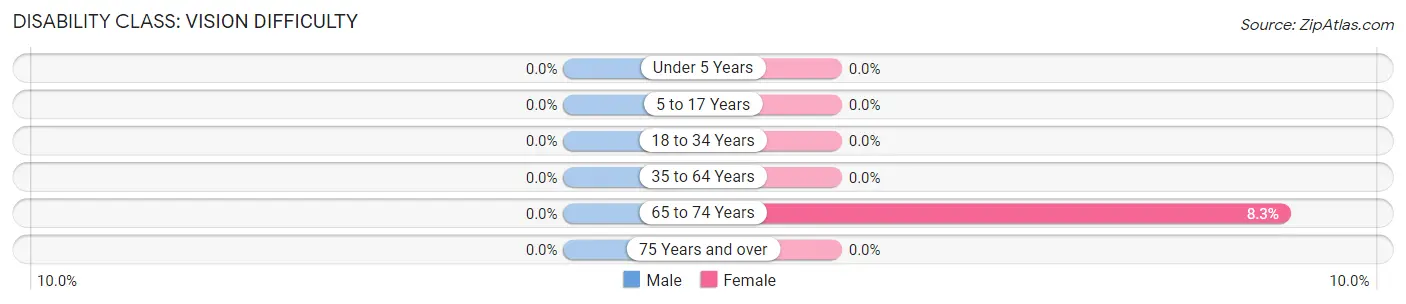
| Age Bracket | Male | Female |
| Under 5 Years | 0 (0.0%) | 0 (0.0%) |
| 5 to 17 Years | 0 (0.0%) | 0 (0.0%) |
| 18 to 34 Years | 0 (0.0%) | 0 (0.0%) |
| 35 to 64 Years | 0 (0.0%) | 0 (0.0%) |
| 65 to 74 Years | 0 (0.0%) | 1 (8.3%) |
| 75 Years and over | 0 (0.0%) | 0 (0.0%) |
Disability Class: Cognitive Difficulty
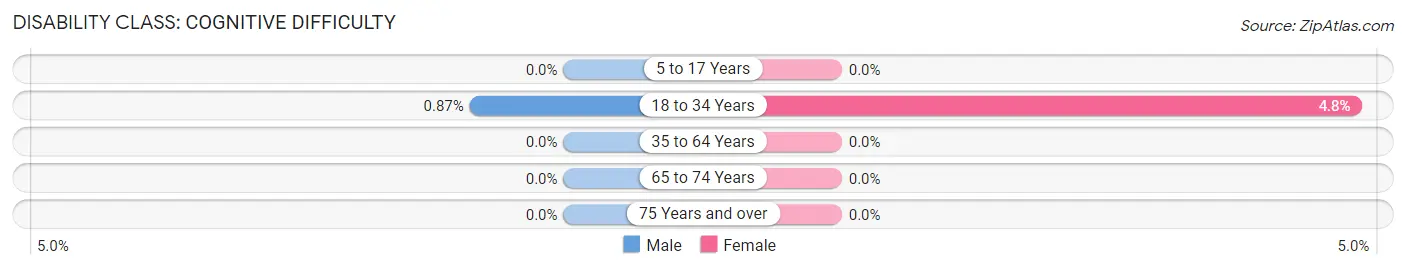
| Age Bracket | Male | Female |
| 5 to 17 Years | 0 (0.0%) | 0 (0.0%) |
| 18 to 34 Years | 2 (0.9%) | 16 (4.8%) |
| 35 to 64 Years | 0 (0.0%) | 0 (0.0%) |
| 65 to 74 Years | 0 (0.0%) | 0 (0.0%) |
| 75 Years and over | 0 (0.0%) | 0 (0.0%) |
Disability Class: Ambulatory Difficulty
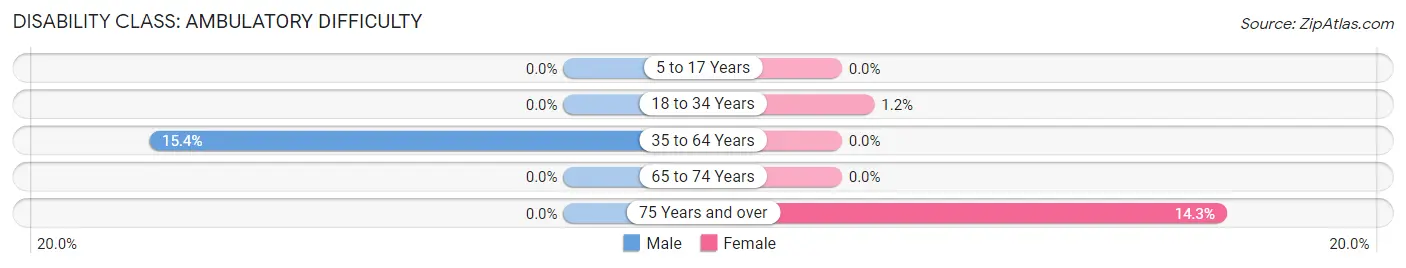
| Age Bracket | Male | Female |
| 5 to 17 Years | 0 (0.0%) | 0 (0.0%) |
| 18 to 34 Years | 0 (0.0%) | 4 (1.2%) |
| 35 to 64 Years | 2 (15.4%) | 0 (0.0%) |
| 65 to 74 Years | 0 (0.0%) | 0 (0.0%) |
| 75 Years and over | 0 (0.0%) | 1 (14.3%) |
Disability Class: Self-Care Difficulty
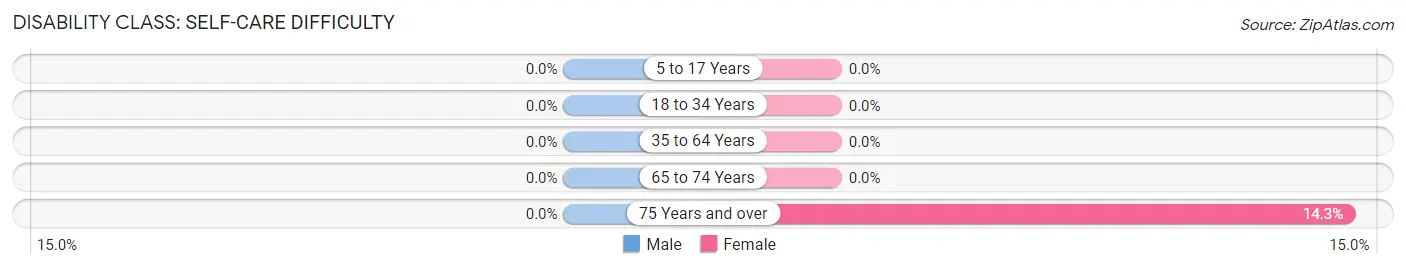
| Age Bracket | Male | Female |
| 5 to 17 Years | 0 (0.0%) | 0 (0.0%) |
| 18 to 34 Years | 0 (0.0%) | 0 (0.0%) |
| 35 to 64 Years | 0 (0.0%) | 0 (0.0%) |
| 65 to 74 Years | 0 (0.0%) | 0 (0.0%) |
| 75 Years and over | 0 (0.0%) | 1 (14.3%) |
Technology Access in Elsah
Computing Device Access in Elsah
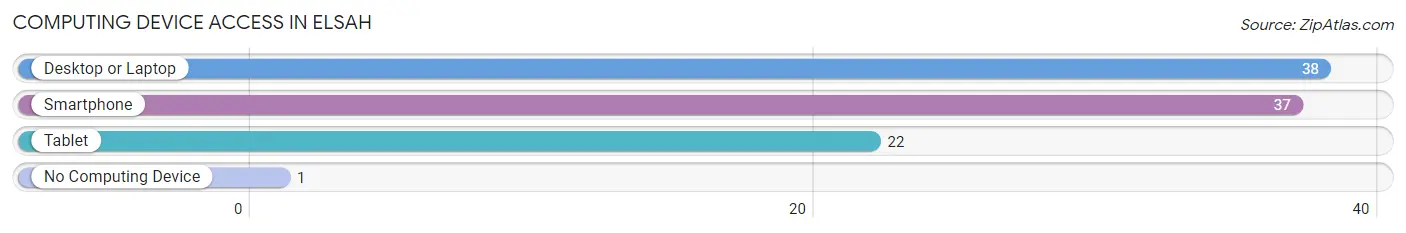
| Device Type | # Households | % Households |
| Desktop or Laptop | 38 | 97.4% |
| Smartphone | 37 | 94.9% |
| Tablet | 22 | 56.4% |
| No Computing Device | 1 | 2.6% |
| Total | 39 | 100.0% |
Internet Access in Elsah
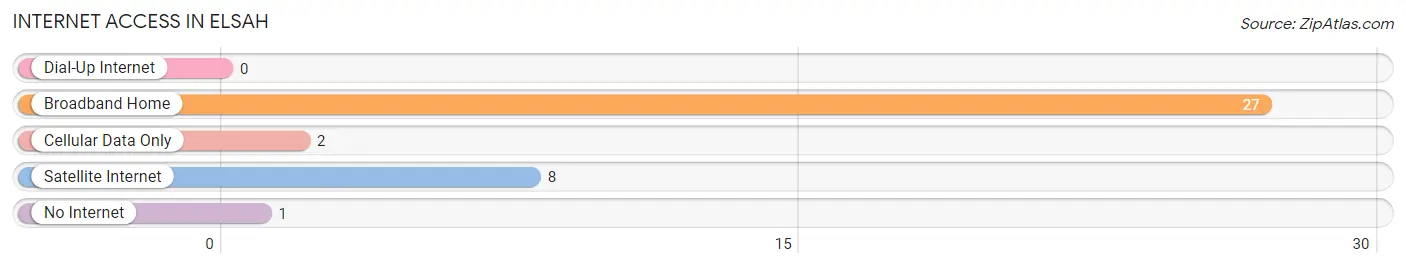
| Internet Type | # Households | % Households |
| Dial-Up Internet | 0 | 0.0% |
| Broadband Home | 27 | 69.2% |
| Cellular Data Only | 2 | 5.1% |
| Satellite Internet | 8 | 20.5% |
| No Internet | 1 | 2.6% |
| Total | 39 | 100.0% |
Elsah Summary
History
Elsah is a small village located in Jersey County, Illinois, United States. It is situated on the banks of the Mississippi River, just north of Alton. The village was founded in 1853 by a group of settlers from Pennsylvania, led by John H. Elsah. The village was named after him, and it has remained a small, rural community ever since.
The village was originally a farming community, and it was home to a number of small businesses, including a grist mill, a saw mill, a blacksmith shop, and a general store. The village also had a post office, which was established in 1854.
In the late 19th century, Elsah became a popular tourist destination, due to its picturesque location on the Mississippi River. The village was home to a number of inns and hotels, and it was a popular spot for fishing and boating.
In the early 20th century, Elsah experienced a period of growth and development. The village was home to a number of factories, including a brickyard, a canning factory, and a furniture factory. The village also had a number of stores, including a grocery store, a hardware store, and a drug store.
In the 1950s, Elsah experienced a period of decline, as many of the factories and businesses closed. The village was also affected by the construction of the Alton Dam, which flooded much of the surrounding area.
Geography
Elsah is located in Jersey County, Illinois, on the banks of the Mississippi River. The village is situated just north of Alton, and it is approximately 25 miles north of St. Louis. The village is located in a rural area, and it is surrounded by rolling hills and farmland.
The village is located at an elevation of 590 feet above sea level. The climate in Elsah is humid continental, with hot, humid summers and cold, snowy winters.
Economy
The economy of Elsah is largely based on agriculture and tourism. The village is home to a number of small businesses, including a general store, a hardware store, and a drug store. The village also has a number of restaurants and inns, which cater to tourists.
The village is also home to a number of small manufacturing businesses, including a furniture factory and a canning factory. The village is also home to a number of farms, which produce a variety of crops, including corn, soybeans, and wheat.
Demographics
According to the 2010 census, the population of Elsah was 545. The village is predominantly white, with 95.3% of the population being white. The median household income in Elsah is $45,000, and the median age is 44.
The village is home to a number of churches, including the Elsah United Methodist Church, the Elsah Baptist Church, and the Elsah Presbyterian Church. The village also has a public library, which is part of the Jersey County Library System.
Common Questions
What is Per Capita Income in Elsah?
Per Capita income in Elsah is $8,878.
What is the Median Family Income in Elsah?
Median Family Income in Elsah is $120,000.
What is the Median Household income in Elsah?
Median Household Income in Elsah is $83,125.
What is Income or Wage Gap in Elsah?
Income or Wage Gap in Elsah is 54.0%.
Women in Elsah earn 46.0 cents for every dollar earned by a man.
What is Inequality or Gini Index in Elsah?
Inequality or Gini Index in Elsah is 0.29.
What is the Total Population of Elsah?
Total Population of Elsah is 629.
What is the Total Male Population of Elsah?
Total Male Population of Elsah is 259.
What is the Total Female Population of Elsah?
Total Female Population of Elsah is 370.
What is the Ratio of Males per 100 Females in Elsah?
There are 70.00 Males per 100 Females in Elsah.
What is the Ratio of Females per 100 Males in Elsah?
There are 142.86 Females per 100 Males in Elsah.
What is the Median Population Age in Elsah?
Median Population Age in Elsah is 20.4 Years.
What is the Average Family Size in Elsah
Average Family Size in Elsah is 2.4 People.
What is the Average Household Size in Elsah
Average Household Size in Elsah is 1.7 People.
How Large is the Labor Force in Elsah?
There are 283 People in the Labor Forcein in Elsah.
What is the Percentage of People in the Labor Force in Elsah?
45.4% of People are in the Labor Force in Elsah.
What is the Unemployment Rate in Elsah?
Unemployment Rate in Elsah is 4.6%.