Cities with the Most Births per 1,000 Women Over the Age of 35 in Illinois
RELATED REPORTS & OPTIONS
Highest Birth Rate | Women 35+
Illinois
Compare Cities
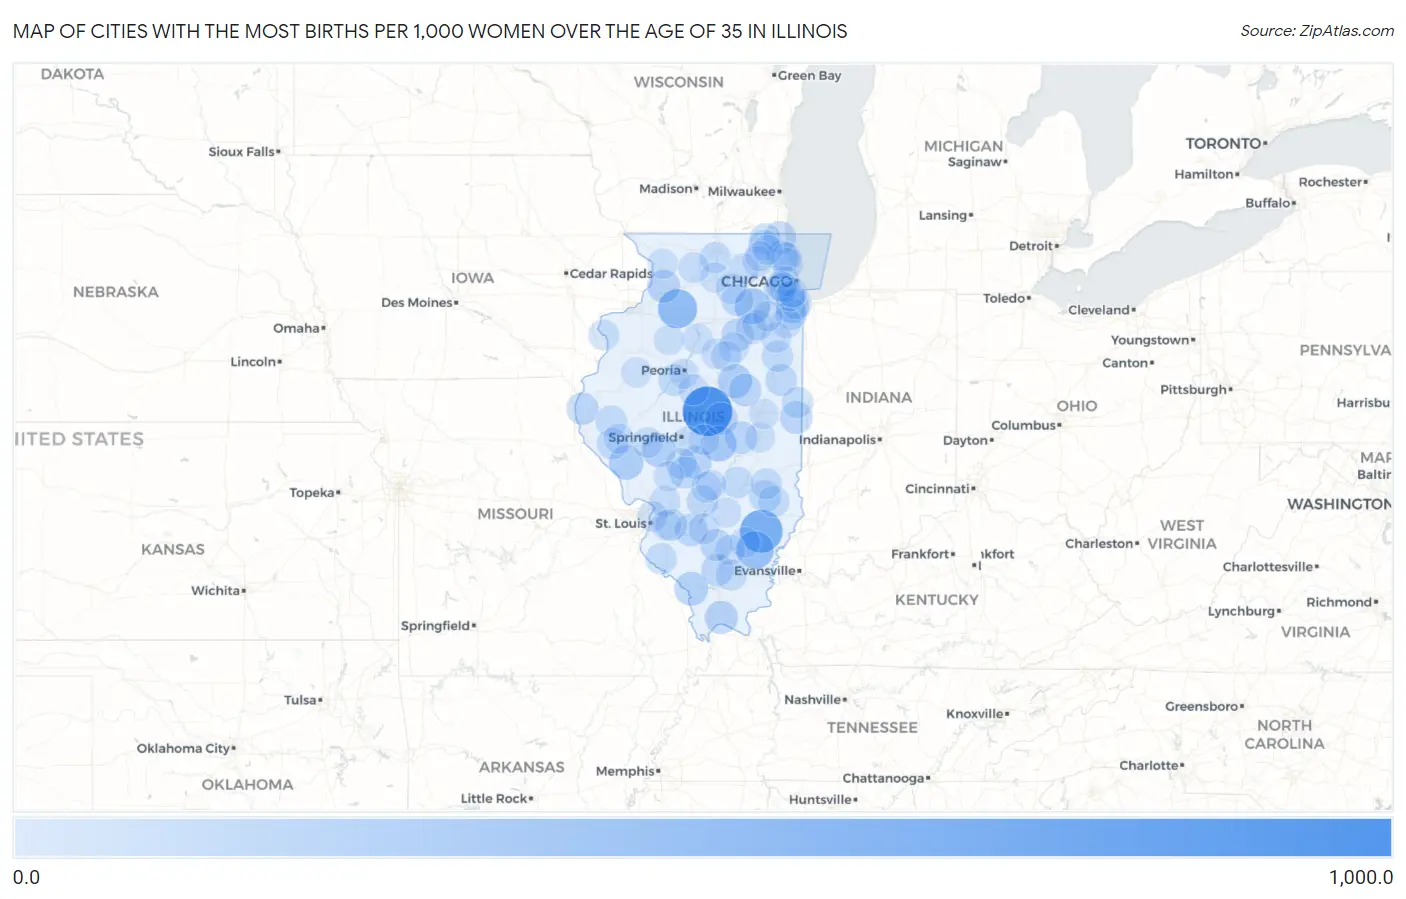
Map of Cities with the Most Births per 1,000 Women Over the Age of 35 in Illinois
0.0
1,000.0
Cities with the Most Births per 1,000 Women Over the Age of 35 in Illinois
| City | Births / 1,000 Women | vs State | vs National | |
| 1. | Beason | 1,000.0 | 34.0(+966)#1 | 32.0(+968)#24 |
| 2. | Solon Mills | 750.0 | 34.0(+716)#2 | 32.0(+718)#71 |
| 3. | Mount Erie | 667.0 | 34.0(+633)#3 | 32.0(+635)#78 |
| 4. | Kings | 663.0 | 34.0(+629)#4 | 32.0(+631)#82 |
| 5. | Lake Carroll | 514.0 | 34.0(+480)#5 | 32.0(+482)#120 |
| 6. | New Bedford | 500.0 | 34.0(+466)#6 | 32.0(+468)#148 |
| 7. | Mill Shoals | 429.0 | 34.0(+395)#7 | 32.0(+397)#193 |
| 8. | Plattville | 333.0 | 34.0(+299)#8 | 32.0(+301)#289 |
| 9. | Macon | 328.0 | 34.0(+294)#9 | 32.0(+296)#310 |
| 10. | Pearl | 273.0 | 34.0(+239)#10 | 32.0(+241)#407 |
| 11. | Cooksville | 267.0 | 34.0(+233)#11 | 32.0(+235)#419 |
| 12. | Gorham | 259.0 | 34.0(+225)#12 | 32.0(+227)#444 |
| 13. | Franklin | 256.0 | 34.0(+222)#13 | 32.0(+224)#450 |
| 14. | Flossmoor | 231.0 | 34.0(+197)#14 | 32.0(+199)#540 |
| 15. | Belknap | 222.0 | 34.0(+188)#15 | 32.0(+190)#586 |
| 16. | Palmer | 211.0 | 34.0(+177)#16 | 32.0(+179)#641 |
| 17. | Morrison | 209.0 | 34.0(+175)#17 | 32.0(+177)#648 |
| 18. | Maroa | 201.0 | 34.0(+167)#18 | 32.0(+169)#688 |
| 19. | Hammond | 200.0 | 34.0(+166)#19 | 32.0(+168)#695 |
| 20. | Belgium | 200.0 | 34.0(+166)#20 | 32.0(+168)#706 |
| 21. | Bartelso | 198.0 | 34.0(+164)#21 | 32.0(+166)#728 |
| 22. | Wadsworth | 194.0 | 34.0(+160)#22 | 32.0(+162)#742 |
| 23. | Saybrook | 194.0 | 34.0(+160)#23 | 32.0(+162)#743 |
| 24. | Buckner | 188.0 | 34.0(+154)#24 | 32.0(+156)#778 |
| 25. | Ransom | 176.0 | 34.0(+142)#25 | 32.0(+144)#849 |
| 26. | Lima | 176.0 | 34.0(+142)#26 | 32.0(+144)#850 |
| 27. | Woodlawn | 175.0 | 34.0(+141)#27 | 32.0(+143)#862 |
| 28. | Lake Holiday | 169.0 | 34.0(+135)#28 | 32.0(+137)#890 |
| 29. | Raymond | 169.0 | 34.0(+135)#29 | 32.0(+137)#892 |
| 30. | Lebanon | 168.0 | 34.0(+134)#30 | 32.0(+136)#897 |
| 31. | Burr Ridge | 167.0 | 34.0(+133)#31 | 32.0(+135)#900 |
| 32. | Cissna Park | 162.0 | 34.0(+128)#32 | 32.0(+130)#952 |
| 33. | Newton | 160.0 | 34.0(+126)#33 | 32.0(+128)#971 |
| 34. | Willow Lake | 159.0 | 34.0(+125)#34 | 32.0(+127)#985 |
| 35. | Mulberry Grove | 157.0 | 34.0(+123)#35 | 32.0(+125)#1,002 |
| 36. | Shumway | 154.0 | 34.0(+120)#36 | 32.0(+122)#1,031 |
| 37. | University Park | 151.0 | 34.0(+117)#37 | 32.0(+119)#1,049 |
| 38. | Kingston Mines | 150.0 | 34.0(+116)#38 | 32.0(+118)#1,068 |
| 39. | Mound Station | 150.0 | 34.0(+116)#39 | 32.0(+118)#1,069 |
| 40. | Ashkum | 143.0 | 34.0(+109)#40 | 32.0(+111)#1,145 |
| 41. | New Salem | 143.0 | 34.0(+109)#41 | 32.0(+111)#1,161 |
| 42. | Bannockburn | 140.0 | 34.0(+106)#42 | 32.0(+108)#1,188 |
| 43. | Bismarck | 138.0 | 34.0(+104)#43 | 32.0(+106)#1,217 |
| 44. | Ruma | 135.0 | 34.0(+101)#44 | 32.0(+103)#1,254 |
| 45. | Ste Marie | 133.0 | 34.0(+99.0)#45 | 32.0(+101)#1,297 |
| 46. | Fox Lake | 132.0 | 34.0(+98.0)#46 | 32.0(+100.0)#1,303 |
| 47. | Northfield | 132.0 | 34.0(+98.0)#47 | 32.0(+100.0)#1,306 |
| 48. | New Milford | 128.0 | 34.0(+94.0)#48 | 32.0(+96.0)#1,369 |
| 49. | Thornton | 125.0 | 34.0(+91.0)#49 | 32.0(+93.0)#1,401 |
| 50. | Hidalgo | 125.0 | 34.0(+91.0)#50 | 32.0(+93.0)#1,433 |
| 51. | Thompsonville | 123.0 | 34.0(+89.0)#51 | 32.0(+91.0)#1,460 |
| 52. | Mount Auburn | 120.0 | 34.0(+86.0)#52 | 32.0(+88.0)#1,504 |
| 53. | New Boston | 119.0 | 34.0(+85.0)#53 | 32.0(+87.0)#1,517 |
| 54. | Hoffman | 118.0 | 34.0(+84.0)#54 | 32.0(+86.0)#1,530 |
| 55. | Bingham | 118.0 | 34.0(+84.0)#55 | 32.0(+86.0)#1,542 |
| 56. | Waterman | 117.0 | 34.0(+83.0)#56 | 32.0(+85.0)#1,556 |
| 57. | Mazon | 117.0 | 34.0(+83.0)#57 | 32.0(+85.0)#1,558 |
| 58. | Jacksonville | 116.0 | 34.0(+82.0)#58 | 32.0(+84.0)#1,563 |
| 59. | Holiday Shores | 115.0 | 34.0(+81.0)#59 | 32.0(+83.0)#1,586 |
| 60. | Madison | 115.0 | 34.0(+81.0)#60 | 32.0(+83.0)#1,587 |
| 61. | Hopedale | 114.0 | 34.0(+80.0)#61 | 32.0(+82.0)#1,613 |
| 62. | Peotone | 113.0 | 34.0(+79.0)#62 | 32.0(+81.0)#1,624 |
| 63. | Farmersville | 113.0 | 34.0(+79.0)#63 | 32.0(+81.0)#1,639 |
| 64. | Mount Morris | 112.0 | 34.0(+78.0)#64 | 32.0(+80.0)#1,652 |
| 65. | Lakemoor | 111.0 | 34.0(+77.0)#65 | 32.0(+79.0)#1,665 |
| 66. | Carbon Hill | 111.0 | 34.0(+77.0)#66 | 32.0(+79.0)#1,681 |
| 67. | Burlington | 111.0 | 34.0(+77.0)#67 | 32.0(+79.0)#1,683 |
| 68. | Arbury Hills | 110.0 | 34.0(+76.0)#68 | 32.0(+78.0)#1,724 |
| 69. | Cahokia Heights | 109.0 | 34.0(+75.0)#69 | 32.0(+77.0)#1,732 |
| 70. | Cornell | 107.0 | 34.0(+73.0)#70 | 32.0(+75.0)#1,796 |
| 71. | Highland Park | 105.0 | 34.0(+71.0)#71 | 32.0(+73.0)#1,816 |
| 72. | Sims | 105.0 | 34.0(+71.0)#72 | 32.0(+73.0)#1,846 |
| 73. | Henry | 104.0 | 34.0(+70.0)#73 | 32.0(+72.0)#1,861 |
| 74. | Opdyke | 103.0 | 34.0(+69.0)#74 | 32.0(+71.0)#1,891 |
| 75. | Carpentersville | 102.0 | 34.0(+68.0)#75 | 32.0(+70.0)#1,893 |
| 76. | Minonk | 101.0 | 34.0(+67.0)#76 | 32.0(+69.0)#1,923 |
| 77. | Limestone | 100.0 | 34.0(+66.0)#77 | 32.0(+68.0)#1,943 |
| 78. | Ramsey | 100.0 | 34.0(+66.0)#78 | 32.0(+68.0)#1,944 |
| 79. | Bonnie Brae | 99.0 | 34.0(+65.0)#79 | 32.0(+67.0)#1,995 |
| 80. | Flanagan | 99.0 | 34.0(+65.0)#80 | 32.0(+67.0)#1,998 |
| 81. | Forest Park | 97.0 | 34.0(+63.0)#81 | 32.0(+65.0)#2,018 |
| 82. | Elwood | 97.0 | 34.0(+63.0)#82 | 32.0(+65.0)#2,032 |
| 83. | Mount Carroll | 97.0 | 34.0(+63.0)#83 | 32.0(+65.0)#2,037 |
| 84. | Toulon | 95.0 | 34.0(+61.0)#84 | 32.0(+63.0)#2,082 |
| 85. | Mccook | 95.0 | 34.0(+61.0)#85 | 32.0(+63.0)#2,091 |
| 86. | Perry | 95.0 | 34.0(+61.0)#86 | 32.0(+63.0)#2,093 |
| 87. | Carlinville | 94.0 | 34.0(+60.0)#87 | 32.0(+62.0)#2,105 |
| 88. | Avon | 93.0 | 34.0(+59.0)#88 | 32.0(+61.0)#2,154 |
| 89. | Kinmundy | 92.0 | 34.0(+58.0)#89 | 32.0(+60.0)#2,189 |
| 90. | Western Springs | 91.0 | 34.0(+57.0)#90 | 32.0(+59.0)#2,190 |
| 91. | Rochelle | 91.0 | 34.0(+57.0)#91 | 32.0(+59.0)#2,192 |
| 92. | Tuscola | 91.0 | 34.0(+57.0)#92 | 32.0(+59.0)#2,195 |
| 93. | Alsip | 89.0 | 34.0(+55.0)#93 | 32.0(+57.0)#2,246 |
| 94. | Creve Coeur | 89.0 | 34.0(+55.0)#94 | 32.0(+57.0)#2,251 |
| 95. | Trout Valley | 89.0 | 34.0(+55.0)#95 | 32.0(+57.0)#2,266 |
| 96. | Wauconda | 88.0 | 34.0(+54.0)#96 | 32.0(+56.0)#2,275 |
| 97. | Urbana | 87.0 | 34.0(+53.0)#97 | 32.0(+55.0)#2,308 |
| 98. | O Fallon | 87.0 | 34.0(+53.0)#98 | 32.0(+55.0)#2,309 |
| 99. | Evergreen Park | 86.0 | 34.0(+52.0)#99 | 32.0(+54.0)#2,345 |
| 100. | Rochester | 86.0 | 34.0(+52.0)#100 | 32.0(+54.0)#2,359 |
Common Questions
What are the Top 10 Cities with the Most Births per 1,000 Women Over the Age of 35 in Illinois?
Top 10 Cities with the Most Births per 1,000 Women Over the Age of 35 in Illinois are:
#1
1,000.0
#2
667.0
#3
500.0
#4
429.0
#5
333.0
#6
328.0
#7
273.0
#8
267.0
#9
259.0
#10
256.0
What city has the Most Births per 1,000 Women Over the Age of 35 in Illinois?
Beason has the Most Births per 1,000 Women Over the Age of 35 in Illinois with 1,000.0.
What is the Number of Births per 1,000 Women Over the Age of 35 in the State of Illinois?
Number of Births per 1,000 Women Over the Age of 35 in Illinois is 34.0.
What is the Number of Births per 1,000 Women Over the Age of 35 in the United States?
Number of Births per 1,000 Women Over the Age of 35 in the United States is 32.0.