Hollowayville, IL Map & Demographics
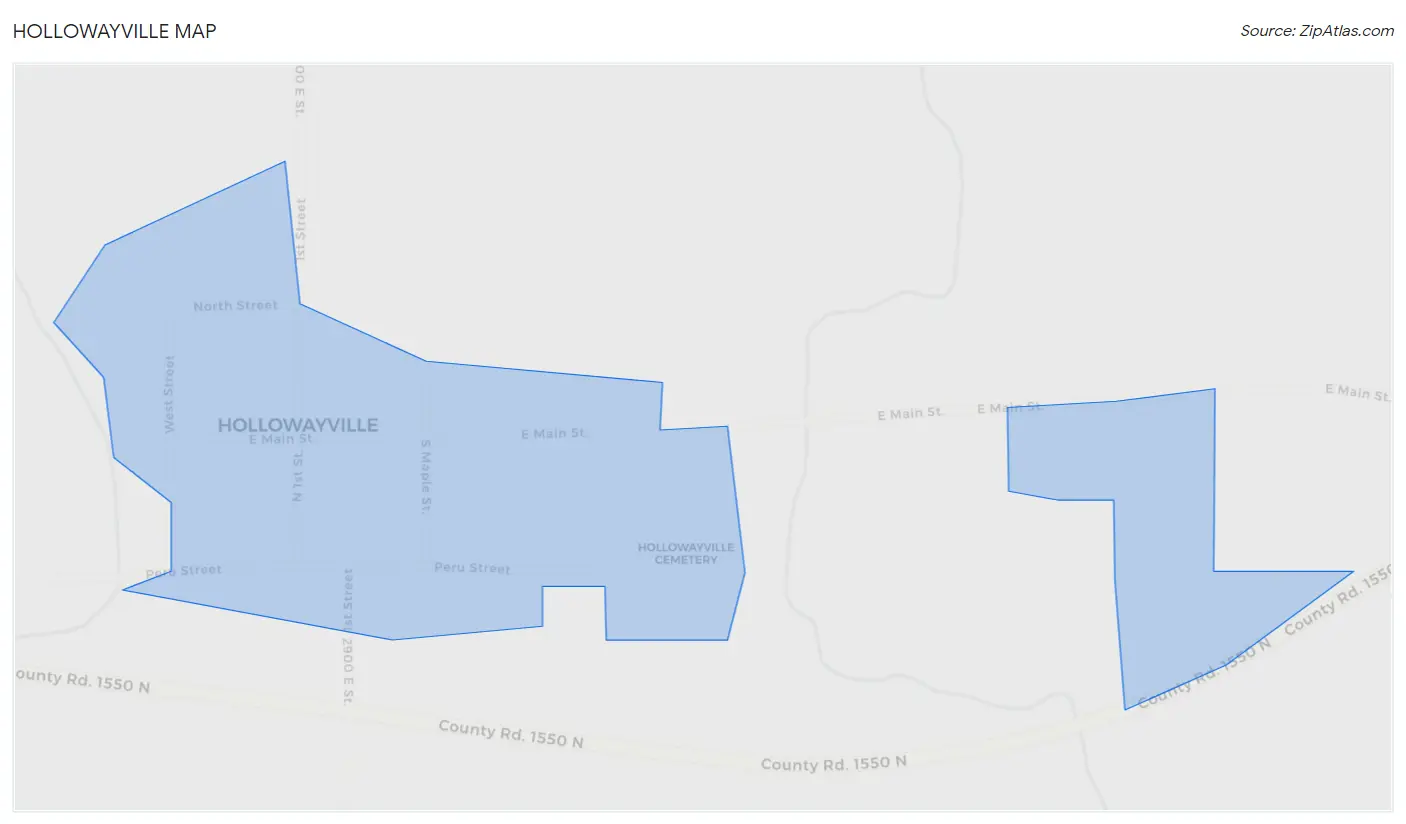
Hollowayville Map
Hollowayville Overview
$111,239
PER CAPITA INCOME
$120,417
AVG FAMILY INCOME
$121,250
AVG HOUSEHOLD INCOME
0.62
INEQUALITY / GINI INDEX
41
TOTAL POPULATION
23
MALE POPULATION
18
FEMALE POPULATION
127.78
MALES / 100 FEMALES
78.26
FEMALES / 100 MALES
45.6
MEDIAN AGE
2.5
AVG FAMILY SIZE
2.4
AVG HOUSEHOLD SIZE
30
LABOR FORCE [ PEOPLE ]
73.2%
PERCENT IN LABOR FORCE
Hollowayville Area Codes
Income in Hollowayville
Income Overview in Hollowayville
Per Capita Income in Hollowayville is $111,239, while median incomes of families and households are $120,417 and $121,250 respectively.
| Characteristic | Number | Measure |
| Per Capita Income | 41 | $111,239 |
| Median Family Income | 11 | $120,417 |
| Mean Family Income | 11 | $90,691 |
| Median Household Income | 17 | $121,250 |
| Mean Household Income | 17 | $329,918 |
| Income Deficit | 11 | $0 |
| Wage / Income Gap (%) | 41 | 0.00% |
| Wage / Income Gap ($) | 41 | 100.00¢ per $1 |
| Gini / Inequality Index | 41 | 0.62 |
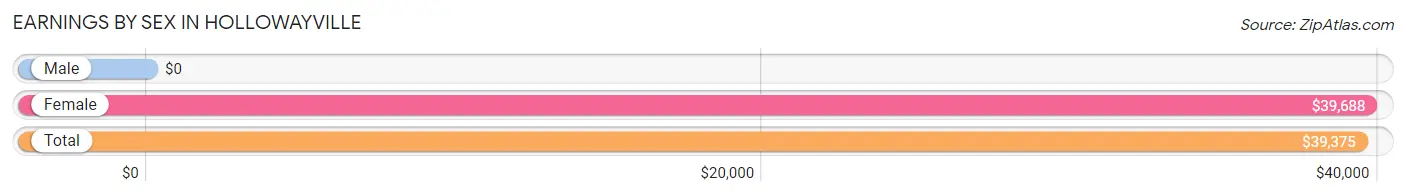
Earnings by Sex in Hollowayville
| Sex | Number | Average Earnings |
| Male | 17 (56.7%) | $0 |
| Female | 13 (43.3%) | $39,688 |
| Total | 30 (100.0%) | $39,375 |
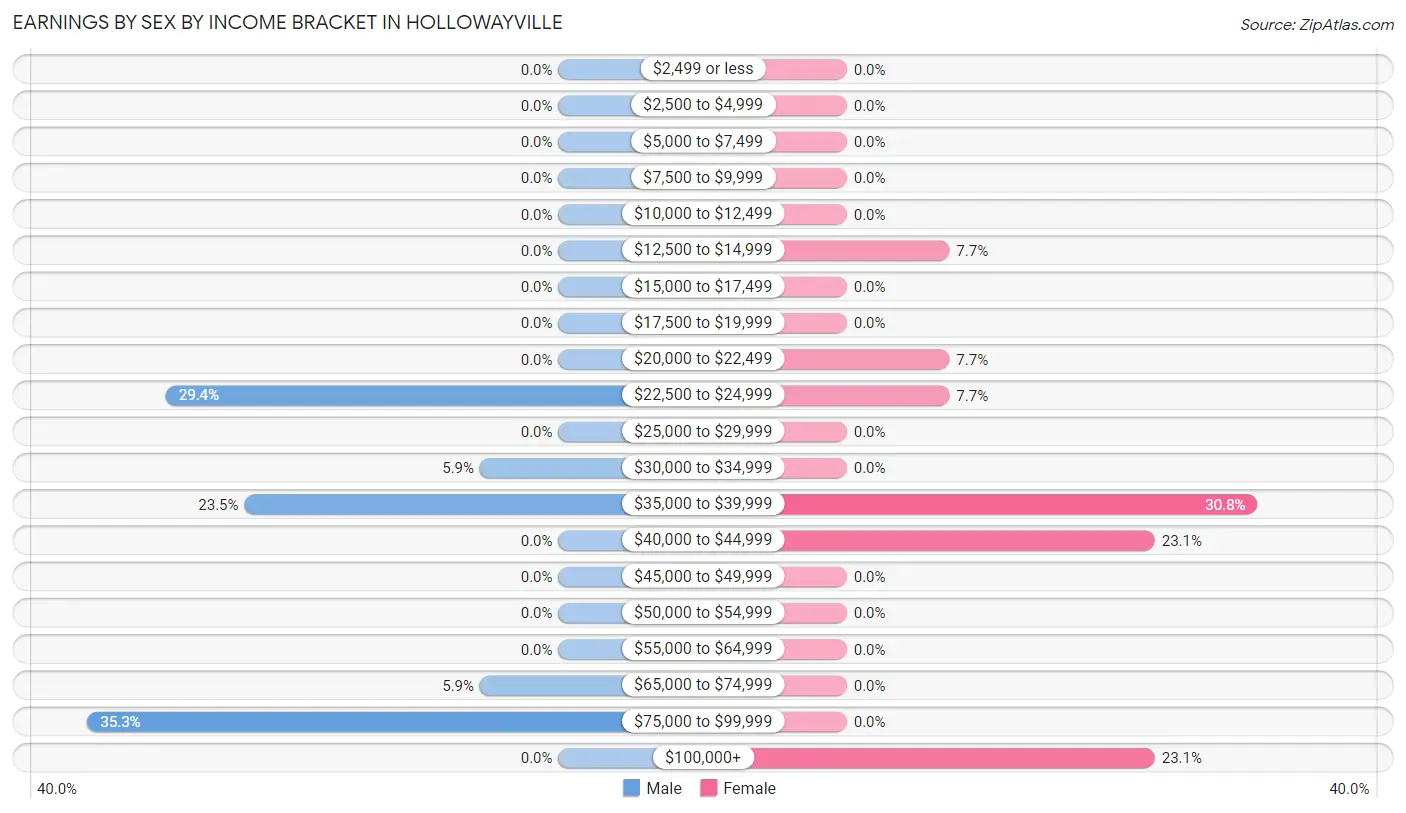
Earnings by Sex by Income Bracket in Hollowayville
The most common earnings brackets in Hollowayville are $75,000 to $99,999 for men (6 | 35.3%) and $35,000 to $39,999 for women (4 | 30.8%).
| Income | Male | Female |
| $2,499 or less | 0 (0.0%) | 0 (0.0%) |
| $2,500 to $4,999 | 0 (0.0%) | 0 (0.0%) |
| $5,000 to $7,499 | 0 (0.0%) | 0 (0.0%) |
| $7,500 to $9,999 | 0 (0.0%) | 0 (0.0%) |
| $10,000 to $12,499 | 0 (0.0%) | 0 (0.0%) |
| $12,500 to $14,999 | 0 (0.0%) | 1 (7.7%) |
| $15,000 to $17,499 | 0 (0.0%) | 0 (0.0%) |
| $17,500 to $19,999 | 0 (0.0%) | 0 (0.0%) |
| $20,000 to $22,499 | 0 (0.0%) | 1 (7.7%) |
| $22,500 to $24,999 | 5 (29.4%) | 1 (7.7%) |
| $25,000 to $29,999 | 0 (0.0%) | 0 (0.0%) |
| $30,000 to $34,999 | 1 (5.9%) | 0 (0.0%) |
| $35,000 to $39,999 | 4 (23.5%) | 4 (30.8%) |
| $40,000 to $44,999 | 0 (0.0%) | 3 (23.1%) |
| $45,000 to $49,999 | 0 (0.0%) | 0 (0.0%) |
| $50,000 to $54,999 | 0 (0.0%) | 0 (0.0%) |
| $55,000 to $64,999 | 0 (0.0%) | 0 (0.0%) |
| $65,000 to $74,999 | 1 (5.9%) | 0 (0.0%) |
| $75,000 to $99,999 | 6 (35.3%) | 0 (0.0%) |
| $100,000+ | 0 (0.0%) | 3 (23.1%) |
| Total | 17 (100.0%) | 13 (100.0%) |
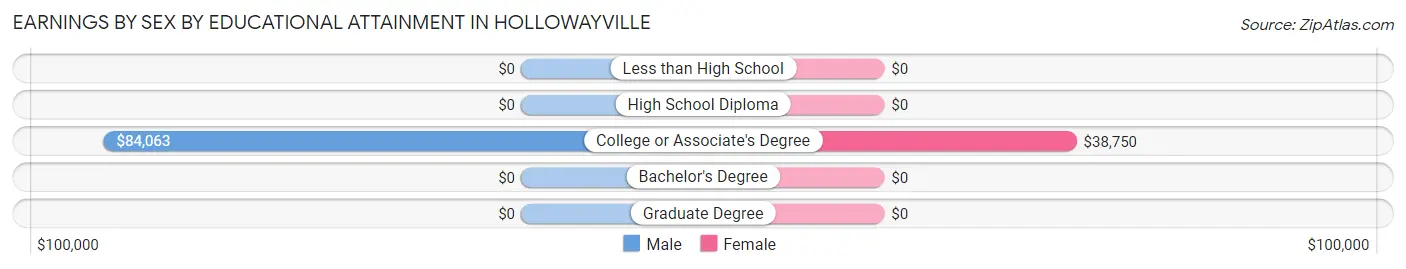
Earnings by Sex by Educational Attainment in Hollowayville
| Educational Attainment | Male Income | Female Income |
| Less than High School | - | - |
| High School Diploma | - | - |
| College or Associate's Degree | $84,063 | $38,750 |
| Bachelor's Degree | - | - |
| Graduate Degree | - | - |
| Total | - | - |
Family Income in Hollowayville
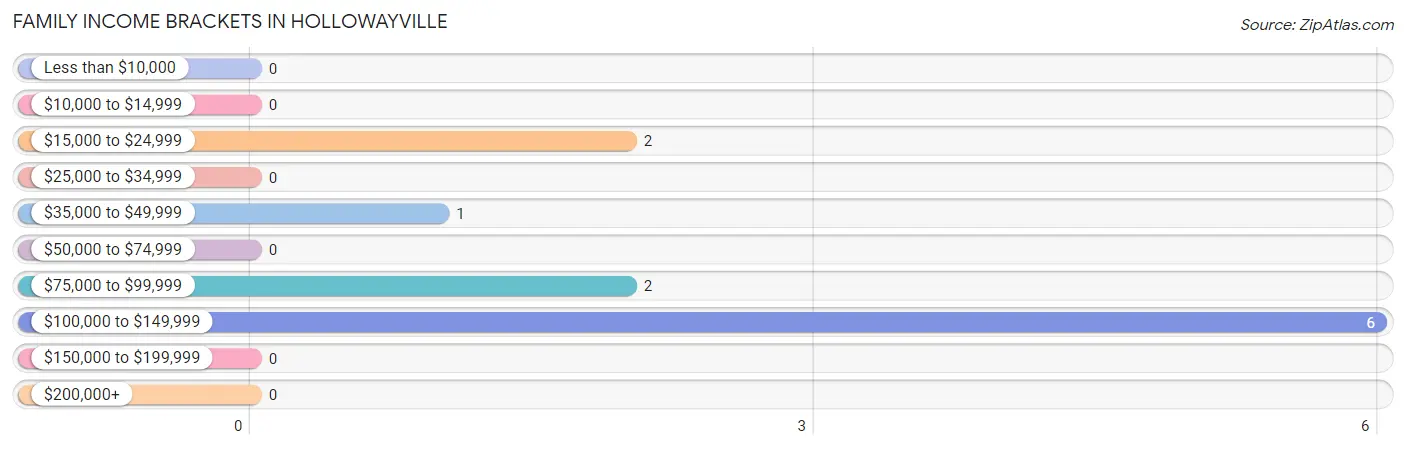
Family Income Brackets in Hollowayville
According to the Hollowayville family income data, there are 6 families falling into the $100,000 to $149,999 income range, which is the most common income bracket and makes up 54.5% of all families.
| Income Bracket | # Families | % Families |
| Less than $10,000 | 0 | 0.0% |
| $10,000 to $14,999 | 0 | 0.0% |
| $15,000 to $24,999 | 2 | 18.2% |
| $25,000 to $34,999 | 0 | 0.0% |
| $35,000 to $49,999 | 1 | 9.1% |
| $50,000 to $74,999 | 0 | 0.0% |
| $75,000 to $99,999 | 2 | 18.2% |
| $100,000 to $149,999 | 6 | 54.5% |
| $150,000 to $199,999 | 0 | 0.0% |
| $200,000+ | 0 | 0.0% |
Family Income by Famaliy Size in Hollowayville
| Income Bracket | # Families | Median Income |
| 2-Person Families | 5 (45.5%) | $0 |
| 3-Person Families | 6 (54.5%) | $0 |
| 4-Person Families | 0 (0.0%) | $0 |
| 5-Person Families | 0 (0.0%) | $0 |
| 6-Person Families | 0 (0.0%) | $0 |
| 7+ Person Families | 0 (0.0%) | $0 |
| Total | 11 (100.0%) | $120,417 |
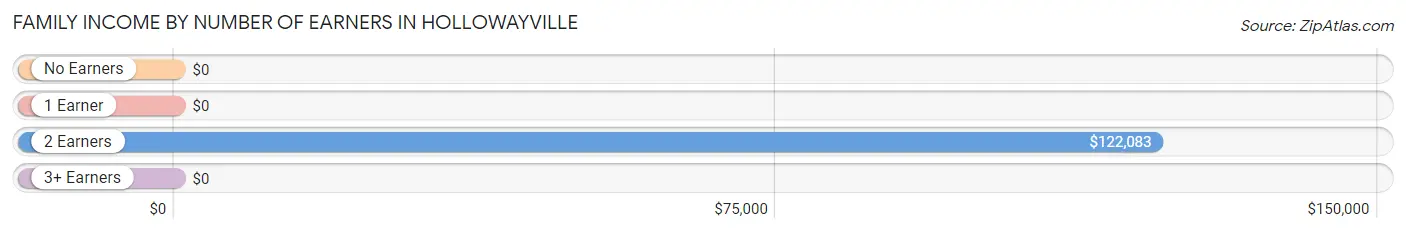
Family Income by Number of Earners in Hollowayville
| Number of Earners | # Families | Median Income |
| No Earners | 2 (18.2%) | $0 |
| 1 Earner | 2 (18.2%) | $0 |
| 2 Earners | 7 (63.6%) | $122,083 |
| 3+ Earners | 0 (0.0%) | $0 |
| Total | 11 (100.0%) | $120,417 |
Household Income in Hollowayville
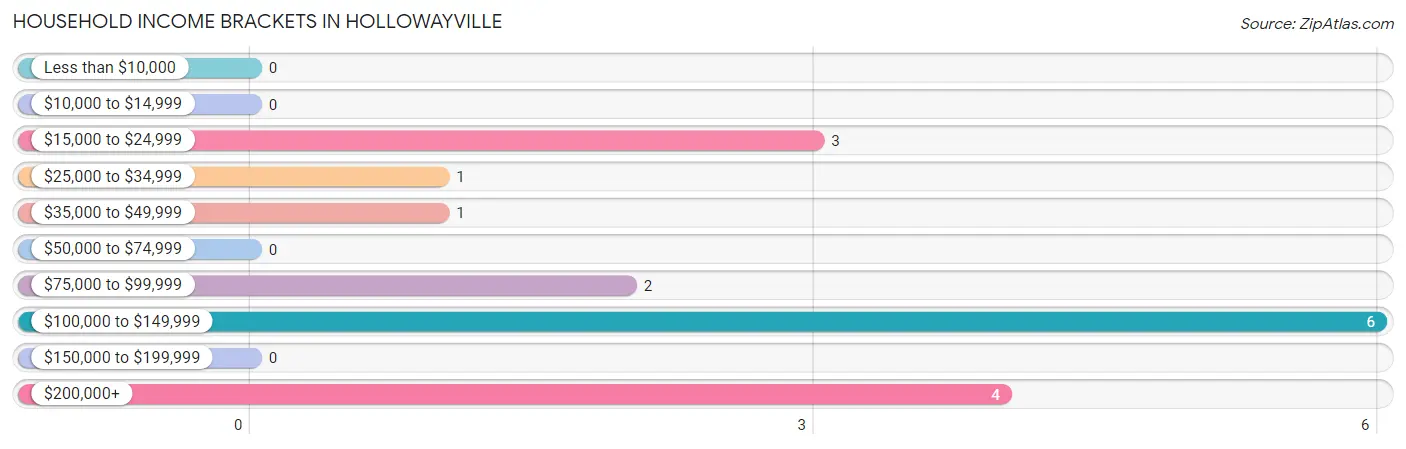
Household Income Brackets in Hollowayville
With 6 households falling in the category, the $100,000 to $149,999 income range is the most frequent in Hollowayville, accounting for 35.3% of all households.
| Income Bracket | # Households | % Households |
| Less than $10,000 | 0 | 0.0% |
| $10,000 to $14,999 | 0 | 0.0% |
| $15,000 to $24,999 | 3 | 17.6% |
| $25,000 to $34,999 | 1 | 5.9% |
| $35,000 to $49,999 | 1 | 5.9% |
| $50,000 to $74,999 | 0 | 0.0% |
| $75,000 to $99,999 | 2 | 11.8% |
| $100,000 to $149,999 | 6 | 35.3% |
| $150,000 to $199,999 | 0 | 0.0% |
| $200,000+ | 4 | 23.5% |
Household Income by Householder Age in Hollowayville
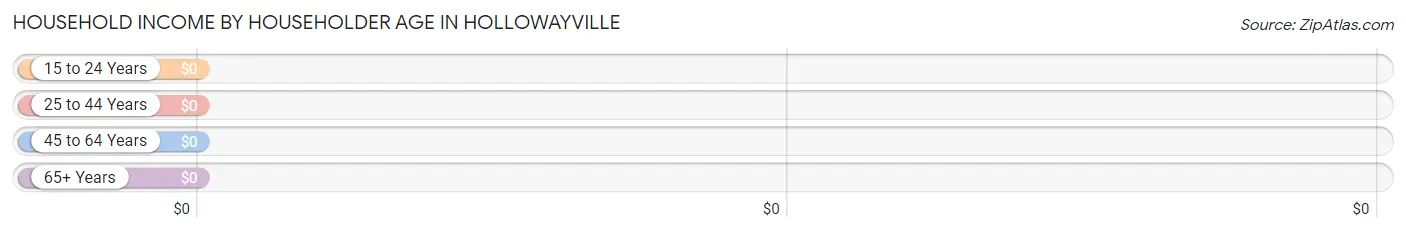
| Income Bracket | # Households | Median Income |
| 15 to 24 Years | 0 (0.0%) | $0 |
| 25 to 44 Years | 6 (35.3%) | $0 |
| 45 to 64 Years | 8 (47.1%) | $0 |
| 65+ Years | 3 (17.6%) | $0 |
| Total | 17 (100.0%) | $121,250 |
Poverty in Hollowayville
Income Below Poverty by Sex and Age in Hollowayville
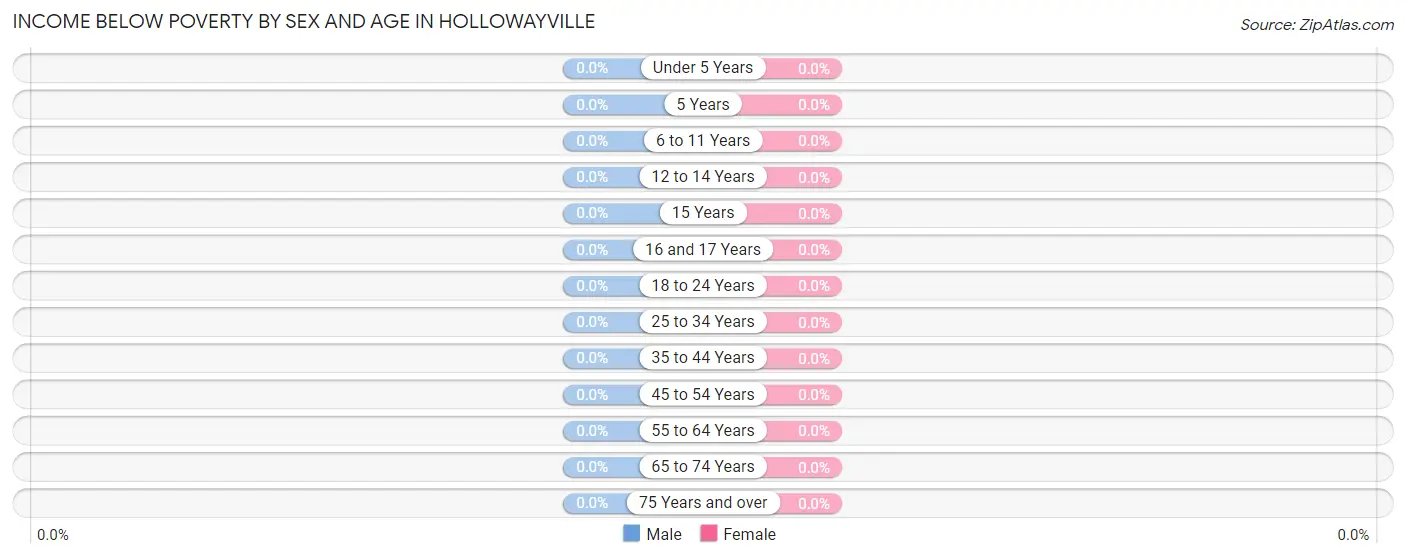
| Age Bracket | Male | Female |
| Under 5 Years | 0 (0.0%) | 0 (0.0%) |
| 5 Years | 0 (0.0%) | 0 (0.0%) |
| 6 to 11 Years | 0 (0.0%) | 0 (0.0%) |
| 12 to 14 Years | 0 (0.0%) | 0 (0.0%) |
| 15 Years | 0 (0.0%) | 0 (0.0%) |
| 16 and 17 Years | 0 (0.0%) | 0 (0.0%) |
| 18 to 24 Years | 0 (0.0%) | 0 (0.0%) |
| 25 to 34 Years | 0 (0.0%) | 0 (0.0%) |
| 35 to 44 Years | 0 (0.0%) | 0 (0.0%) |
| 45 to 54 Years | 0 (0.0%) | 0 (0.0%) |
| 55 to 64 Years | 0 (0.0%) | 0 (0.0%) |
| 65 to 74 Years | 0 (0.0%) | 0 (0.0%) |
| 75 Years and over | 0 (0.0%) | 0 (0.0%) |
| Total | 0 (0.0%) | 0 (0.0%) |
Income Above Poverty by Sex and Age in Hollowayville
According to the poverty statistics in Hollowayville, males aged 16 and 17 years and females aged 35 to 44 years are the age groups that are most secure financially, with 100.0% of males and 100.0% of females in these age groups living above the poverty line.
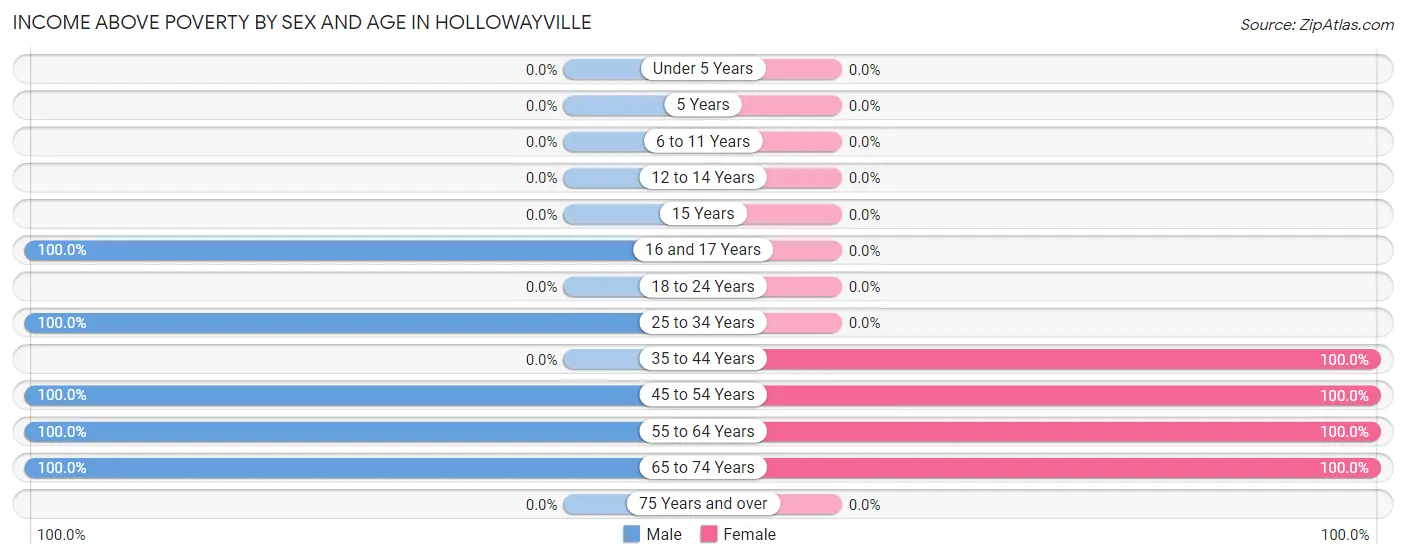
| Age Bracket | Male | Female |
| Under 5 Years | 0 (0.0%) | 0 (0.0%) |
| 5 Years | 0 (0.0%) | 0 (0.0%) |
| 6 to 11 Years | 0 (0.0%) | 0 (0.0%) |
| 12 to 14 Years | 0 (0.0%) | 0 (0.0%) |
| 15 Years | 0 (0.0%) | 0 (0.0%) |
| 16 and 17 Years | 4 (100.0%) | 0 (0.0%) |
| 18 to 24 Years | 0 (0.0%) | 0 (0.0%) |
| 25 to 34 Years | 5 (100.0%) | 0 (0.0%) |
| 35 to 44 Years | 0 (0.0%) | 9 (100.0%) |
| 45 to 54 Years | 7 (100.0%) | 5 (100.0%) |
| 55 to 64 Years | 6 (100.0%) | 2 (100.0%) |
| 65 to 74 Years | 1 (100.0%) | 2 (100.0%) |
| 75 Years and over | 0 (0.0%) | 0 (0.0%) |
| Total | 23 (100.0%) | 18 (100.0%) |
Income Below Poverty Among Married-Couple Families in Hollowayville
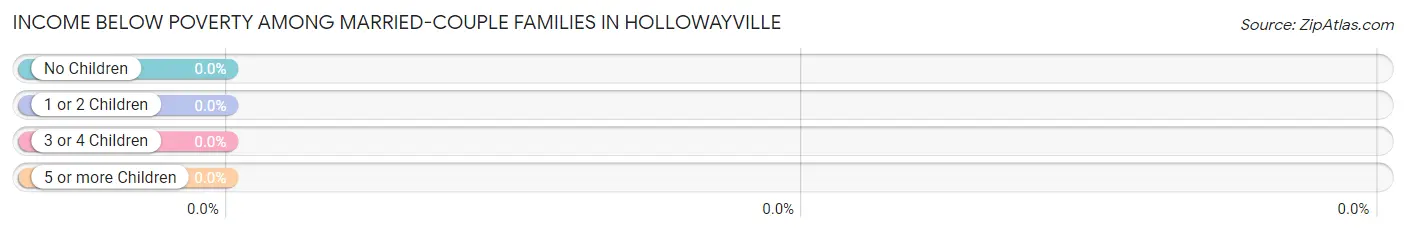
| Children | Above Poverty | Below Poverty |
| No Children | 3 (100.0%) | 0 (0.0%) |
| 1 or 2 Children | 6 (100.0%) | 0 (0.0%) |
| 3 or 4 Children | 0 (0.0%) | 0 (0.0%) |
| 5 or more Children | 0 (0.0%) | 0 (0.0%) |
| Total | 9 (100.0%) | 0 (0.0%) |
Income Below Poverty Among Single-Parent Households in Hollowayville
| Children | Single Father | Single Mother |
| No Children | 0 (0.0%) | 0 (0.0%) |
| 1 or 2 Children | 0 (0.0%) | 0 (0.0%) |
| 3 or 4 Children | 0 (0.0%) | 0 (0.0%) |
| 5 or more Children | 0 (0.0%) | 0 (0.0%) |
| Total | 0 (0.0%) | 0 (0.0%) |
Income Below Poverty Among Married-Couple vs Single-Parent Households in Hollowayville
| Children | Married-Couple Families | Single-Parent Households |
| No Children | 0 (0.0%) | 0 (0.0%) |
| 1 or 2 Children | 0 (0.0%) | 0 (0.0%) |
| 3 or 4 Children | 0 (0.0%) | 0 (0.0%) |
| 5 or more Children | 0 (0.0%) | 0 (0.0%) |
| Total | 0 (0.0%) | 0 (0.0%) |
Race in Hollowayville
The most populous races in Hollowayville are White / Caucasian (41 | 100.0%), and Hispanic or Latino (1 | 2.4%).
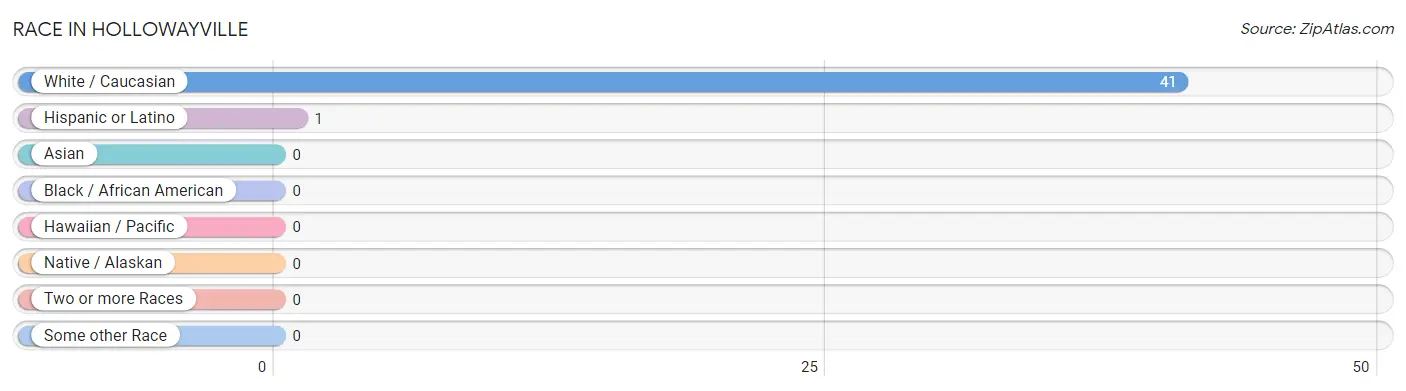
| Race | # Population | % Population |
| Asian | 0 | 0.0% |
| Black / African American | 0 | 0.0% |
| Hawaiian / Pacific | 0 | 0.0% |
| Hispanic or Latino | 1 | 2.4% |
| Native / Alaskan | 0 | 0.0% |
| White / Caucasian | 41 | 100.0% |
| Two or more Races | 0 | 0.0% |
| Some other Race | 0 | 0.0% |
| Total | 41 | 100.0% |
Ancestry in Hollowayville
The most populous ancestries reported in Hollowayville are German (19 | 46.3%), Italian (15 | 36.6%), Polish (6 | 14.6%), English (4 | 9.8%), and Scotch-Irish (2 | 4.9%), together accounting for 112.2% of all Hollowayville residents.
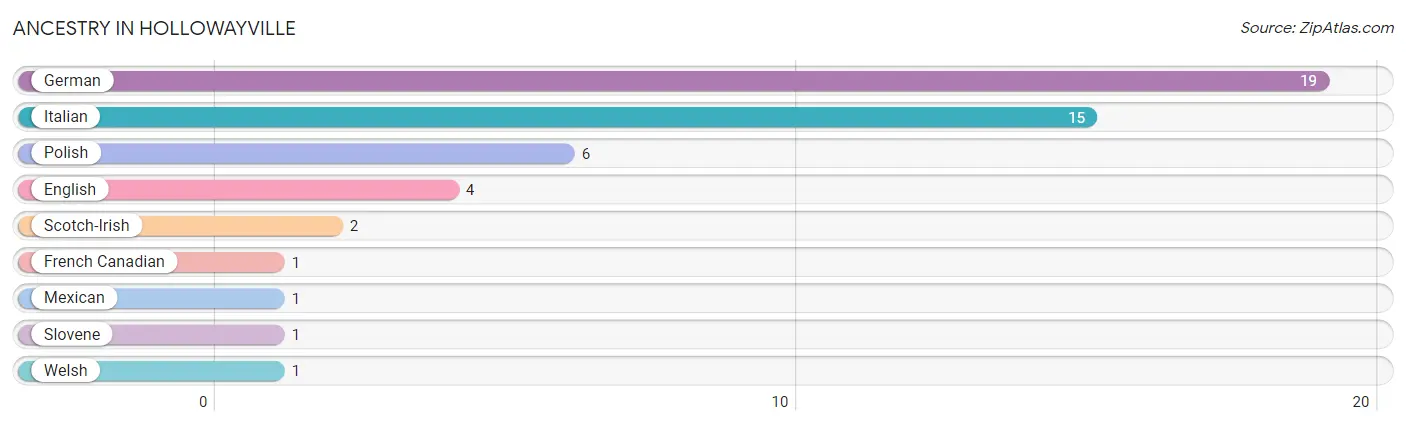
| Ancestry | # Population | % Population |
| English | 4 | 9.8% |
| French Canadian | 1 | 2.4% |
| German | 19 | 46.3% |
| Italian | 15 | 36.6% |
| Mexican | 1 | 2.4% |
| Polish | 6 | 14.6% |
| Scotch-Irish | 2 | 4.9% |
| Slovene | 1 | 2.4% |
| Welsh | 1 | 2.4% | View All 9 Rows |
Immigrants in Hollowayville
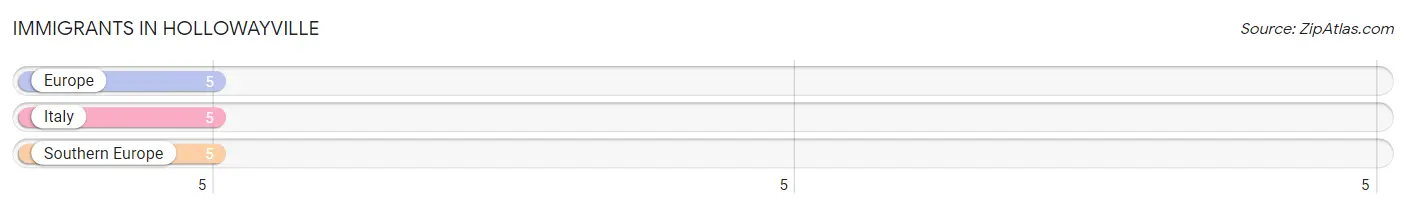
The most numerous immigrant groups reported in Hollowayville came from Europe (5 | 12.2%), Italy (5 | 12.2%), and Southern Europe (5 | 12.2%), together accounting for 36.6% of all Hollowayville residents.
| Immigration Origin | # Population | % Population |
| Europe | 5 | 12.2% |
| Italy | 5 | 12.2% |
| Southern Europe | 5 | 12.2% | View All 3 Rows |
Sex and Age in Hollowayville
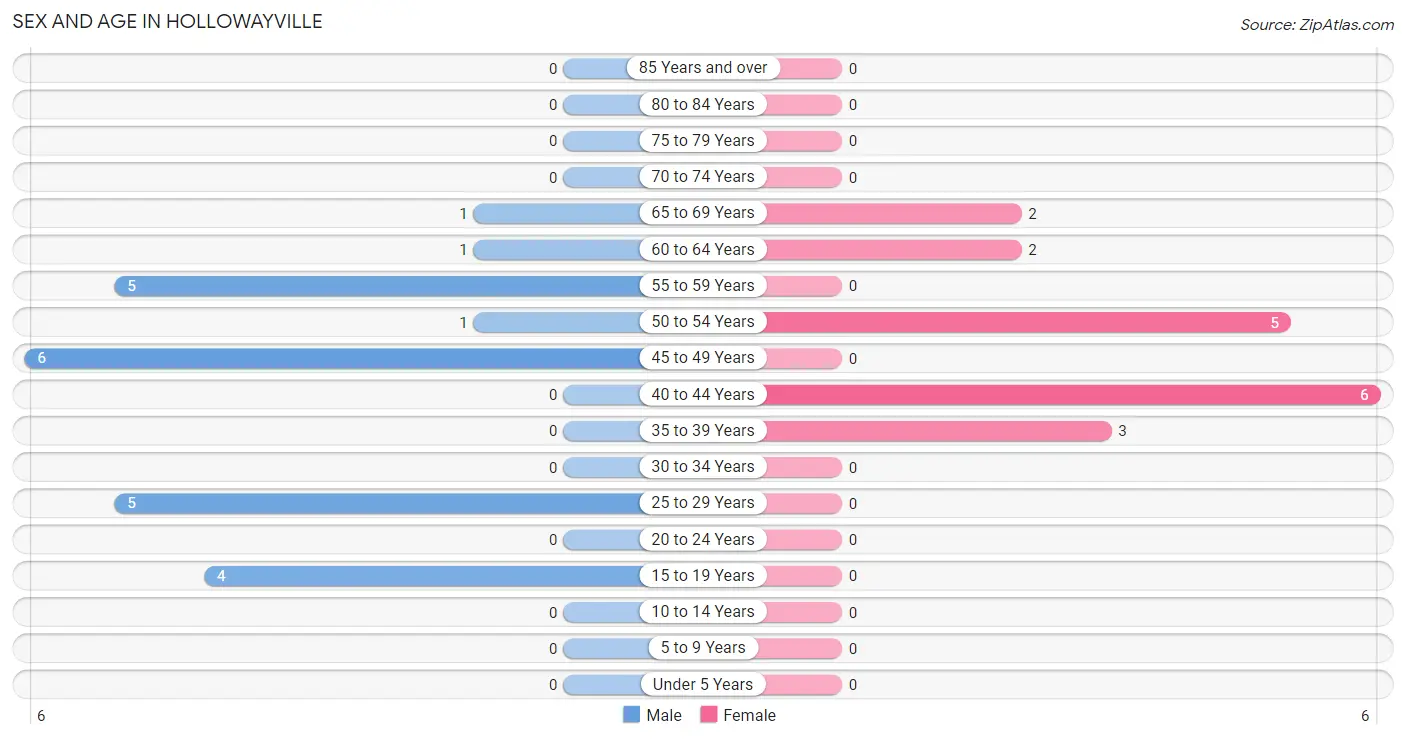
Sex and Age in Hollowayville
The most populous age groups in Hollowayville are 45 to 49 Years (6 | 26.1%) for men and 40 to 44 Years (6 | 33.3%) for women.
| Age Bracket | Male | Female |
| Under 5 Years | 0 (0.0%) | 0 (0.0%) |
| 5 to 9 Years | 0 (0.0%) | 0 (0.0%) |
| 10 to 14 Years | 0 (0.0%) | 0 (0.0%) |
| 15 to 19 Years | 4 (17.4%) | 0 (0.0%) |
| 20 to 24 Years | 0 (0.0%) | 0 (0.0%) |
| 25 to 29 Years | 5 (21.7%) | 0 (0.0%) |
| 30 to 34 Years | 0 (0.0%) | 0 (0.0%) |
| 35 to 39 Years | 0 (0.0%) | 3 (16.7%) |
| 40 to 44 Years | 0 (0.0%) | 6 (33.3%) |
| 45 to 49 Years | 6 (26.1%) | 0 (0.0%) |
| 50 to 54 Years | 1 (4.3%) | 5 (27.8%) |
| 55 to 59 Years | 5 (21.7%) | 0 (0.0%) |
| 60 to 64 Years | 1 (4.3%) | 2 (11.1%) |
| 65 to 69 Years | 1 (4.3%) | 2 (11.1%) |
| 70 to 74 Years | 0 (0.0%) | 0 (0.0%) |
| 75 to 79 Years | 0 (0.0%) | 0 (0.0%) |
| 80 to 84 Years | 0 (0.0%) | 0 (0.0%) |
| 85 Years and over | 0 (0.0%) | 0 (0.0%) |
| Total | 23 (100.0%) | 18 (100.0%) |
Families and Households in Hollowayville
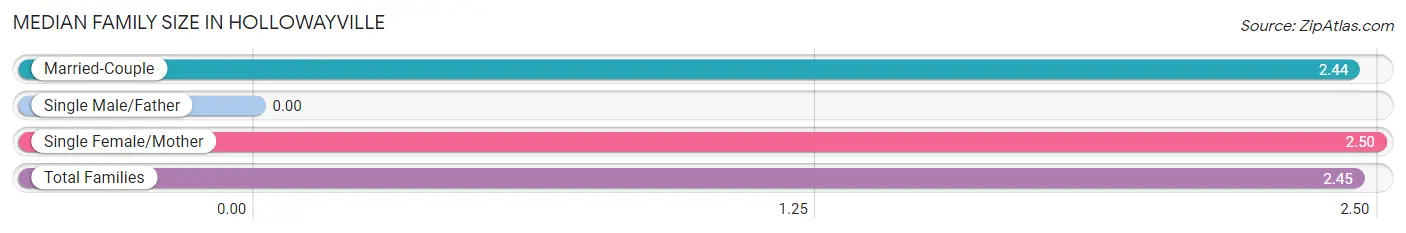
Median Family Size in Hollowayville
| Family Type | # Families | Family Size |
| Married-Couple | 9 (81.8%) | 2.44 |
| Single Male/Father | 0 (0.0%) | - |
| Single Female/Mother | 2 (18.2%) | 2.50 |
| Total Families | 11 (100.0%) | 2.45 |
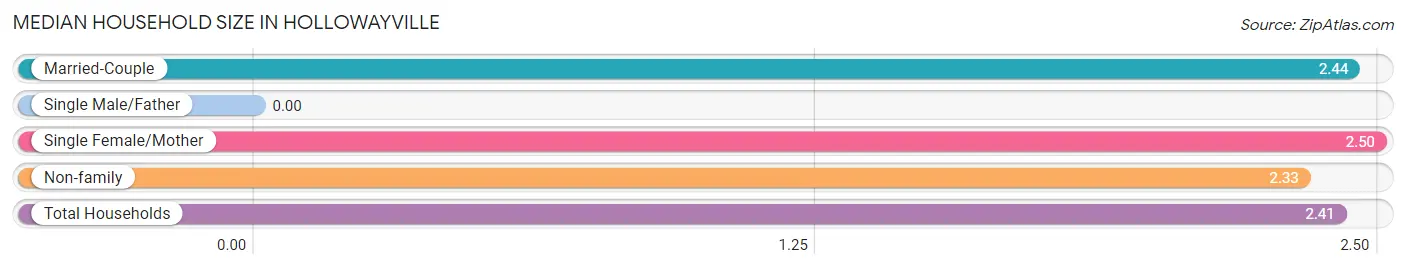
Median Household Size in Hollowayville
| Household Type | # Households | Household Size |
| Married-Couple | 9 (52.9%) | 2.44 |
| Single Male/Father | 0 (0.0%) | - |
| Single Female/Mother | 2 (11.8%) | 2.50 |
| Non-family | 6 (35.3%) | 2.33 |
| Total Households | 17 (100.0%) | 2.41 |
Household Size by Marriage Status in Hollowayville
Out of a total of 17 households in Hollowayville, 11 (64.7%) are family households, while 6 (35.3%) are nonfamily households. The most numerous type of family households are 3-person households, comprising 6, and the most common type of nonfamily households are 3-person households, comprising 4.
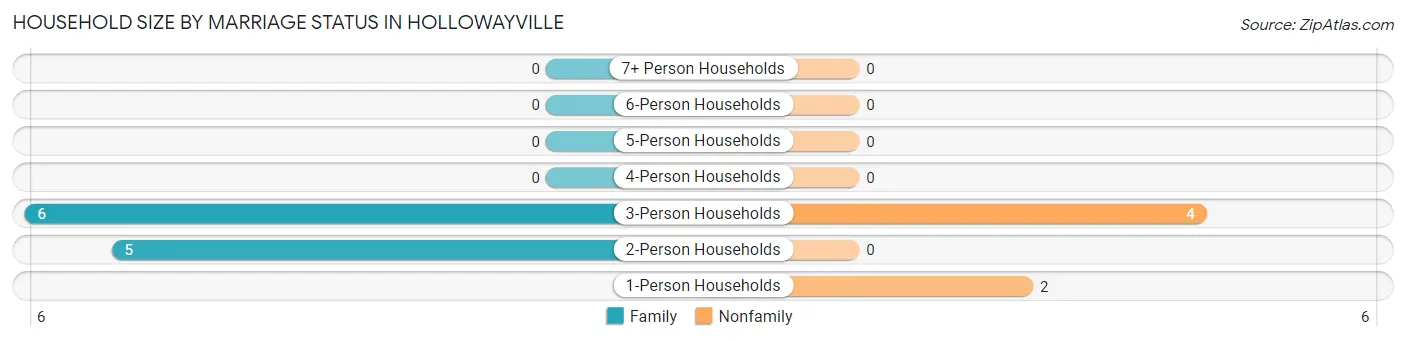
| Household Size | Family Households | Nonfamily Households |
| 1-Person Households | - | 2 (11.8%) |
| 2-Person Households | 5 (29.4%) | 0 (0.0%) |
| 3-Person Households | 6 (35.3%) | 4 (23.5%) |
| 4-Person Households | 0 (0.0%) | 0 (0.0%) |
| 5-Person Households | 0 (0.0%) | 0 (0.0%) |
| 6-Person Households | 0 (0.0%) | 0 (0.0%) |
| 7+ Person Households | 0 (0.0%) | 0 (0.0%) |
| Total | 11 (64.7%) | 6 (35.3%) |
Female Fertility in Hollowayville
Fertility by Age in Hollowayville
| Age Bracket | Women with Births | Births / 1,000 Women |
| 15 to 19 years | 0 (0.0%) | 0.0 |
| 20 to 34 years | 0 (0.0%) | 0.0 |
| 35 to 50 years | 0 (0.0%) | 0.0 |
| Total | 0 (0.0%) | 0.0 |
Fertility by Age by Marriage Status in Hollowayville
| Age Bracket | Married | Unmarried |
| 15 to 19 years | 0 (0.0%) | 0 (0.0%) |
| 20 to 34 years | 0 (0.0%) | 0 (0.0%) |
| 35 to 50 years | 0 (0.0%) | 0 (0.0%) |
| Total | 0 (0.0%) | 0 (0.0%) |
Fertility by Education in Hollowayville
| Educational Attainment | Women with Births | Births / 1,000 Women |
| Less than High School | 0 (0.0%) | 0.0 |
| High School Diploma | 0 (0.0%) | 0.0 |
| College or Associate's Degree | 0 (0.0%) | 0.0 |
| Bachelor's Degree | 0 (0.0%) | 0.0 |
| Graduate Degree | 0 (0.0%) | 0.0 |
| Total | 0 (0.0%) | 0.0 |
Fertility by Education by Marriage Status in Hollowayville
| Educational Attainment | Married | Unmarried |
| Less than High School | 0 (0.0%) | 0 (0.0%) |
| High School Diploma | 0 (0.0%) | 0 (0.0%) |
| College or Associate's Degree | 0 (0.0%) | 0 (0.0%) |
| Bachelor's Degree | 0 (0.0%) | 0 (0.0%) |
| Graduate Degree | 0 (0.0%) | 0 (0.0%) |
| Total | 0 (0.0%) | 0 (0.0%) |
Employment Characteristics in Hollowayville
Employment by Class of Employer in Hollowayville
Among the 30 employed individuals in Hollowayville, private company employees (19 | 63.3%), self-employed (not incorporated) (4 | 13.3%), and local government employees (4 | 13.3%) make up the most common classes of employment.
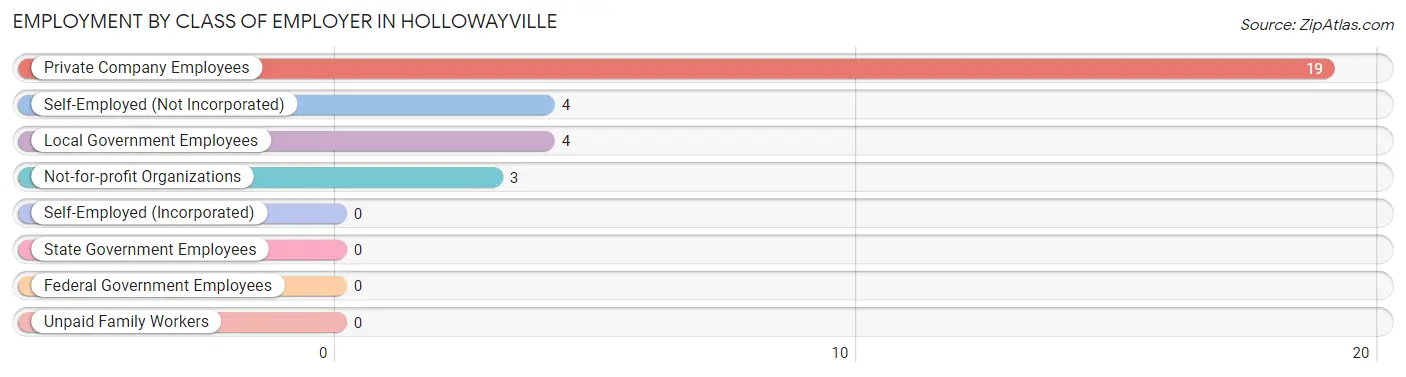
| Employer Class | # Employees | % Employees |
| Private Company Employees | 19 | 63.3% |
| Self-Employed (Incorporated) | 0 | 0.0% |
| Self-Employed (Not Incorporated) | 4 | 13.3% |
| Not-for-profit Organizations | 3 | 10.0% |
| Local Government Employees | 4 | 13.3% |
| State Government Employees | 0 | 0.0% |
| Federal Government Employees | 0 | 0.0% |
| Unpaid Family Workers | 0 | 0.0% |
| Total | 30 | 100.0% |
Employment Status by Age in Hollowayville
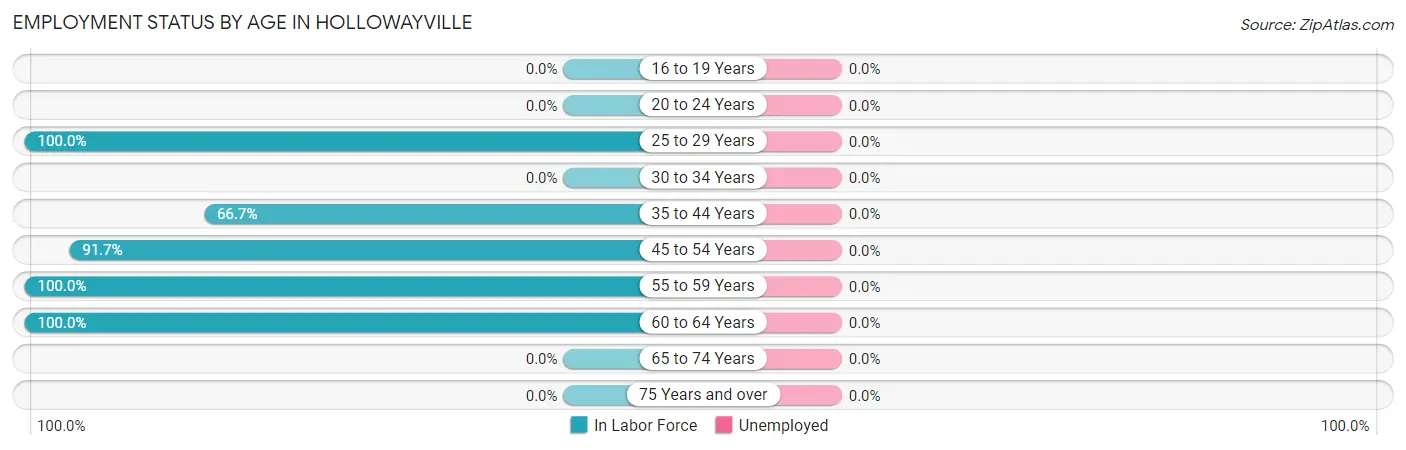
| Age Bracket | In Labor Force | Unemployed |
| 16 to 19 Years | 0 (0.0%) | 0 (0.0%) |
| 20 to 24 Years | 0 (0.0%) | 0 (0.0%) |
| 25 to 29 Years | 5 (100.0%) | 0 (0.0%) |
| 30 to 34 Years | 0 (0.0%) | 0 (0.0%) |
| 35 to 44 Years | 6 (66.7%) | 0 (0.0%) |
| 45 to 54 Years | 11 (91.7%) | 0 (0.0%) |
| 55 to 59 Years | 5 (100.0%) | 0 (0.0%) |
| 60 to 64 Years | 3 (100.0%) | 0 (0.0%) |
| 65 to 74 Years | 0 (0.0%) | 0 (0.0%) |
| 75 Years and over | 0 (0.0%) | 0 (0.0%) |
| Total | 30 (73.2%) | 0 (0.0%) |
Employment Status by Educational Attainment in Hollowayville
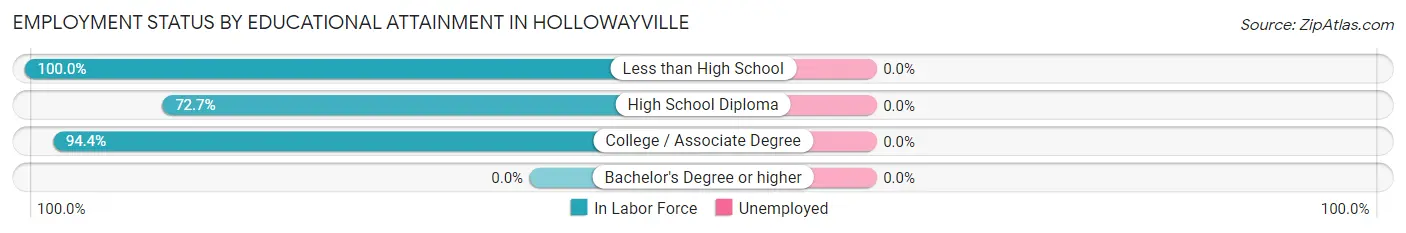
| Educational Attainment | In Labor Force | Unemployed |
| Less than High School | 5 (100.0%) | 0 (0.0%) |
| High School Diploma | 8 (72.7%) | 0 (0.0%) |
| College / Associate Degree | 17 (94.4%) | 0 (0.0%) |
| Bachelor's Degree or higher | 0 (0.0%) | 0 (0.0%) |
| Total | 30 (88.2%) | 0 (0.0%) |
Employment Occupations by Sex in Hollowayville
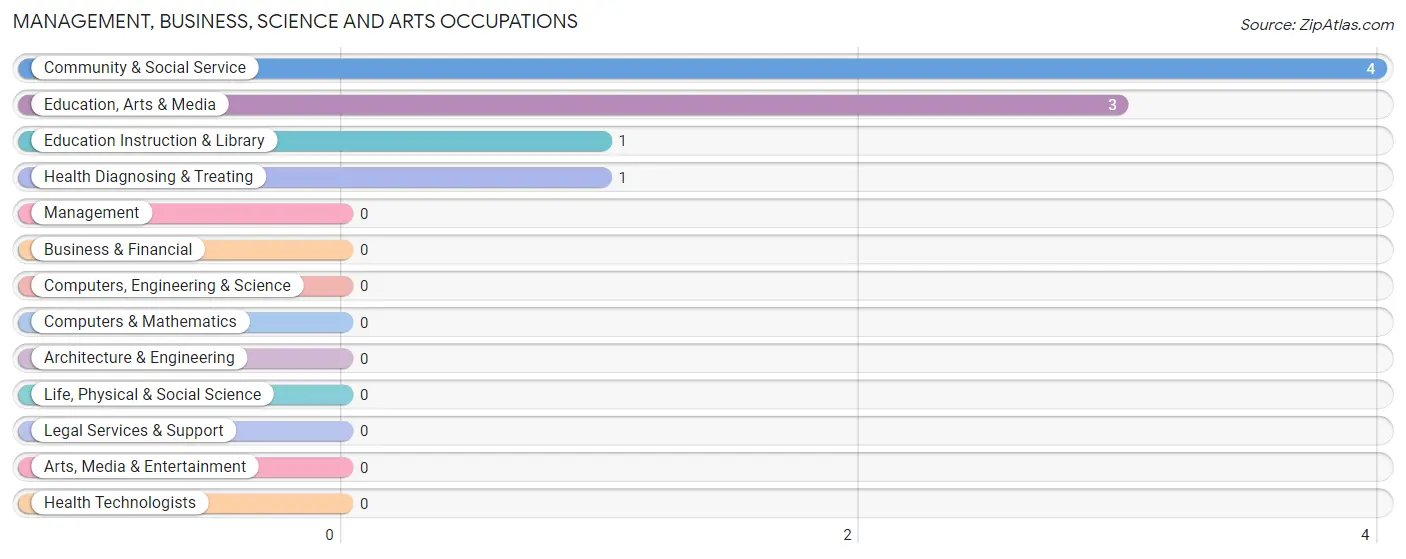
Management, Business, Science and Arts Occupations
The most common Management, Business, Science and Arts occupations in Hollowayville are Community & Social Service (4 | 13.3%), Education, Arts & Media (3 | 10.0%), Education Instruction & Library (1 | 3.3%), and Health Diagnosing & Treating (1 | 3.3%).
Management, Business, Science and Arts Occupations by Sex
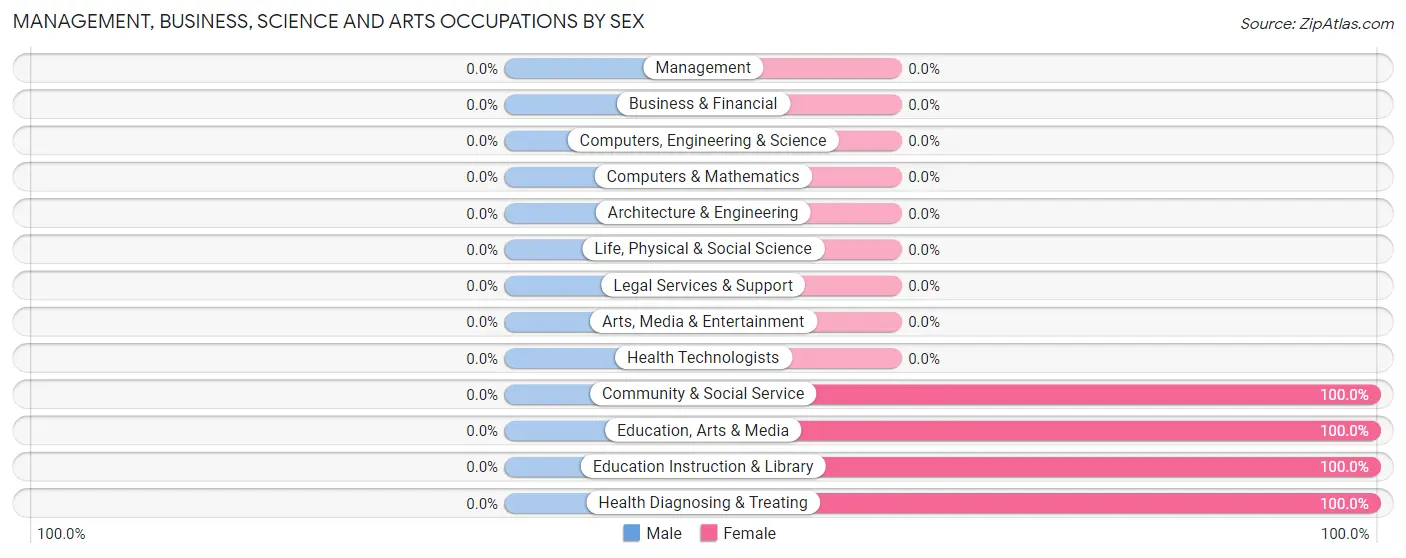
| Occupation | Male | Female |
| Management | 0 (0.0%) | 0 (0.0%) |
| Business & Financial | 0 (0.0%) | 0 (0.0%) |
| Computers, Engineering & Science | 0 (0.0%) | 0 (0.0%) |
| Computers & Mathematics | 0 (0.0%) | 0 (0.0%) |
| Architecture & Engineering | 0 (0.0%) | 0 (0.0%) |
| Life, Physical & Social Science | 0 (0.0%) | 0 (0.0%) |
| Community & Social Service | 0 (0.0%) | 4 (100.0%) |
| Education, Arts & Media | 0 (0.0%) | 3 (100.0%) |
| Legal Services & Support | 0 (0.0%) | 0 (0.0%) |
| Education Instruction & Library | 0 (0.0%) | 1 (100.0%) |
| Arts, Media & Entertainment | 0 (0.0%) | 0 (0.0%) |
| Health Diagnosing & Treating | 0 (0.0%) | 1 (100.0%) |
| Health Technologists | 0 (0.0%) | 0 (0.0%) |
| Total (Category) | 0 (0.0%) | 5 (100.0%) |
| Total (Overall) | 17 (56.7%) | 13 (43.3%) |
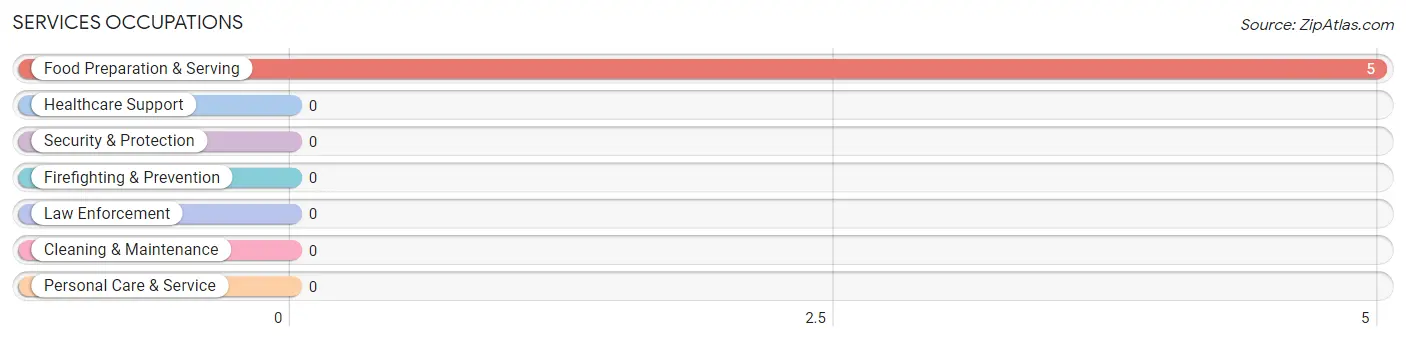
Services Occupations
The most common Services occupations in Hollowayville are , and Food Preparation & Serving (5 | 16.7%).
Services Occupations by Sex
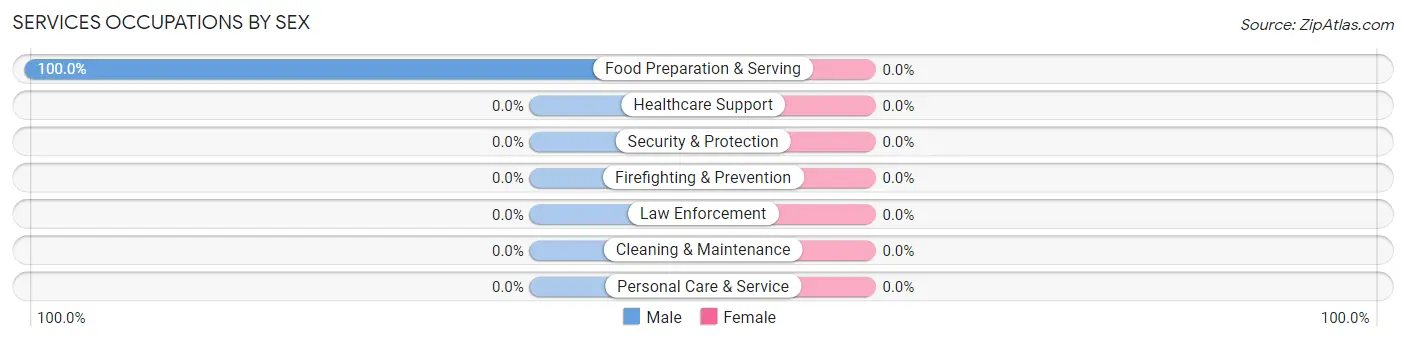
| Occupation | Male | Female |
| Healthcare Support | 0 (0.0%) | 0 (0.0%) |
| Security & Protection | 0 (0.0%) | 0 (0.0%) |
| Firefighting & Prevention | 0 (0.0%) | 0 (0.0%) |
| Law Enforcement | 0 (0.0%) | 0 (0.0%) |
| Food Preparation & Serving | 5 (100.0%) | 0 (0.0%) |
| Cleaning & Maintenance | 0 (0.0%) | 0 (0.0%) |
| Personal Care & Service | 0 (0.0%) | 0 (0.0%) |
| Total (Category) | 5 (100.0%) | 0 (0.0%) |
| Total (Overall) | 17 (56.7%) | 13 (43.3%) |
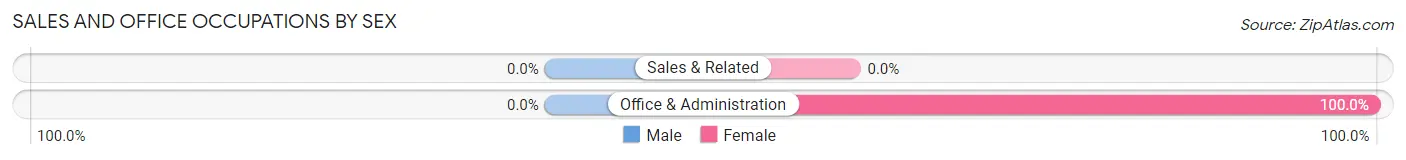
Sales and Office Occupations
The most common Sales and Office occupations in Hollowayville are , and Office & Administration (6 | 20.0%).
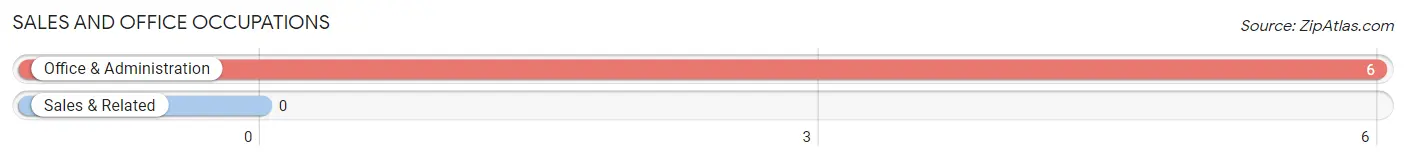
Sales and Office Occupations by Sex
| Occupation | Male | Female |
| Sales & Related | 0 (0.0%) | 0 (0.0%) |
| Office & Administration | 0 (0.0%) | 6 (100.0%) |
| Total (Category) | 0 (0.0%) | 6 (100.0%) |
| Total (Overall) | 17 (56.7%) | 13 (43.3%) |
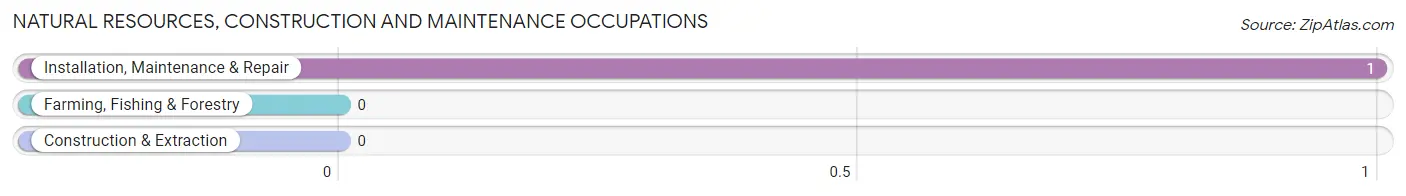
Natural Resources, Construction and Maintenance Occupations
The most common Natural Resources, Construction and Maintenance occupations in Hollowayville are , and Installation, Maintenance & Repair (1 | 3.3%).
Natural Resources, Construction and Maintenance Occupations by Sex
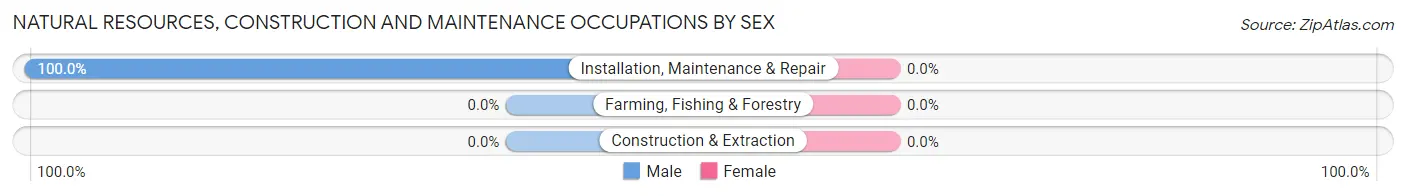
| Occupation | Male | Female |
| Farming, Fishing & Forestry | 0 (0.0%) | 0 (0.0%) |
| Construction & Extraction | 0 (0.0%) | 0 (0.0%) |
| Installation, Maintenance & Repair | 1 (100.0%) | 0 (0.0%) |
| Total (Category) | 1 (100.0%) | 0 (0.0%) |
| Total (Overall) | 17 (56.7%) | 13 (43.3%) |
Production, Transportation and Moving Occupations
The most common Production, Transportation and Moving occupations in Hollowayville are Transportation (11 | 36.7%), Production (1 | 3.3%), and Material Moving (1 | 3.3%).
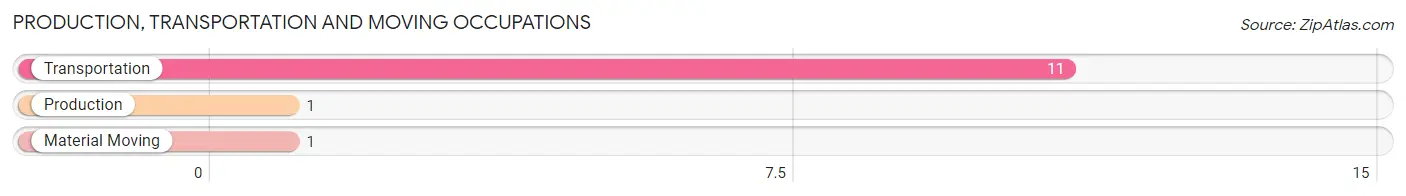
Production, Transportation and Moving Occupations by Sex
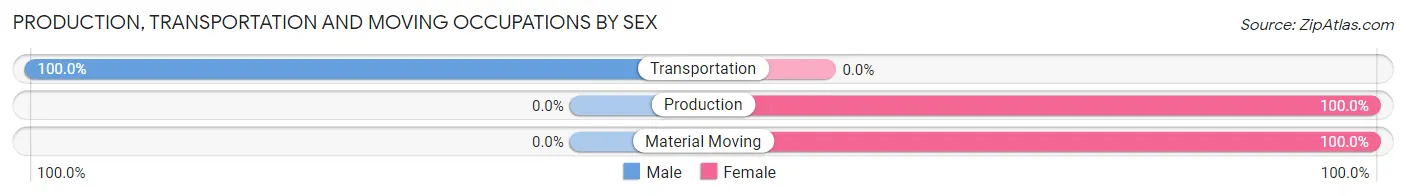
| Occupation | Male | Female |
| Production | 0 (0.0%) | 1 (100.0%) |
| Transportation | 11 (100.0%) | 0 (0.0%) |
| Material Moving | 0 (0.0%) | 1 (100.0%) |
| Total (Category) | 11 (84.6%) | 2 (15.4%) |
| Total (Overall) | 17 (56.7%) | 13 (43.3%) |
Employment Industries by Sex in Hollowayville
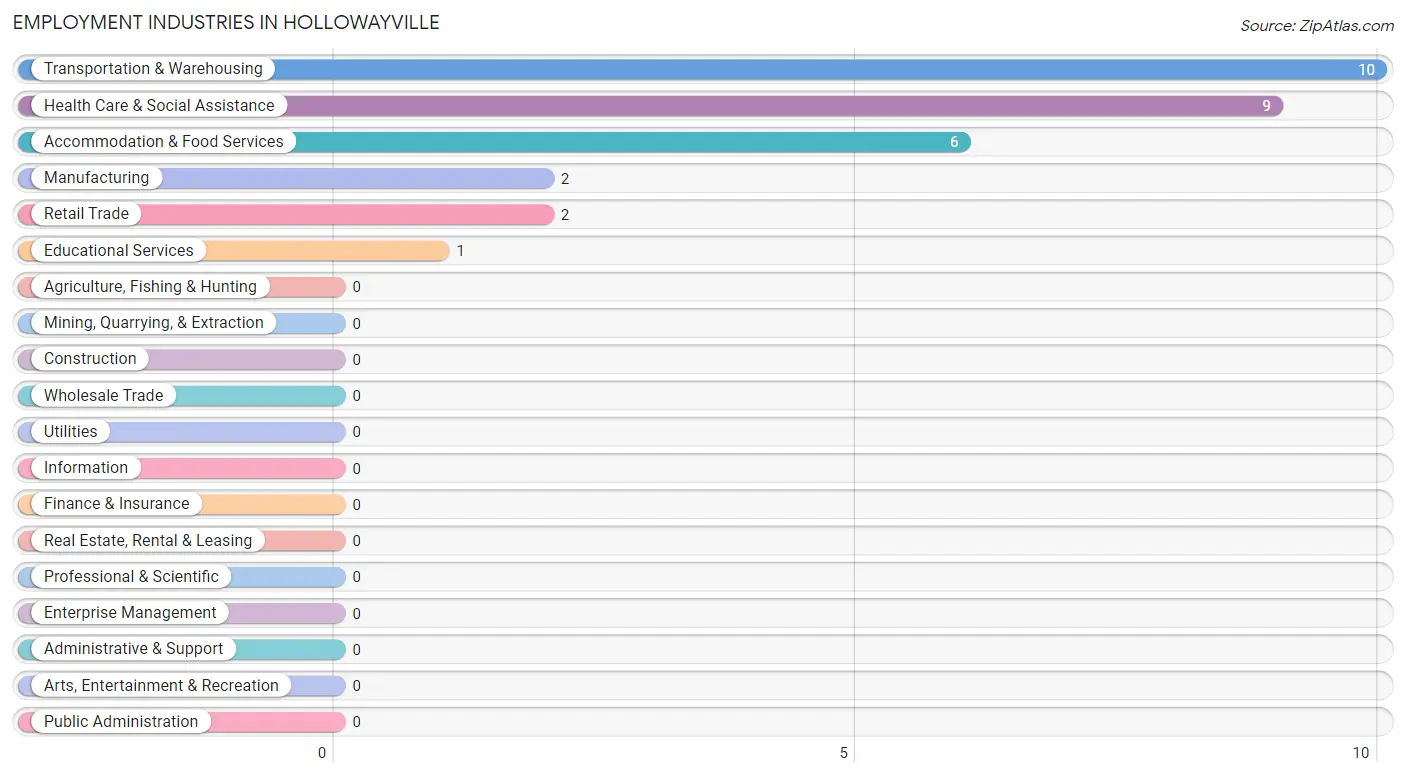
Employment Industries in Hollowayville
The major employment industries in Hollowayville include Transportation & Warehousing (10 | 33.3%), Health Care & Social Assistance (9 | 30.0%), Accommodation & Food Services (6 | 20.0%), Manufacturing (2 | 6.7%), and Retail Trade (2 | 6.7%).
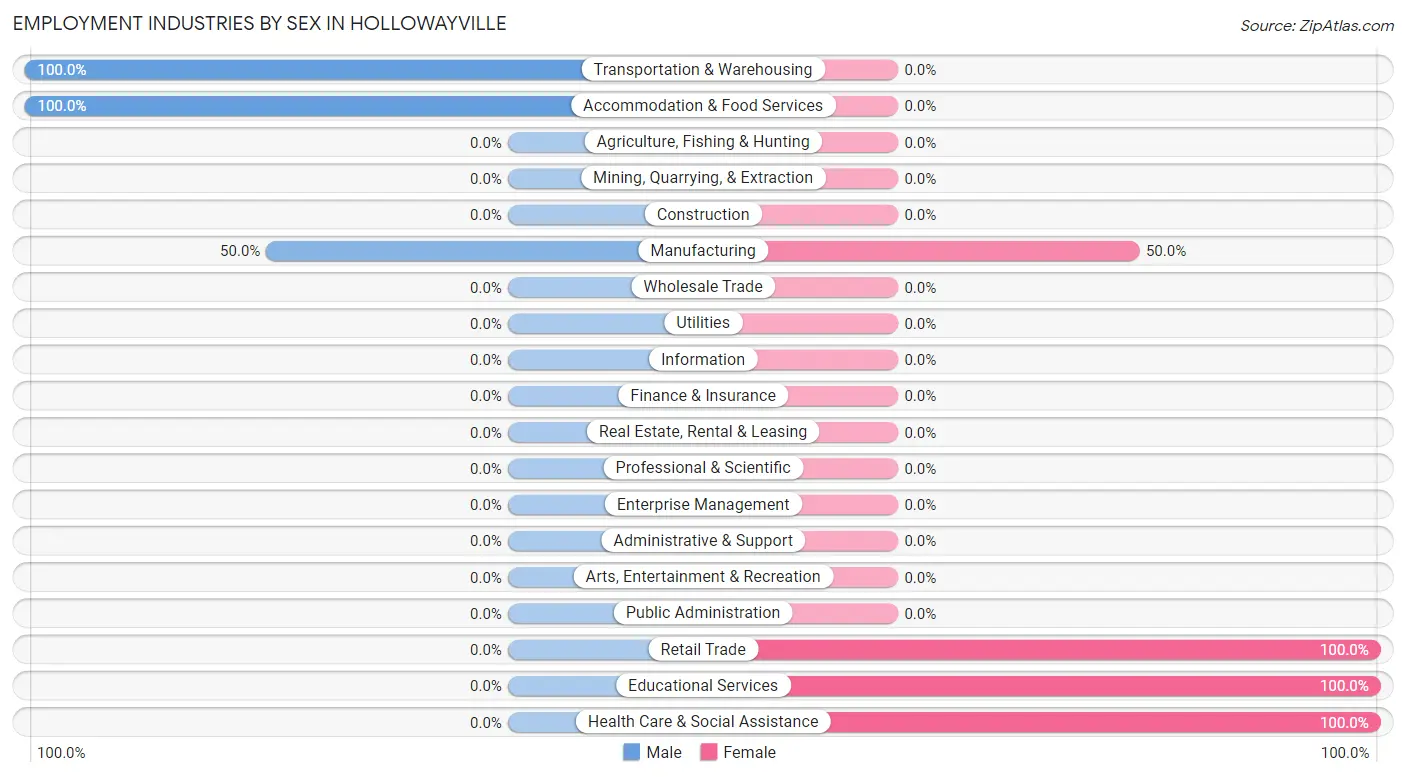
Employment Industries by Sex in Hollowayville
The Hollowayville industries that see more men than women are Transportation & Warehousing (100.0%), Accommodation & Food Services (100.0%), and Manufacturing (50.0%), whereas the industries that tend to have a higher number of women are Retail Trade (100.0%), Educational Services (100.0%), and Health Care & Social Assistance (100.0%).
| Industry | Male | Female |
| Agriculture, Fishing & Hunting | 0 (0.0%) | 0 (0.0%) |
| Mining, Quarrying, & Extraction | 0 (0.0%) | 0 (0.0%) |
| Construction | 0 (0.0%) | 0 (0.0%) |
| Manufacturing | 1 (50.0%) | 1 (50.0%) |
| Wholesale Trade | 0 (0.0%) | 0 (0.0%) |
| Retail Trade | 0 (0.0%) | 2 (100.0%) |
| Transportation & Warehousing | 10 (100.0%) | 0 (0.0%) |
| Utilities | 0 (0.0%) | 0 (0.0%) |
| Information | 0 (0.0%) | 0 (0.0%) |
| Finance & Insurance | 0 (0.0%) | 0 (0.0%) |
| Real Estate, Rental & Leasing | 0 (0.0%) | 0 (0.0%) |
| Professional & Scientific | 0 (0.0%) | 0 (0.0%) |
| Enterprise Management | 0 (0.0%) | 0 (0.0%) |
| Administrative & Support | 0 (0.0%) | 0 (0.0%) |
| Educational Services | 0 (0.0%) | 1 (100.0%) |
| Health Care & Social Assistance | 0 (0.0%) | 9 (100.0%) |
| Arts, Entertainment & Recreation | 0 (0.0%) | 0 (0.0%) |
| Accommodation & Food Services | 6 (100.0%) | 0 (0.0%) |
| Public Administration | 0 (0.0%) | 0 (0.0%) |
| Total | 17 (56.7%) | 13 (43.3%) |
Education in Hollowayville
School Enrollment in Hollowayville
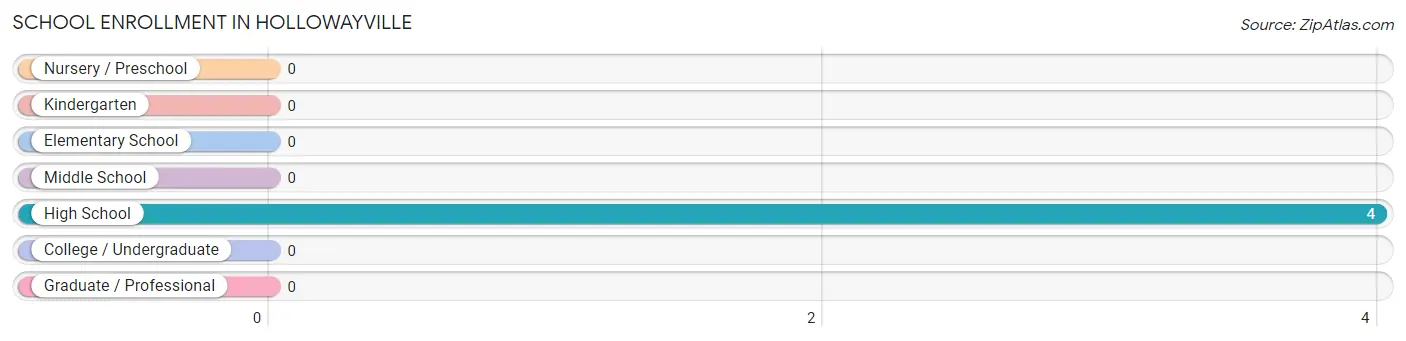
| School Level | # Students | % Students |
| Nursery / Preschool | 0 | 0.0% |
| Kindergarten | 0 | 0.0% |
| Elementary School | 0 | 0.0% |
| Middle School | 0 | 0.0% |
| High School | 4 | 100.0% |
| College / Undergraduate | 0 | 0.0% |
| Graduate / Professional | 0 | 0.0% |
| Total | 4 | 100.0% |
School Enrollment by Age by Funding Source in Hollowayville
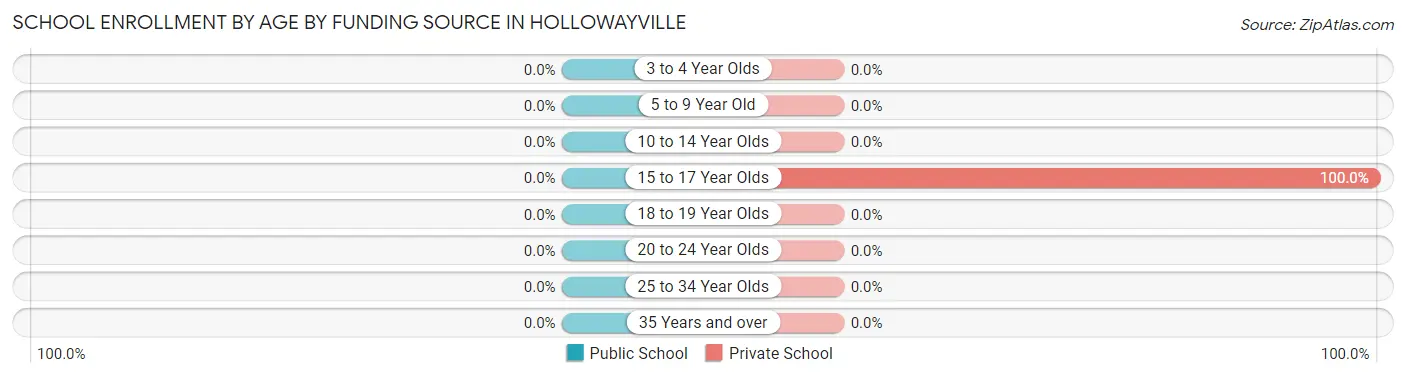
| Age Bracket | Public School | Private School |
| 3 to 4 Year Olds | 0 (0.0%) | 0 (0.0%) |
| 5 to 9 Year Old | 0 (0.0%) | 0 (0.0%) |
| 10 to 14 Year Olds | 0 (0.0%) | 0 (0.0%) |
| 15 to 17 Year Olds | 0 (0.0%) | 4 (100.0%) |
| 18 to 19 Year Olds | 0 (0.0%) | 0 (0.0%) |
| 20 to 24 Year Olds | 0 (0.0%) | 0 (0.0%) |
| 25 to 34 Year Olds | 0 (0.0%) | 0 (0.0%) |
| 35 Years and over | 0 (0.0%) | 0 (0.0%) |
| Total | 0 (0.0%) | 4 (100.0%) |
Educational Attainment by Field of Study in Hollowayville
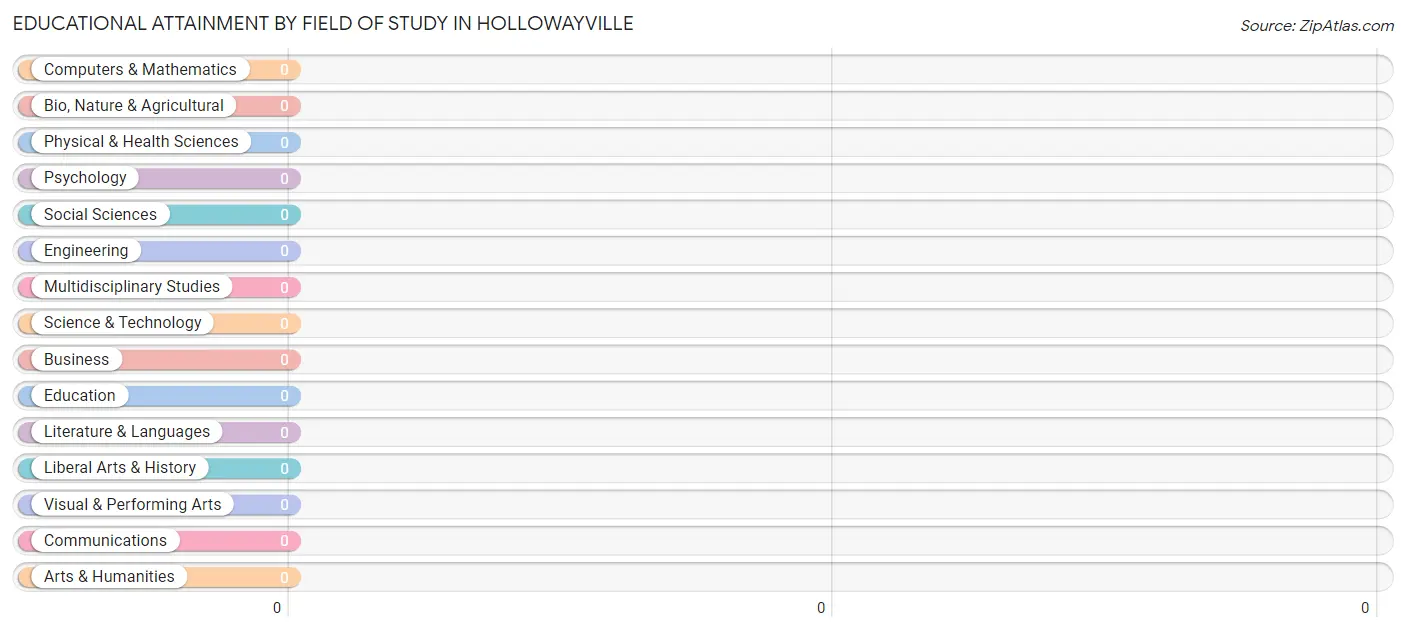
| Field of Study | # Graduates | % Graduates |
| Computers & Mathematics | 0 | 0.0% |
| Bio, Nature & Agricultural | 0 | 0.0% |
| Physical & Health Sciences | 0 | 0.0% |
| Psychology | 0 | 0.0% |
| Social Sciences | 0 | 0.0% |
| Engineering | 0 | 0.0% |
| Multidisciplinary Studies | 0 | 0.0% |
| Science & Technology | 0 | 0.0% |
| Business | 0 | 0.0% |
| Education | 0 | 0.0% |
| Literature & Languages | 0 | 0.0% |
| Liberal Arts & History | 0 | 0.0% |
| Visual & Performing Arts | 0 | 0.0% |
| Communications | 0 | 0.0% |
| Arts & Humanities | 0 | 0.0% |
| Total | 0 | 0.0% |
Transportation & Commute in Hollowayville
Vehicle Availability by Sex in Hollowayville
The most prevalent vehicle ownership categories in Hollowayville are males with 4 vehicles (9, accounting for 52.9%) and females with 4 vehicles (3, making up 69.2%).
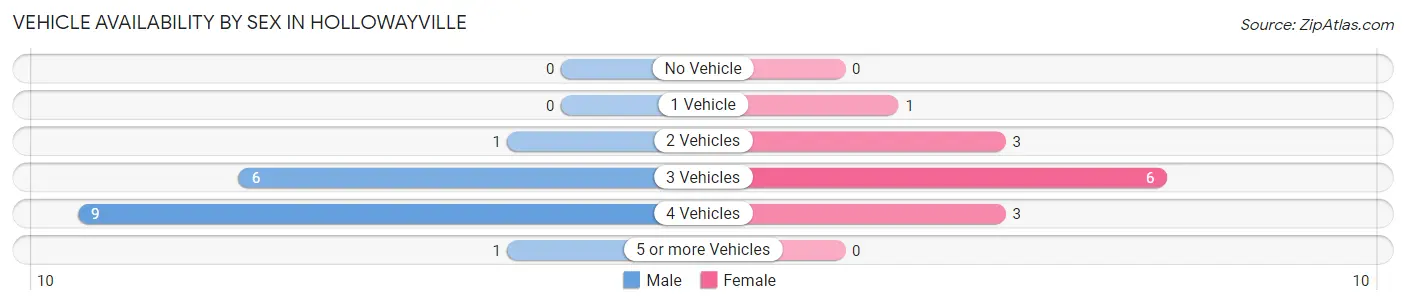
| Vehicles Available | Male | Female |
| No Vehicle | 0 (0.0%) | 0 (0.0%) |
| 1 Vehicle | 0 (0.0%) | 1 (7.7%) |
| 2 Vehicles | 1 (5.9%) | 3 (23.1%) |
| 3 Vehicles | 6 (35.3%) | 6 (46.2%) |
| 4 Vehicles | 9 (52.9%) | 3 (23.1%) |
| 5 or more Vehicles | 1 (5.9%) | 0 (0.0%) |
| Total | 17 (100.0%) | 13 (100.0%) |
Commute Time in Hollowayville
The most frequently occuring commute durations in Hollowayville are 10 to 14 minutes (10 commuters, 33.3%), 15 to 19 minutes (7 commuters, 23.3%), and 5 to 9 minutes (5 commuters, 16.7%).
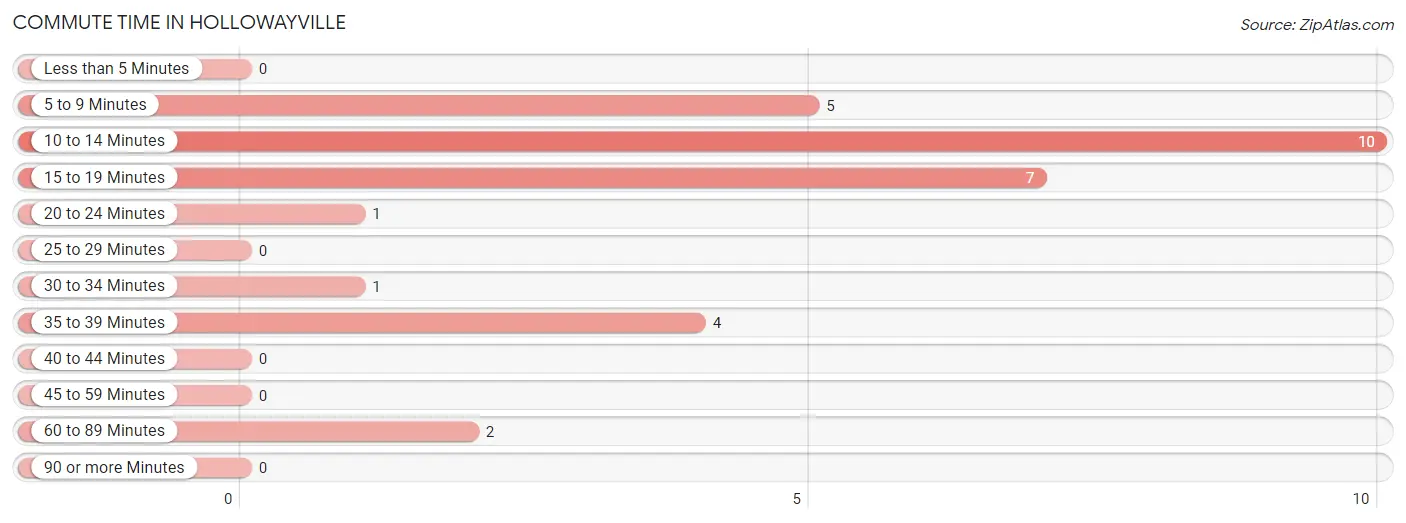
| Commute Time | # Commuters | % Commuters |
| Less than 5 Minutes | 0 | 0.0% |
| 5 to 9 Minutes | 5 | 16.7% |
| 10 to 14 Minutes | 10 | 33.3% |
| 15 to 19 Minutes | 7 | 23.3% |
| 20 to 24 Minutes | 1 | 3.3% |
| 25 to 29 Minutes | 0 | 0.0% |
| 30 to 34 Minutes | 1 | 3.3% |
| 35 to 39 Minutes | 4 | 13.3% |
| 40 to 44 Minutes | 0 | 0.0% |
| 45 to 59 Minutes | 0 | 0.0% |
| 60 to 89 Minutes | 2 | 6.7% |
| 90 or more Minutes | 0 | 0.0% |
Commute Time by Sex in Hollowayville
The most common commute times in Hollowayville are 10 to 14 minutes (10 commuters, 58.8%) for males and 15 to 19 minutes (7 commuters, 53.8%) for females.
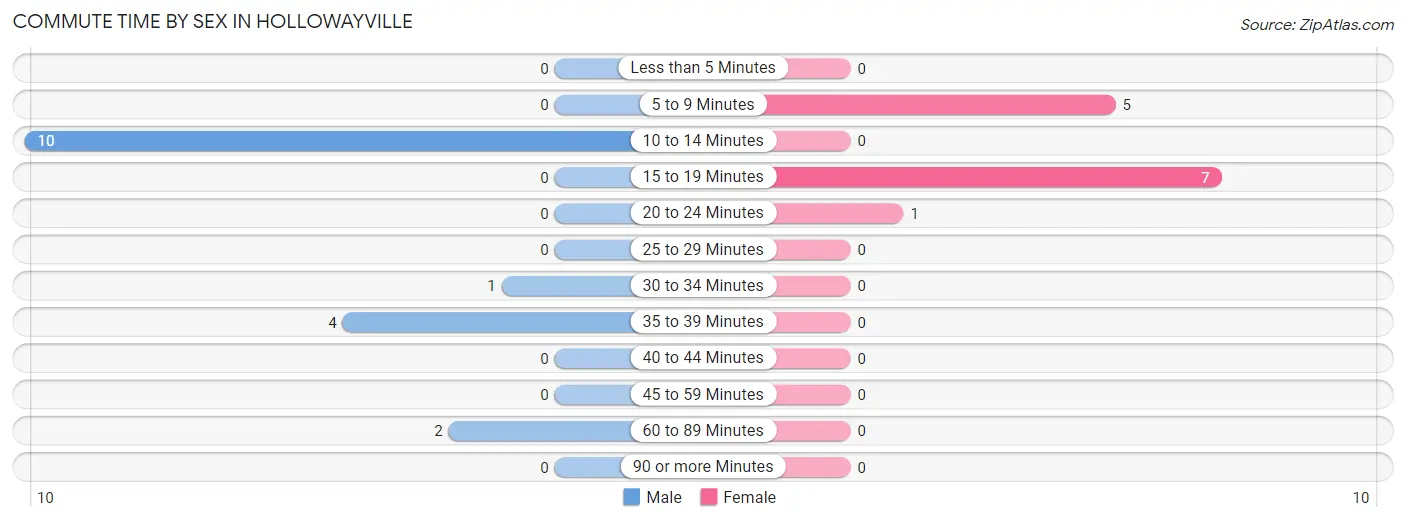
| Commute Time | Male | Female |
| Less than 5 Minutes | 0 (0.0%) | 0 (0.0%) |
| 5 to 9 Minutes | 0 (0.0%) | 5 (38.5%) |
| 10 to 14 Minutes | 10 (58.8%) | 0 (0.0%) |
| 15 to 19 Minutes | 0 (0.0%) | 7 (53.8%) |
| 20 to 24 Minutes | 0 (0.0%) | 1 (7.7%) |
| 25 to 29 Minutes | 0 (0.0%) | 0 (0.0%) |
| 30 to 34 Minutes | 1 (5.9%) | 0 (0.0%) |
| 35 to 39 Minutes | 4 (23.5%) | 0 (0.0%) |
| 40 to 44 Minutes | 0 (0.0%) | 0 (0.0%) |
| 45 to 59 Minutes | 0 (0.0%) | 0 (0.0%) |
| 60 to 89 Minutes | 2 (11.8%) | 0 (0.0%) |
| 90 or more Minutes | 0 (0.0%) | 0 (0.0%) |
Time of Departure to Work by Sex in Hollowayville
The most frequent times of departure to work in Hollowayville are 6:30 AM to 6:59 AM (6, 35.3%) for males and 7:00 AM to 7:29 AM (6, 46.2%) for females.
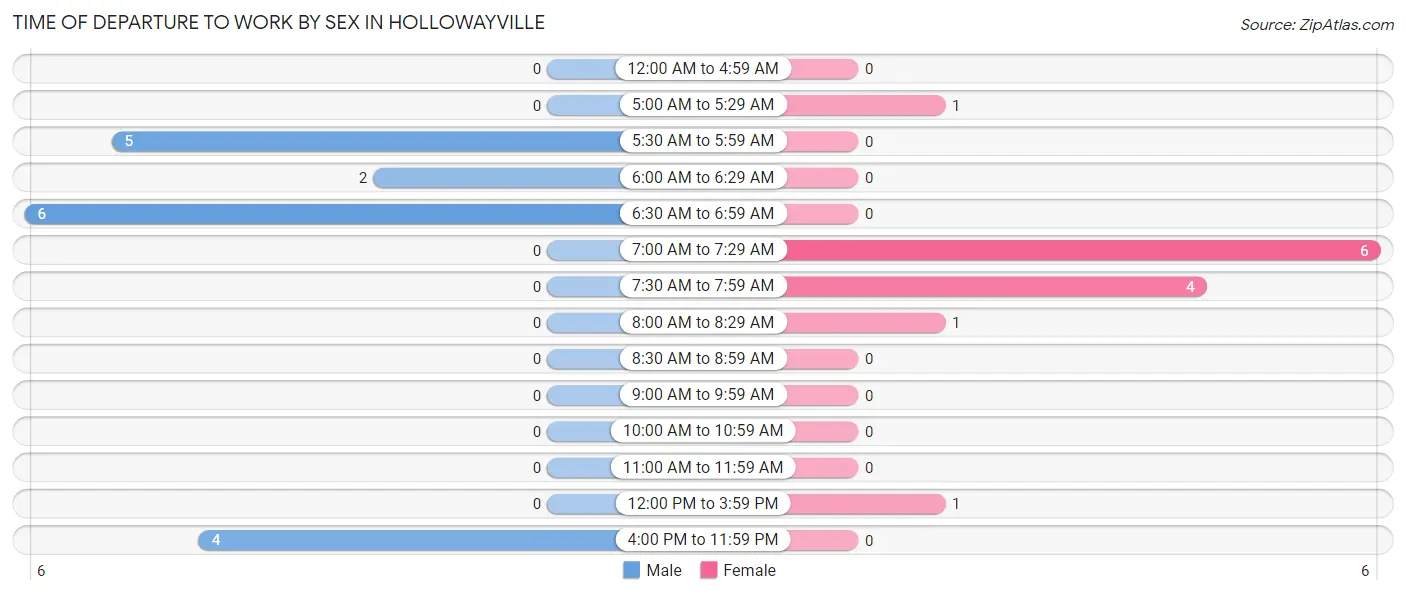
| Time of Departure | Male | Female |
| 12:00 AM to 4:59 AM | 0 (0.0%) | 0 (0.0%) |
| 5:00 AM to 5:29 AM | 0 (0.0%) | 1 (7.7%) |
| 5:30 AM to 5:59 AM | 5 (29.4%) | 0 (0.0%) |
| 6:00 AM to 6:29 AM | 2 (11.8%) | 0 (0.0%) |
| 6:30 AM to 6:59 AM | 6 (35.3%) | 0 (0.0%) |
| 7:00 AM to 7:29 AM | 0 (0.0%) | 6 (46.2%) |
| 7:30 AM to 7:59 AM | 0 (0.0%) | 4 (30.8%) |
| 8:00 AM to 8:29 AM | 0 (0.0%) | 1 (7.7%) |
| 8:30 AM to 8:59 AM | 0 (0.0%) | 0 (0.0%) |
| 9:00 AM to 9:59 AM | 0 (0.0%) | 0 (0.0%) |
| 10:00 AM to 10:59 AM | 0 (0.0%) | 0 (0.0%) |
| 11:00 AM to 11:59 AM | 0 (0.0%) | 0 (0.0%) |
| 12:00 PM to 3:59 PM | 0 (0.0%) | 1 (7.7%) |
| 4:00 PM to 11:59 PM | 4 (23.5%) | 0 (0.0%) |
| Total | 17 (100.0%) | 13 (100.0%) |
Housing Occupancy in Hollowayville
Occupancy by Ownership in Hollowayville
Of the total 17 dwellings in Hollowayville, owner-occupied units account for 14 (82.4%), while renter-occupied units make up 3 (17.6%).
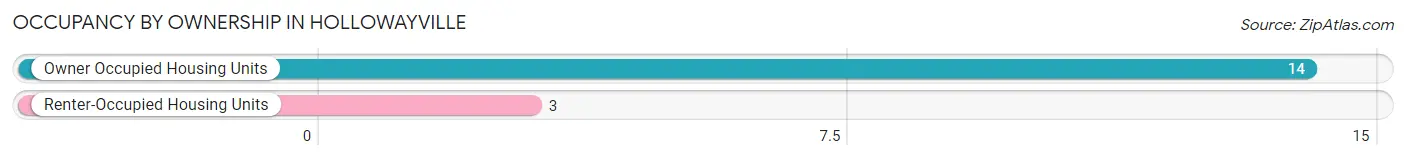
| Occupancy | # Housing Units | % Housing Units |
| Owner Occupied Housing Units | 14 | 82.4% |
| Renter-Occupied Housing Units | 3 | 17.6% |
| Total Occupied Housing Units | 17 | 100.0% |
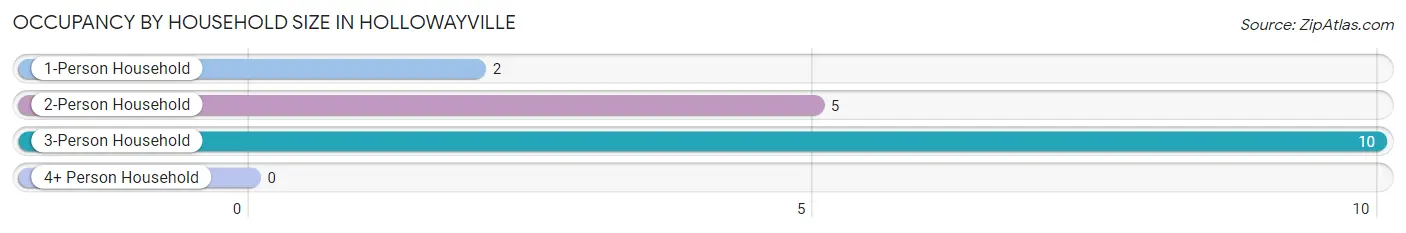
Occupancy by Household Size in Hollowayville
| Household Size | # Housing Units | % Housing Units |
| 1-Person Household | 2 | 11.8% |
| 2-Person Household | 5 | 29.4% |
| 3-Person Household | 10 | 58.8% |
| 4+ Person Household | 0 | 0.0% |
| Total Housing Units | 17 | 100.0% |
Occupancy by Ownership by Household Size in Hollowayville
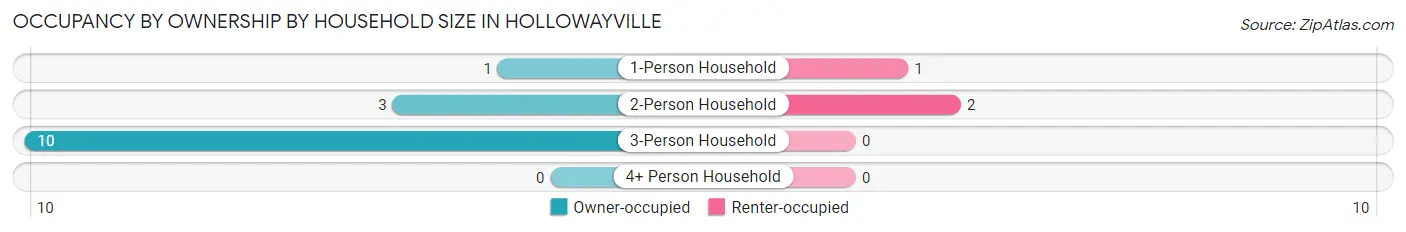
| Household Size | Owner-occupied | Renter-occupied |
| 1-Person Household | 1 (50.0%) | 1 (50.0%) |
| 2-Person Household | 3 (60.0%) | 2 (40.0%) |
| 3-Person Household | 10 (100.0%) | 0 (0.0%) |
| 4+ Person Household | 0 (0.0%) | 0 (0.0%) |
| Total Housing Units | 14 (82.4%) | 3 (17.6%) |
Occupancy by Educational Attainment in Hollowayville
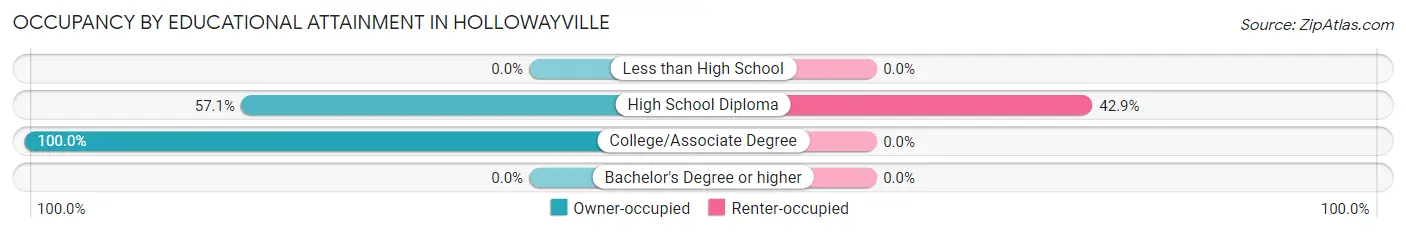
| Household Size | Owner-occupied | Renter-occupied |
| Less than High School | 0 (0.0%) | 0 (0.0%) |
| High School Diploma | 4 (57.1%) | 3 (42.9%) |
| College/Associate Degree | 10 (100.0%) | 0 (0.0%) |
| Bachelor's Degree or higher | 0 (0.0%) | 0 (0.0%) |
Occupancy by Age of Householder in Hollowayville
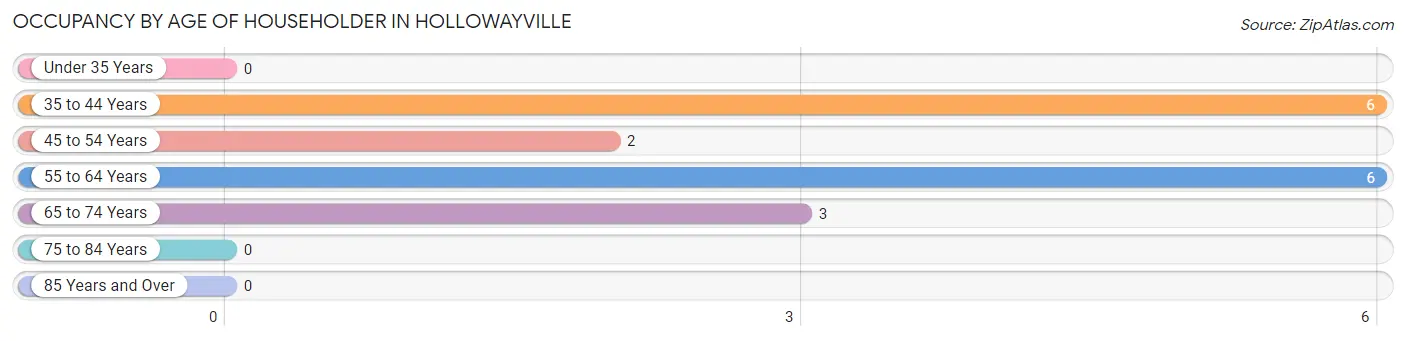
| Age Bracket | # Households | % Households |
| Under 35 Years | 0 | 0.0% |
| 35 to 44 Years | 6 | 35.3% |
| 45 to 54 Years | 2 | 11.8% |
| 55 to 64 Years | 6 | 35.3% |
| 65 to 74 Years | 3 | 17.6% |
| 75 to 84 Years | 0 | 0.0% |
| 85 Years and Over | 0 | 0.0% |
| Total | 17 | 100.0% |
Housing Finances in Hollowayville
Median Income by Occupancy in Hollowayville
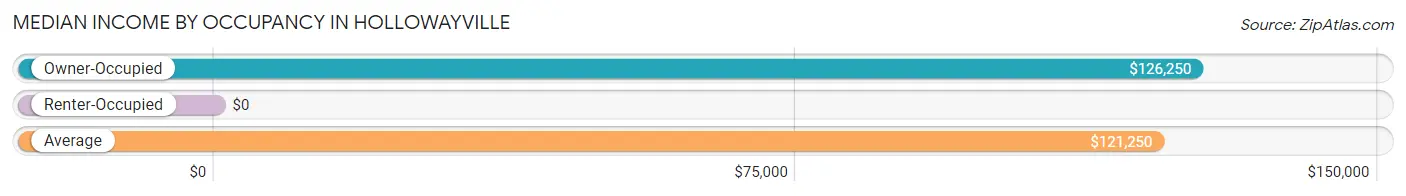
| Occupancy Type | # Households | Median Income |
| Owner-Occupied | 14 (82.4%) | $126,250 |
| Renter-Occupied | 3 (17.6%) | $0 |
| Average | 17 (100.0%) | $121,250 |
Occupancy by Householder Income Bracket in Hollowayville
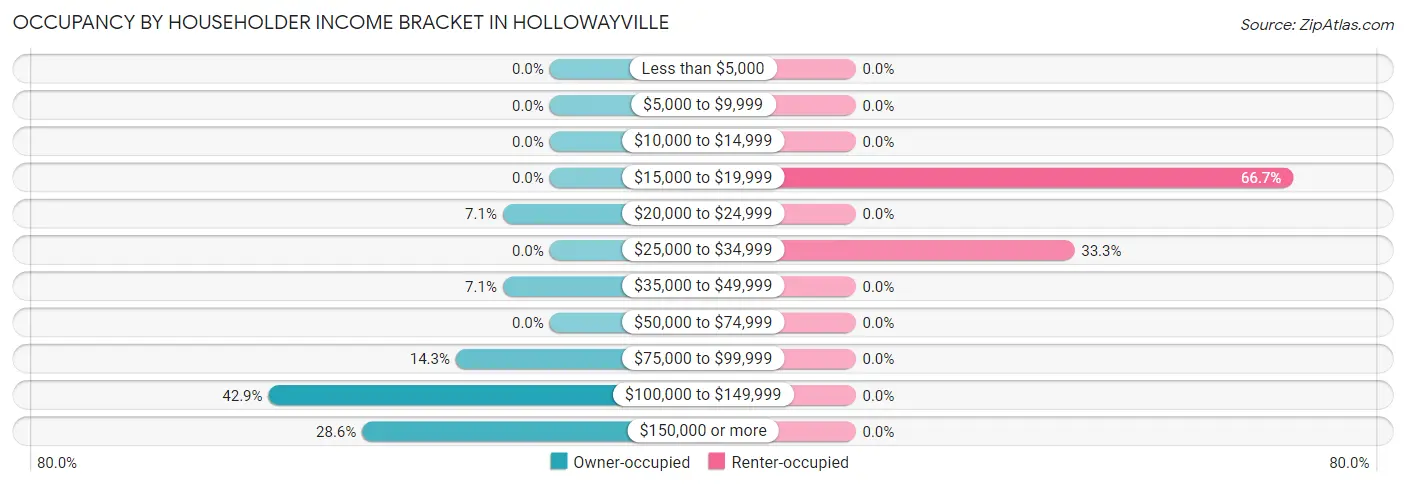
| Income Bracket | Owner-occupied | Renter-occupied |
| Less than $5,000 | 0 (0.0%) | 0 (0.0%) |
| $5,000 to $9,999 | 0 (0.0%) | 0 (0.0%) |
| $10,000 to $14,999 | 0 (0.0%) | 0 (0.0%) |
| $15,000 to $19,999 | 0 (0.0%) | 2 (66.7%) |
| $20,000 to $24,999 | 1 (7.1%) | 0 (0.0%) |
| $25,000 to $34,999 | 0 (0.0%) | 1 (33.3%) |
| $35,000 to $49,999 | 1 (7.1%) | 0 (0.0%) |
| $50,000 to $74,999 | 0 (0.0%) | 0 (0.0%) |
| $75,000 to $99,999 | 2 (14.3%) | 0 (0.0%) |
| $100,000 to $149,999 | 6 (42.9%) | 0 (0.0%) |
| $150,000 or more | 4 (28.6%) | 0 (0.0%) |
| Total | 14 (100.0%) | 3 (100.0%) |
Monthly Housing Cost Tiers in Hollowayville
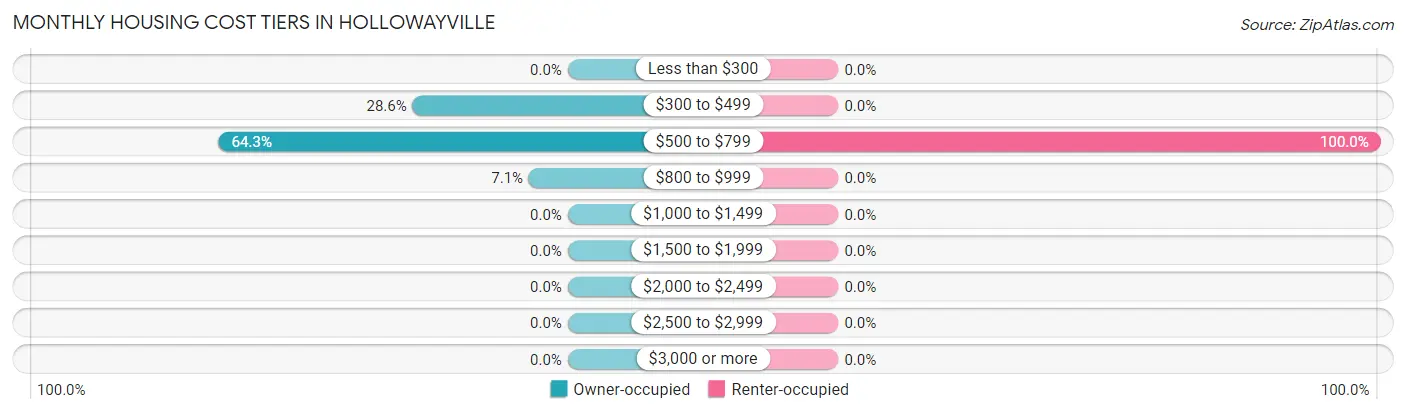
| Monthly Cost | Owner-occupied | Renter-occupied |
| Less than $300 | 0 (0.0%) | 0 (0.0%) |
| $300 to $499 | 4 (28.6%) | 0 (0.0%) |
| $500 to $799 | 9 (64.3%) | 3 (100.0%) |
| $800 to $999 | 1 (7.1%) | 0 (0.0%) |
| $1,000 to $1,499 | 0 (0.0%) | 0 (0.0%) |
| $1,500 to $1,999 | 0 (0.0%) | 0 (0.0%) |
| $2,000 to $2,499 | 0 (0.0%) | 0 (0.0%) |
| $2,500 to $2,999 | 0 (0.0%) | 0 (0.0%) |
| $3,000 or more | 0 (0.0%) | 0 (0.0%) |
| Total | 14 (100.0%) | 3 (100.0%) |
Physical Housing Characteristics in Hollowayville
Housing Structures in Hollowayville
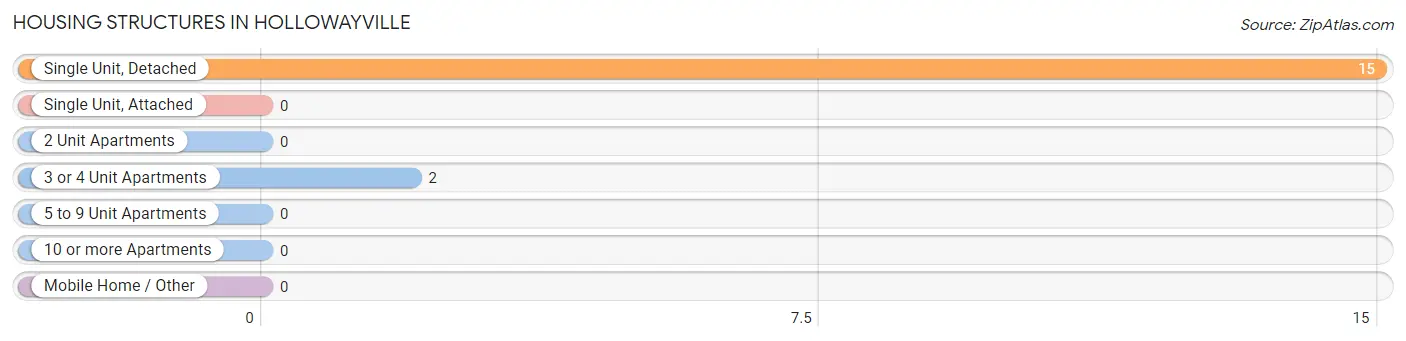
| Structure Type | # Housing Units | % Housing Units |
| Single Unit, Detached | 15 | 88.2% |
| Single Unit, Attached | 0 | 0.0% |
| 2 Unit Apartments | 0 | 0.0% |
| 3 or 4 Unit Apartments | 2 | 11.8% |
| 5 to 9 Unit Apartments | 0 | 0.0% |
| 10 or more Apartments | 0 | 0.0% |
| Mobile Home / Other | 0 | 0.0% |
| Total | 17 | 100.0% |
Housing Structures by Occupancy in Hollowayville
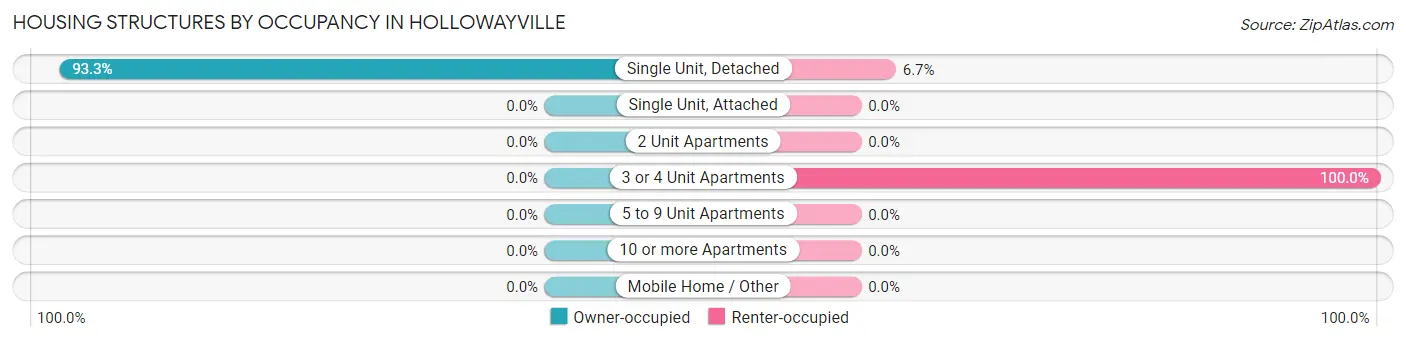
| Structure Type | Owner-occupied | Renter-occupied |
| Single Unit, Detached | 14 (93.3%) | 1 (6.7%) |
| Single Unit, Attached | 0 (0.0%) | 0 (0.0%) |
| 2 Unit Apartments | 0 (0.0%) | 0 (0.0%) |
| 3 or 4 Unit Apartments | 0 (0.0%) | 2 (100.0%) |
| 5 to 9 Unit Apartments | 0 (0.0%) | 0 (0.0%) |
| 10 or more Apartments | 0 (0.0%) | 0 (0.0%) |
| Mobile Home / Other | 0 (0.0%) | 0 (0.0%) |
| Total | 14 (82.4%) | 3 (17.6%) |
Housing Structures by Number of Rooms in Hollowayville
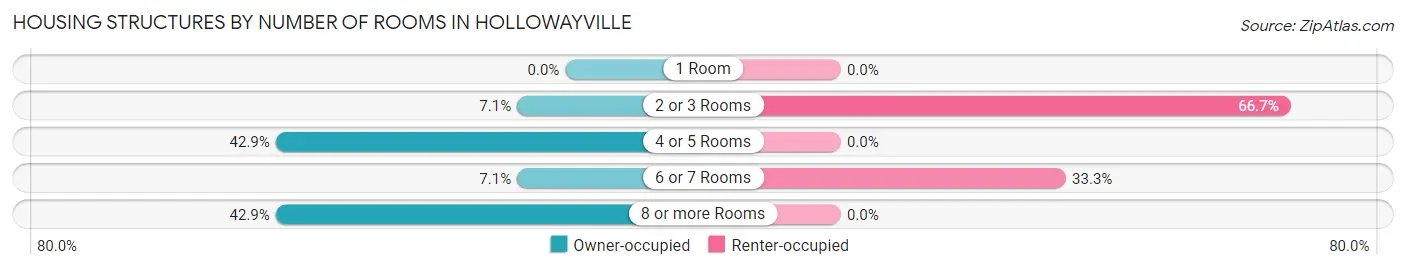
| Number of Rooms | Owner-occupied | Renter-occupied |
| 1 Room | 0 (0.0%) | 0 (0.0%) |
| 2 or 3 Rooms | 1 (7.1%) | 2 (66.7%) |
| 4 or 5 Rooms | 6 (42.9%) | 0 (0.0%) |
| 6 or 7 Rooms | 1 (7.1%) | 1 (33.3%) |
| 8 or more Rooms | 6 (42.9%) | 0 (0.0%) |
| Total | 14 (100.0%) | 3 (100.0%) |
Housing Structure by Heating Type in Hollowayville
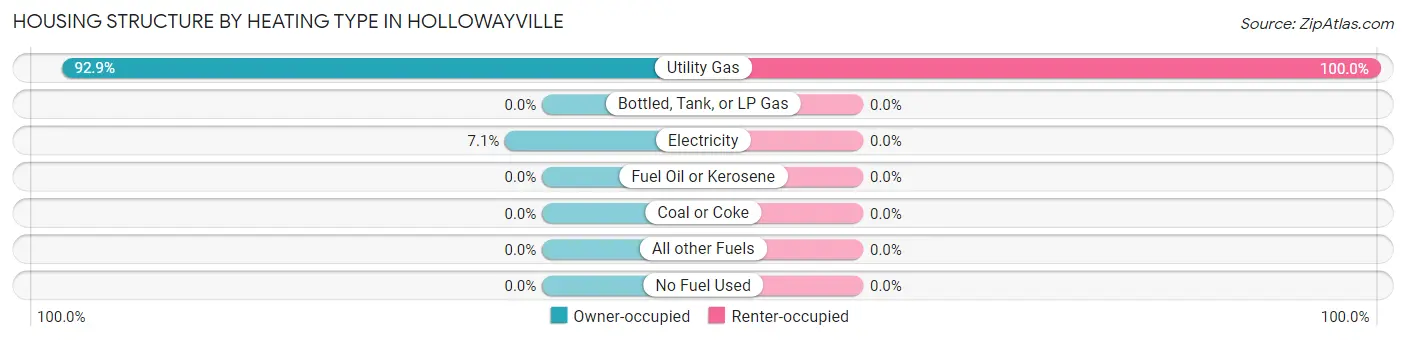
| Heating Type | Owner-occupied | Renter-occupied |
| Utility Gas | 13 (92.9%) | 3 (100.0%) |
| Bottled, Tank, or LP Gas | 0 (0.0%) | 0 (0.0%) |
| Electricity | 1 (7.1%) | 0 (0.0%) |
| Fuel Oil or Kerosene | 0 (0.0%) | 0 (0.0%) |
| Coal or Coke | 0 (0.0%) | 0 (0.0%) |
| All other Fuels | 0 (0.0%) | 0 (0.0%) |
| No Fuel Used | 0 (0.0%) | 0 (0.0%) |
| Total | 14 (100.0%) | 3 (100.0%) |
Household Vehicle Usage in Hollowayville
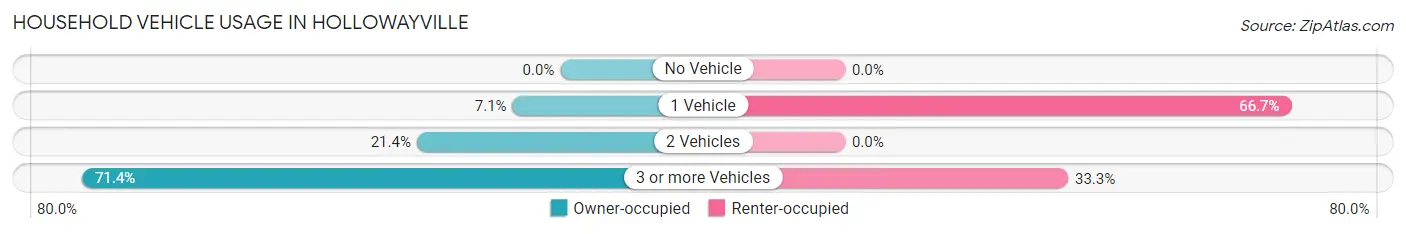
| Vehicles per Household | Owner-occupied | Renter-occupied |
| No Vehicle | 0 (0.0%) | 0 (0.0%) |
| 1 Vehicle | 1 (7.1%) | 2 (66.7%) |
| 2 Vehicles | 3 (21.4%) | 0 (0.0%) |
| 3 or more Vehicles | 10 (71.4%) | 1 (33.3%) |
| Total | 14 (100.0%) | 3 (100.0%) |
Real Estate & Mortgages in Hollowayville
Real Estate and Mortgage Overview in Hollowayville
| Characteristic | Without Mortgage | With Mortgage |
| Housing Units | 13 | 1 |
| Median Property Value | $45,000 | $0 |
| Median Household Income | $130,417 | $0 |
| Monthly Housing Costs | $563 | $0 |
| Real Estate Taxes | $1,821 | $0 |
Property Value by Mortgage Status in Hollowayville
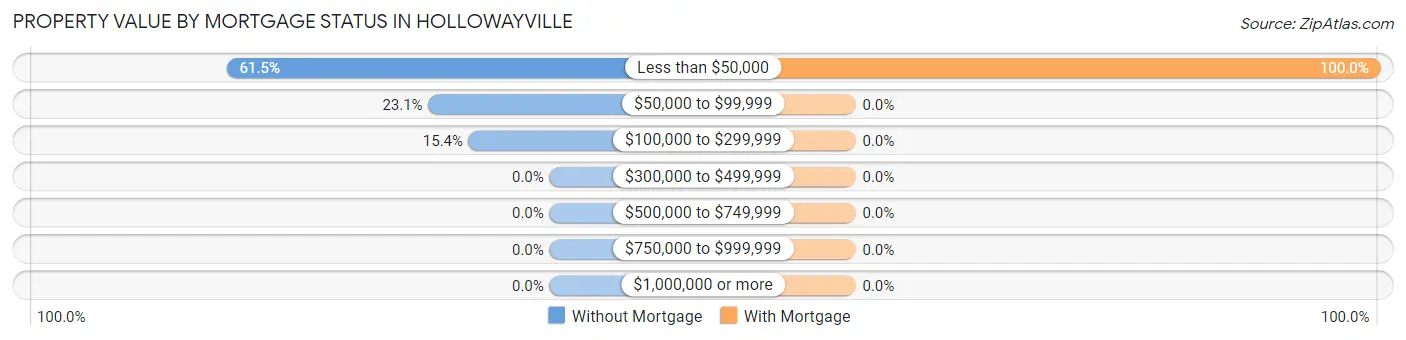
| Property Value | Without Mortgage | With Mortgage |
| Less than $50,000 | 8 (61.5%) | 1 (100.0%) |
| $50,000 to $99,999 | 3 (23.1%) | 0 (0.0%) |
| $100,000 to $299,999 | 2 (15.4%) | 0 (0.0%) |
| $300,000 to $499,999 | 0 (0.0%) | 0 (0.0%) |
| $500,000 to $749,999 | 0 (0.0%) | 0 (0.0%) |
| $750,000 to $999,999 | 0 (0.0%) | 0 (0.0%) |
| $1,000,000 or more | 0 (0.0%) | 0 (0.0%) |
| Total | 13 (100.0%) | 1 (100.0%) |
Household Income by Mortgage Status in Hollowayville
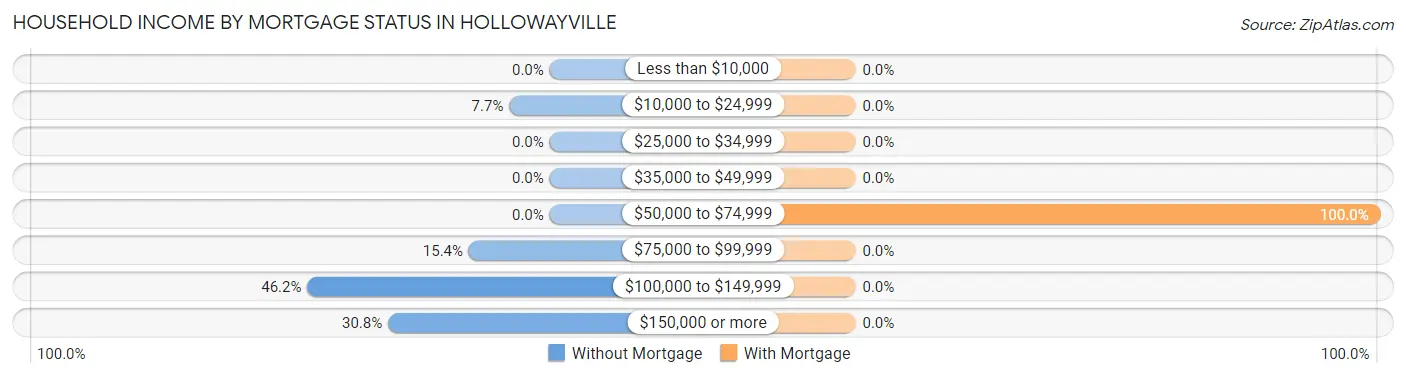
| Household Income | Without Mortgage | With Mortgage |
| Less than $10,000 | 0 (0.0%) | 0 (0.0%) |
| $10,000 to $24,999 | 1 (7.7%) | 0 (0.0%) |
| $25,000 to $34,999 | 0 (0.0%) | 0 (0.0%) |
| $35,000 to $49,999 | 0 (0.0%) | 0 (0.0%) |
| $50,000 to $74,999 | 0 (0.0%) | 1 (100.0%) |
| $75,000 to $99,999 | 2 (15.4%) | 0 (0.0%) |
| $100,000 to $149,999 | 6 (46.2%) | 0 (0.0%) |
| $150,000 or more | 4 (30.8%) | 0 (0.0%) |
| Total | 13 (100.0%) | 1 (100.0%) |
Property Value to Household Income Ratio in Hollowayville
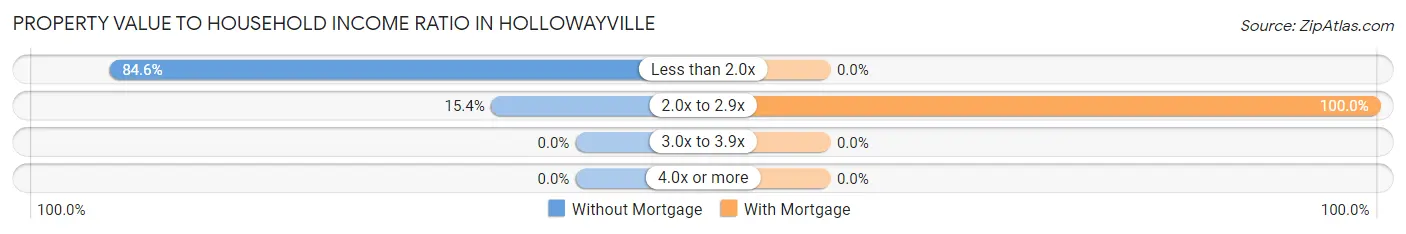
| Value-to-Income Ratio | Without Mortgage | With Mortgage |
| Less than 2.0x | 11 (84.6%) | 0 (0.0%) |
| 2.0x to 2.9x | 2 (15.4%) | 1 (100.0%) |
| 3.0x to 3.9x | 0 (0.0%) | 0 (0.0%) |
| 4.0x or more | 0 (0.0%) | 0 (0.0%) |
| Total | 13 (100.0%) | 1 (100.0%) |
Real Estate Taxes by Mortgage Status in Hollowayville
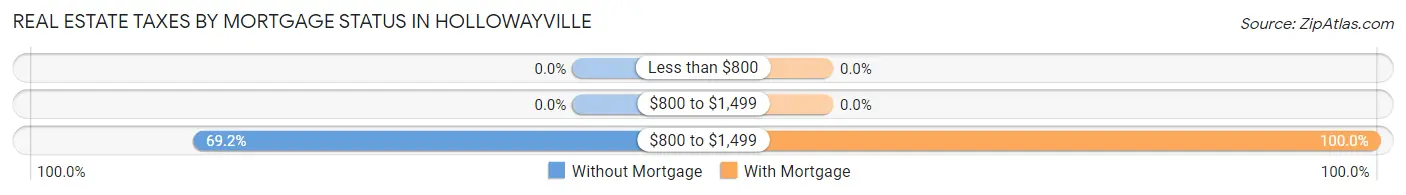
| Property Taxes | Without Mortgage | With Mortgage |
| Less than $800 | 0 (0.0%) | 0 (0.0%) |
| $800 to $1,499 | 0 (0.0%) | 0 (0.0%) |
| $800 to $1,499 | 9 (69.2%) | 1 (100.0%) |
| Total | 13 (100.0%) | 1 (100.0%) |
Health & Disability in Hollowayville
Health Insurance Coverage by Age in Hollowayville
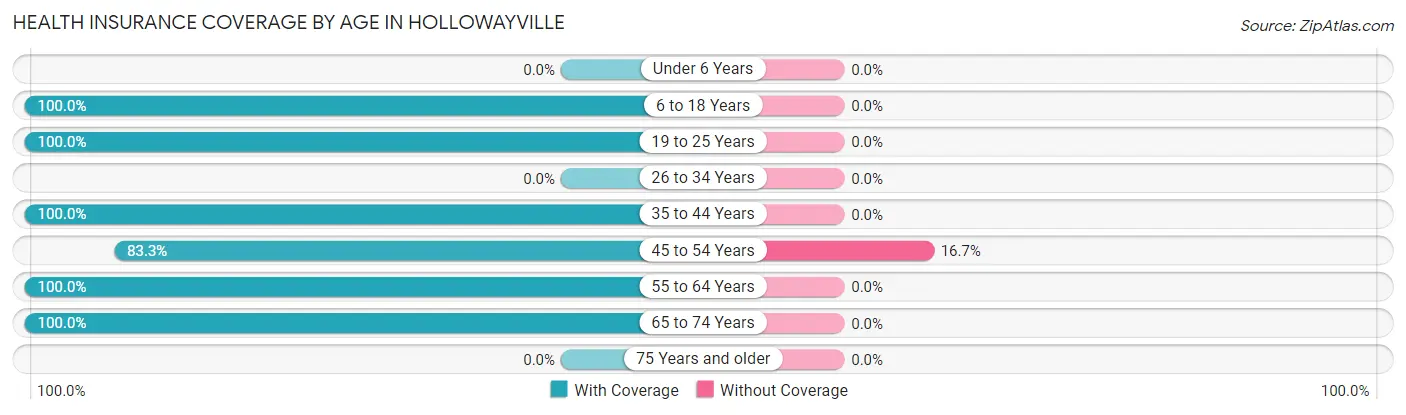
| Age Bracket | With Coverage | Without Coverage |
| Under 6 Years | 0 (0.0%) | 0 (0.0%) |
| 6 to 18 Years | 4 (100.0%) | 0 (0.0%) |
| 19 to 25 Years | 5 (100.0%) | 0 (0.0%) |
| 26 to 34 Years | 0 (0.0%) | 0 (0.0%) |
| 35 to 44 Years | 9 (100.0%) | 0 (0.0%) |
| 45 to 54 Years | 10 (83.3%) | 2 (16.7%) |
| 55 to 64 Years | 8 (100.0%) | 0 (0.0%) |
| 65 to 74 Years | 3 (100.0%) | 0 (0.0%) |
| 75 Years and older | 0 (0.0%) | 0 (0.0%) |
| Total | 39 (95.1%) | 2 (4.9%) |
Health Insurance Coverage by Citizenship Status in Hollowayville
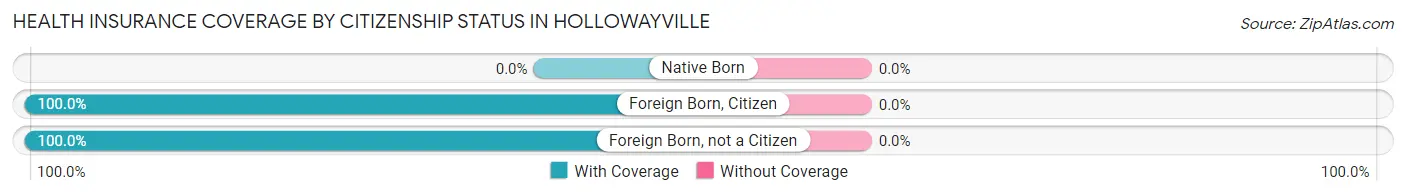
| Citizenship Status | With Coverage | Without Coverage |
| Native Born | 0 (0.0%) | 0 (0.0%) |
| Foreign Born, Citizen | 4 (100.0%) | 0 (0.0%) |
| Foreign Born, not a Citizen | 5 (100.0%) | 0 (0.0%) |
Health Insurance Coverage by Household Income in Hollowayville
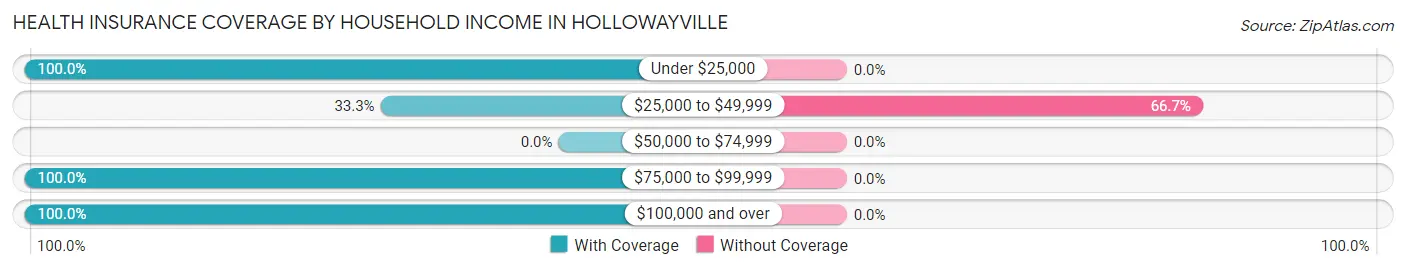
| Household Income | With Coverage | Without Coverage |
| Under $25,000 | 6 (100.0%) | 0 (0.0%) |
| $25,000 to $49,999 | 1 (33.3%) | 2 (66.7%) |
| $50,000 to $74,999 | 0 (0.0%) | 0 (0.0%) |
| $75,000 to $99,999 | 4 (100.0%) | 0 (0.0%) |
| $100,000 and over | 28 (100.0%) | 0 (0.0%) |
Public vs Private Health Insurance Coverage by Age in Hollowayville
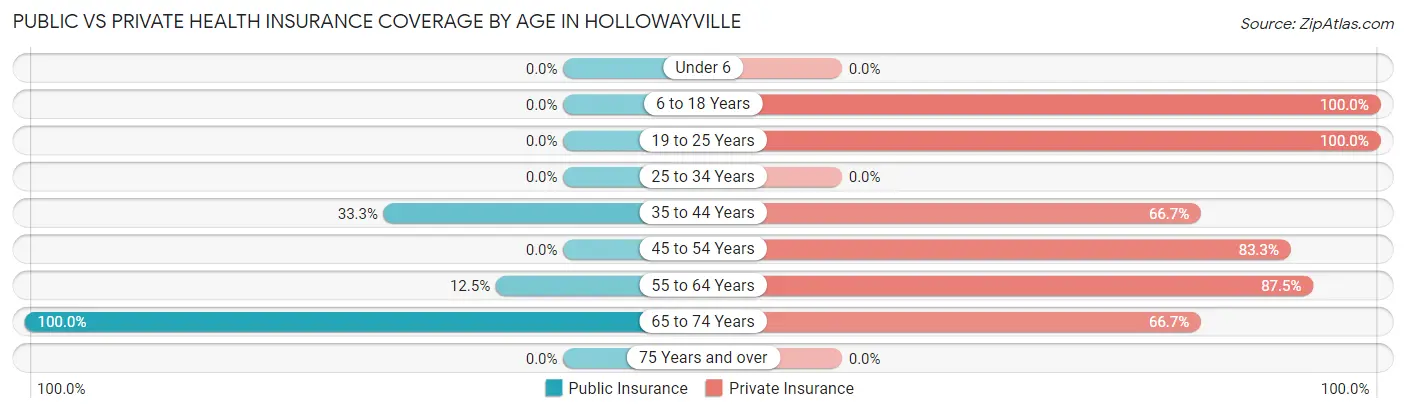
| Age Bracket | Public Insurance | Private Insurance |
| Under 6 | 0 (0.0%) | 0 (0.0%) |
| 6 to 18 Years | 0 (0.0%) | 4 (100.0%) |
| 19 to 25 Years | 0 (0.0%) | 5 (100.0%) |
| 25 to 34 Years | 0 (0.0%) | 0 (0.0%) |
| 35 to 44 Years | 3 (33.3%) | 6 (66.7%) |
| 45 to 54 Years | 0 (0.0%) | 10 (83.3%) |
| 55 to 64 Years | 1 (12.5%) | 7 (87.5%) |
| 65 to 74 Years | 3 (100.0%) | 2 (66.7%) |
| 75 Years and over | 0 (0.0%) | 0 (0.0%) |
| Total | 7 (17.1%) | 34 (82.9%) |
Disability Status by Sex by Age in Hollowayville
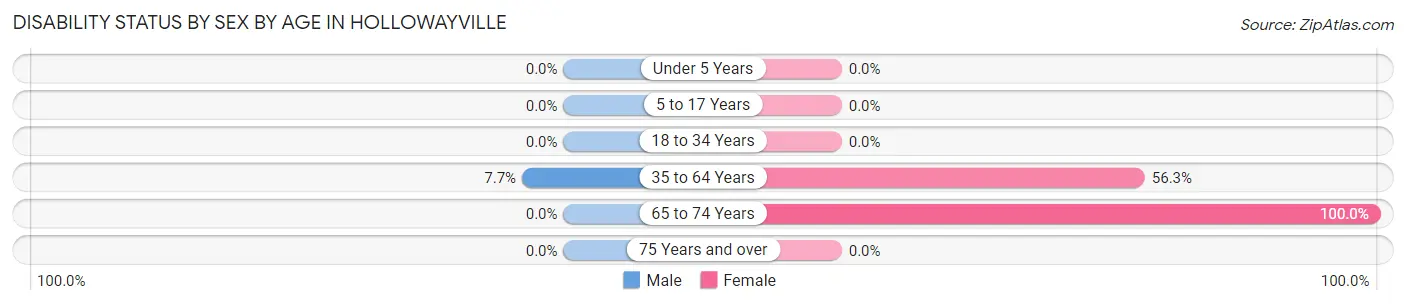
| Age Bracket | Male | Female |
| Under 5 Years | 0 (0.0%) | 0 (0.0%) |
| 5 to 17 Years | 0 (0.0%) | 0 (0.0%) |
| 18 to 34 Years | 0 (0.0%) | 0 (0.0%) |
| 35 to 64 Years | 1 (7.7%) | 9 (56.2%) |
| 65 to 74 Years | 0 (0.0%) | 2 (100.0%) |
| 75 Years and over | 0 (0.0%) | 0 (0.0%) |
Disability Class by Sex by Age in Hollowayville
Disability Class: Hearing Difficulty
| Age Bracket | Male | Female |
| Under 5 Years | 0 (0.0%) | 0 (0.0%) |
| 5 to 17 Years | 0 (0.0%) | 0 (0.0%) |
| 18 to 34 Years | 0 (0.0%) | 0 (0.0%) |
| 35 to 64 Years | 0 (0.0%) | 0 (0.0%) |
| 65 to 74 Years | 0 (0.0%) | 0 (0.0%) |
| 75 Years and over | 0 (0.0%) | 0 (0.0%) |
Disability Class: Vision Difficulty
| Age Bracket | Male | Female |
| Under 5 Years | 0 (0.0%) | 0 (0.0%) |
| 5 to 17 Years | 0 (0.0%) | 0 (0.0%) |
| 18 to 34 Years | 0 (0.0%) | 0 (0.0%) |
| 35 to 64 Years | 0 (0.0%) | 0 (0.0%) |
| 65 to 74 Years | 0 (0.0%) | 0 (0.0%) |
| 75 Years and over | 0 (0.0%) | 0 (0.0%) |
Disability Class: Cognitive Difficulty
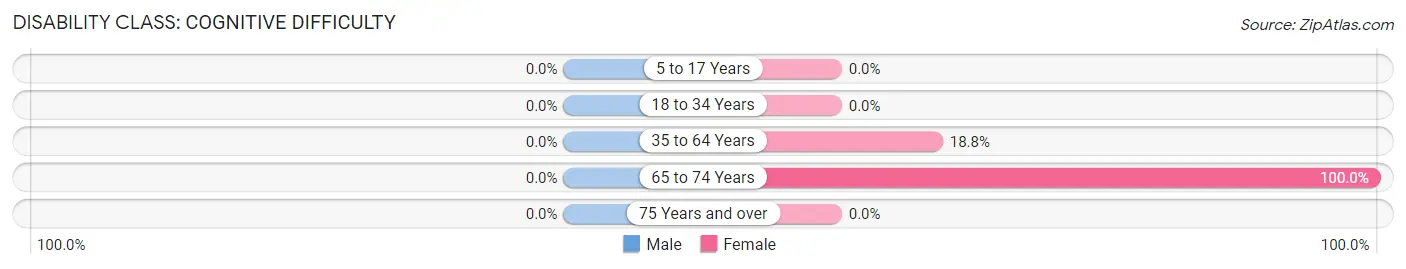
| Age Bracket | Male | Female |
| 5 to 17 Years | 0 (0.0%) | 0 (0.0%) |
| 18 to 34 Years | 0 (0.0%) | 0 (0.0%) |
| 35 to 64 Years | 0 (0.0%) | 3 (18.8%) |
| 65 to 74 Years | 0 (0.0%) | 2 (100.0%) |
| 75 Years and over | 0 (0.0%) | 0 (0.0%) |
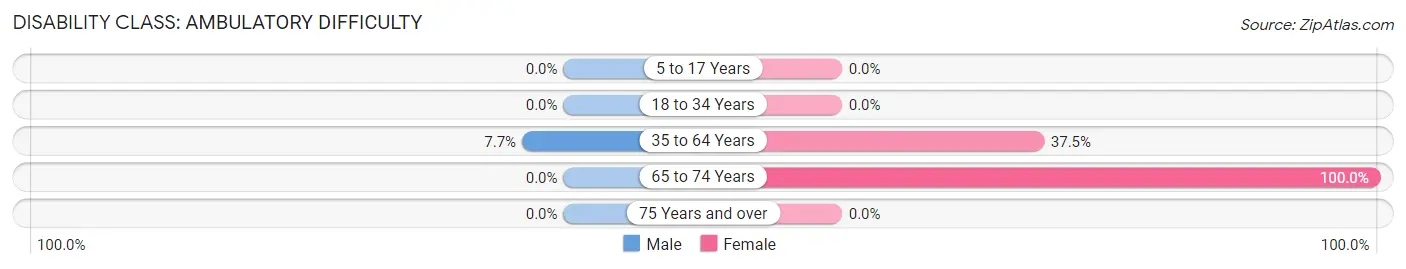
Disability Class: Ambulatory Difficulty
| Age Bracket | Male | Female |
| 5 to 17 Years | 0 (0.0%) | 0 (0.0%) |
| 18 to 34 Years | 0 (0.0%) | 0 (0.0%) |
| 35 to 64 Years | 1 (7.7%) | 6 (37.5%) |
| 65 to 74 Years | 0 (0.0%) | 2 (100.0%) |
| 75 Years and over | 0 (0.0%) | 0 (0.0%) |
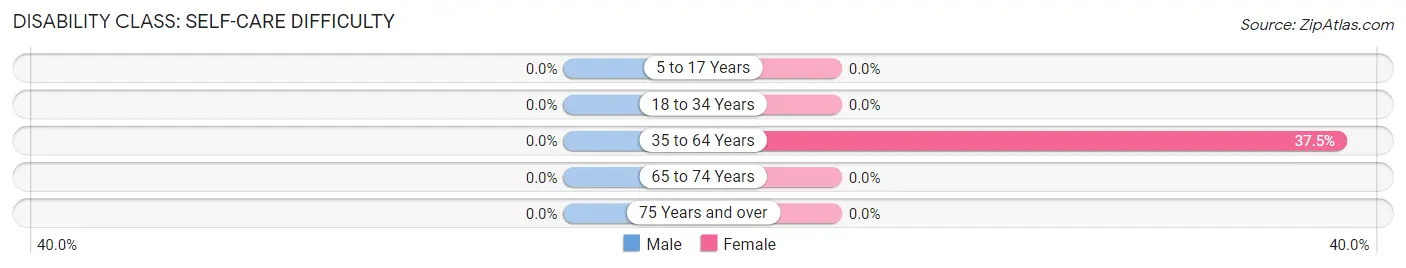
Disability Class: Self-Care Difficulty
| Age Bracket | Male | Female |
| 5 to 17 Years | 0 (0.0%) | 0 (0.0%) |
| 18 to 34 Years | 0 (0.0%) | 0 (0.0%) |
| 35 to 64 Years | 0 (0.0%) | 6 (37.5%) |
| 65 to 74 Years | 0 (0.0%) | 0 (0.0%) |
| 75 Years and over | 0 (0.0%) | 0 (0.0%) |
Technology Access in Hollowayville
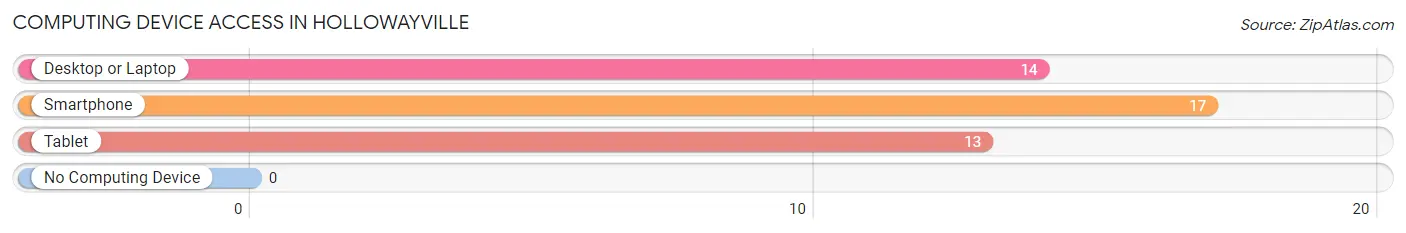
Computing Device Access in Hollowayville
| Device Type | # Households | % Households |
| Desktop or Laptop | 14 | 82.4% |
| Smartphone | 17 | 100.0% |
| Tablet | 13 | 76.5% |
| No Computing Device | 0 | 0.0% |
| Total | 17 | 100.0% |
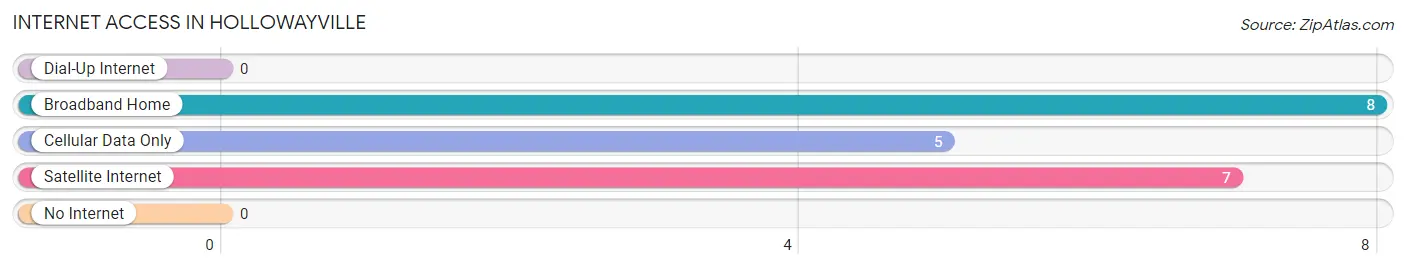
Internet Access in Hollowayville
| Internet Type | # Households | % Households |
| Dial-Up Internet | 0 | 0.0% |
| Broadband Home | 8 | 47.1% |
| Cellular Data Only | 5 | 29.4% |
| Satellite Internet | 7 | 41.2% |
| No Internet | 0 | 0.0% |
| Total | 17 | 100.0% |
Hollowayville Summary
Hollowayville is a small unincorporated community located in Bureau County, Illinois. It is situated in the northwest corner of the county, approximately 10 miles south of the city of Princeton. The population of Hollowayville was estimated to be around 200 people in 2020.
History
Hollowayville was founded in 1854 by William Holloway, a settler from Ohio. He purchased the land from the government and began to build a small village. The village was named after him and was originally known as Holloway's Grove. The first post office was established in 1856 and the village was officially incorporated in 1858.
The village grew slowly but steadily over the years, and by the early 1900s it had become a thriving community. It had a general store, a blacksmith shop, a school, a church, and several other businesses. The village was also home to a number of farms, which provided the community with much of its food and other necessities.
Geography
Hollowayville is located in the northwest corner of Bureau County, Illinois. It is situated in the Tiskilwa Creek Valley, which is part of the Illinois River watershed. The village is surrounded by rolling hills and farmland, and is approximately 10 miles south of the city of Princeton.
The climate in Hollowayville is typical of the Midwest, with hot summers and cold winters. The average annual temperature is around 50 degrees Fahrenheit, and the average annual precipitation is around 40 inches.
Economy
Hollowayville is a small, rural community with a limited economy. The main industries in the village are agriculture and tourism. The village is home to several farms, which produce a variety of crops, including corn, soybeans, and wheat. The village also has a few small businesses, including a general store, a restaurant, and a bed and breakfast.
Tourism is an important part of the local economy. The village is home to several historic sites, including the Hollowayville Historic District, which is listed on the National Register of Historic Places. The village also hosts a number of festivals and events throughout the year, including the annual Hollowayville Harvest Festival.
Demographics
Hollowayville is a small, rural community with a population of around 200 people. The racial makeup of the village is predominantly white, with a small percentage of African American and Hispanic residents. The median household income in the village is around $45,000, and the median home value is around $100,000. The village has a high rate of homeownership, with around 90% of residents owning their own homes.
Common Questions
What is Per Capita Income in Hollowayville?
Per Capita income in Hollowayville is $111,239.
What is the Median Family Income in Hollowayville?
Median Family Income in Hollowayville is $120,417.
What is the Median Household income in Hollowayville?
Median Household Income in Hollowayville is $121,250.
What is Inequality or Gini Index in Hollowayville?
Inequality or Gini Index in Hollowayville is 0.62.
What is the Total Population of Hollowayville?
Total Population of Hollowayville is 41.
What is the Total Male Population of Hollowayville?
Total Male Population of Hollowayville is 23.
What is the Total Female Population of Hollowayville?
Total Female Population of Hollowayville is 18.
What is the Ratio of Males per 100 Females in Hollowayville?
There are 127.78 Males per 100 Females in Hollowayville.
What is the Ratio of Females per 100 Males in Hollowayville?
There are 78.26 Females per 100 Males in Hollowayville.
What is the Median Population Age in Hollowayville?
Median Population Age in Hollowayville is 45.6 Years.
What is the Average Family Size in Hollowayville
Average Family Size in Hollowayville is 2.5 People.
What is the Average Household Size in Hollowayville
Average Household Size in Hollowayville is 2.4 People.
How Large is the Labor Force in Hollowayville?
There are 30 People in the Labor Forcein in Hollowayville.
What is the Percentage of People in the Labor Force in Hollowayville?
73.2% of People are in the Labor Force in Hollowayville.