Cities with the Highest Percentage of Ecuadorian Population in Illinois
RELATED REPORTS & OPTIONS
Ecuadorian
Illinois
Compare Cities
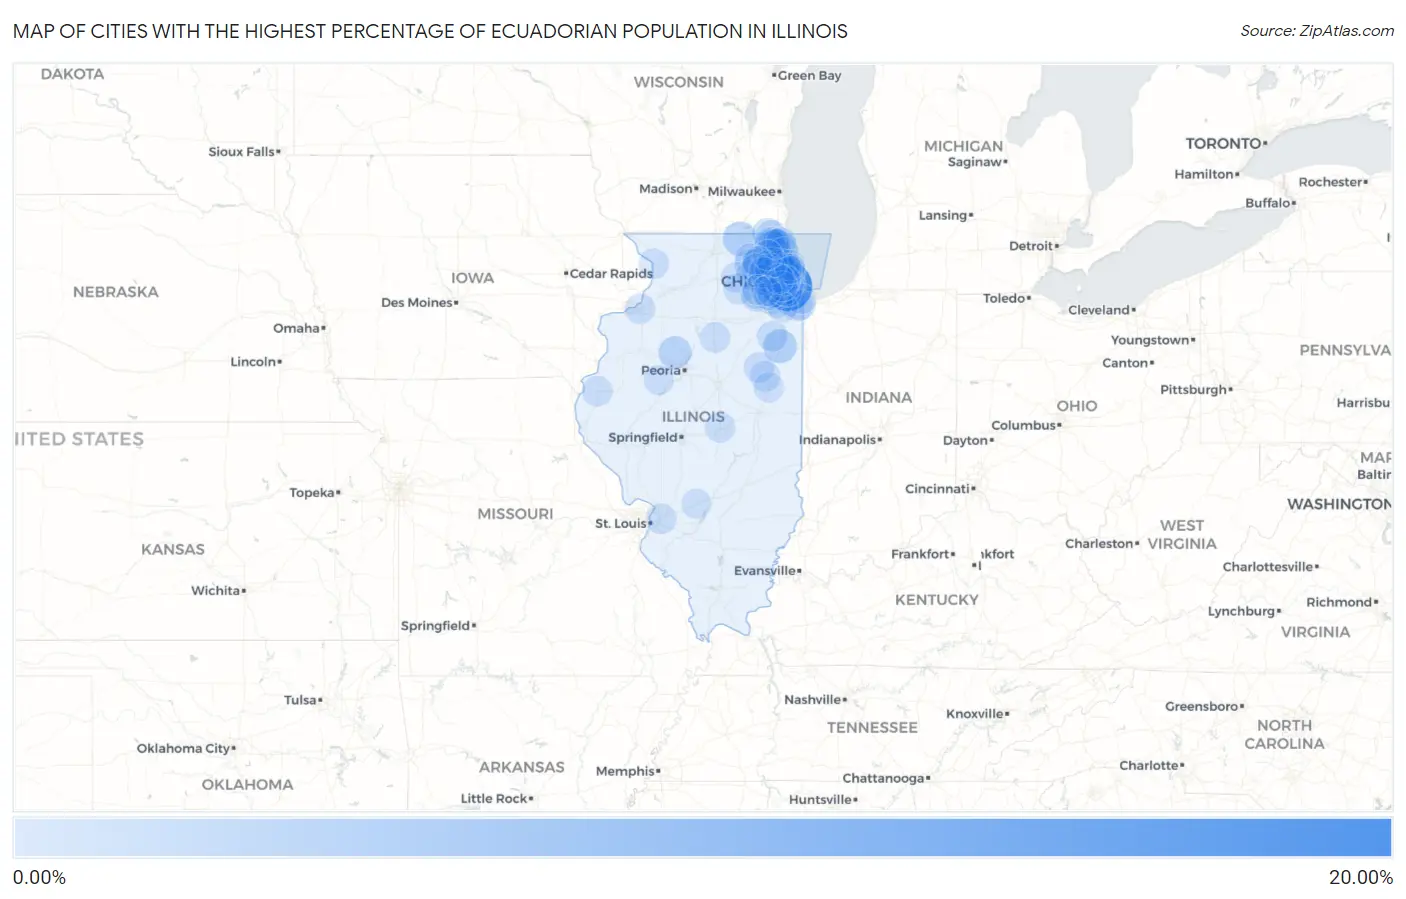
Map of Cities with the Highest Percentage of Ecuadorian Population in Illinois
0.00%
20.00%
Cities with the Highest Percentage of Ecuadorian Population in Illinois
| City | Ecuadorian | vs State | vs National | |
| 1. | Forest View | 17.72% | 0.25%(+17.5)#1 | 0.24%(+17.5)#10 |
| 2. | Rosemont | 7.97% | 0.25%(+7.72)#2 | 0.24%(+7.73)#48 |
| 3. | Harvard | 3.65% | 0.25%(+3.40)#3 | 0.24%(+3.40)#114 |
| 4. | East Dundee | 3.52% | 0.25%(+3.26)#4 | 0.24%(+3.27)#123 |
| 5. | Chebanse | 3.25% | 0.25%(+3.00)#5 | 0.24%(+3.01)#143 |
| 6. | Round Lake Park | 2.47% | 0.25%(+2.22)#6 | 0.24%(+2.23)#199 |
| 7. | Princeville | 2.40% | 0.25%(+2.15)#7 | 0.24%(+2.16)#212 |
| 8. | Countryside | 1.83% | 0.25%(+1.58)#8 | 0.24%(+1.59)#297 |
| 9. | Pingree Grove | 1.36% | 0.25%(+1.11)#9 | 0.24%(+1.12)#410 |
| 10. | Harwood Heights | 0.97% | 0.25%(+0.721)#10 | 0.24%(+0.730)#568 |
| 11. | Lake Catherine | 0.92% | 0.25%(+0.664)#11 | 0.24%(+0.673)#587 |
| 12. | Maywood | 0.90% | 0.25%(+0.646)#12 | 0.24%(+0.655)#597 |
| 13. | North Chicago | 0.87% | 0.25%(+0.622)#13 | 0.24%(+0.631)#608 |
| 14. | Melrose Park | 0.84% | 0.25%(+0.590)#14 | 0.24%(+0.599)#628 |
| 15. | Chicago | 0.78% | 0.25%(+0.533)#15 | 0.24%(+0.542)#668 |
| 16. | Hinckley | 0.70% | 0.25%(+0.445)#16 | 0.24%(+0.454)#762 |
| 17. | Elmwood Park | 0.69% | 0.25%(+0.436)#17 | 0.24%(+0.445)#766 |
| 18. | Itasca | 0.69% | 0.25%(+0.434)#18 | 0.24%(+0.443)#774 |
| 19. | Norridge | 0.67% | 0.25%(+0.415)#19 | 0.24%(+0.424)#799 |
| 20. | Grayslake | 0.65% | 0.25%(+0.397)#20 | 0.24%(+0.406)#809 |
| 21. | Western Springs | 0.64% | 0.25%(+0.390)#21 | 0.24%(+0.399)#821 |
| 22. | Gurnee | 0.63% | 0.25%(+0.382)#22 | 0.24%(+0.391)#835 |
| 23. | Bonfield | 0.63% | 0.25%(+0.373)#23 | 0.24%(+0.382)#845 |
| 24. | Franklin Park | 0.62% | 0.25%(+0.369)#24 | 0.24%(+0.378)#849 |
| 25. | Romeoville | 0.60% | 0.25%(+0.349)#25 | 0.24%(+0.358)#866 |
| 26. | Berwyn | 0.60% | 0.25%(+0.344)#26 | 0.24%(+0.353)#873 |
| 27. | Wheeling | 0.59% | 0.25%(+0.336)#27 | 0.24%(+0.344)#877 |
| 28. | Midlothian | 0.57% | 0.25%(+0.319)#28 | 0.24%(+0.328)#903 |
| 29. | Willow Springs | 0.56% | 0.25%(+0.311)#29 | 0.24%(+0.320)#916 |
| 30. | Oswego | 0.55% | 0.25%(+0.300)#30 | 0.24%(+0.309)#931 |
| 31. | Huntley | 0.51% | 0.25%(+0.262)#31 | 0.24%(+0.271)#982 |
| 32. | Niles | 0.50% | 0.25%(+0.251)#32 | 0.24%(+0.260)#1,002 |
| 33. | Lostant | 0.50% | 0.25%(+0.247)#33 | 0.24%(+0.256)#1,006 |
| 34. | Collinsville | 0.49% | 0.25%(+0.242)#34 | 0.24%(+0.251)#1,011 |
| 35. | Hometown | 0.47% | 0.25%(+0.213)#35 | 0.24%(+0.222)#1,047 |
| 36. | Hanover Park | 0.45% | 0.25%(+0.194)#36 | 0.24%(+0.203)#1,067 |
| 37. | Cortland | 0.44% | 0.25%(+0.192)#37 | 0.24%(+0.201)#1,071 |
| 38. | Addison | 0.44% | 0.25%(+0.188)#38 | 0.24%(+0.197)#1,076 |
| 39. | Glenwood | 0.42% | 0.25%(+0.170)#39 | 0.24%(+0.179)#1,105 |
| 40. | Westchester | 0.42% | 0.25%(+0.168)#40 | 0.24%(+0.177)#1,111 |
| 41. | Campton Hills | 0.41% | 0.25%(+0.156)#41 | 0.24%(+0.165)#1,129 |
| 42. | Roberts | 0.40% | 0.25%(+0.153)#42 | 0.24%(+0.162)#1,132 |
| 43. | Forsyth | 0.39% | 0.25%(+0.137)#43 | 0.24%(+0.146)#1,172 |
| 44. | Boulder Hill | 0.39% | 0.25%(+0.136)#44 | 0.24%(+0.145)#1,176 |
| 45. | Bridgeview | 0.37% | 0.25%(+0.120)#45 | 0.24%(+0.129)#1,199 |
| 46. | Savanna | 0.36% | 0.25%(+0.108)#46 | 0.24%(+0.117)#1,230 |
| 47. | Carthage | 0.35% | 0.25%(+0.100)#47 | 0.24%(+0.109)#1,246 |
| 48. | Cicero | 0.35% | 0.25%(+0.097)#48 | 0.24%(+0.106)#1,253 |
| 49. | Antioch | 0.35% | 0.25%(+0.095)#49 | 0.24%(+0.104)#1,261 |
| 50. | Westmont | 0.35% | 0.25%(+0.094)#50 | 0.24%(+0.103)#1,264 |
| 51. | Lansing | 0.33% | 0.25%(+0.083)#51 | 0.24%(+0.092)#1,282 |
| 52. | Third Lake | 0.33% | 0.25%(+0.078)#52 | 0.24%(+0.087)#1,293 |
| 53. | Vernon Hills | 0.33% | 0.25%(+0.077)#53 | 0.24%(+0.086)#1,296 |
| 54. | Burbank | 0.32% | 0.25%(+0.064)#54 | 0.24%(+0.073)#1,322 |
| 55. | Sleepy Hollow | 0.31% | 0.25%(+0.060)#55 | 0.24%(+0.069)#1,330 |
| 56. | Justice | 0.31% | 0.25%(+0.060)#56 | 0.24%(+0.069)#1,334 |
| 57. | Wheaton | 0.31% | 0.25%(+0.059)#57 | 0.24%(+0.068)#1,335 |
| 58. | Chatsworth | 0.31% | 0.25%(+0.057)#58 | 0.24%(+0.066)#1,341 |
| 59. | Round Lake Beach | 0.31% | 0.25%(+0.057)#59 | 0.24%(+0.066)#1,342 |
| 60. | Des Plaines | 0.30% | 0.25%(+0.051)#60 | 0.24%(+0.060)#1,357 |
| 61. | Mount Prospect | 0.30% | 0.25%(+0.049)#61 | 0.24%(+0.058)#1,364 |
| 62. | Lombard | 0.30% | 0.25%(+0.043)#62 | 0.24%(+0.052)#1,378 |
| 63. | Glenview | 0.29% | 0.25%(+0.036)#63 | 0.24%(+0.045)#1,394 |
| 64. | Park Ridge | 0.27% | 0.25%(+0.023)#64 | 0.24%(+0.032)#1,431 |
| 65. | East Moline | 0.27% | 0.25%(+0.016)#65 | 0.24%(+0.025)#1,451 |
| 66. | Carol Stream | 0.26% | 0.25%(+0.005)#66 | 0.24%(+0.014)#1,485 |
| 67. | Lake Forest | 0.25% | 0.25%(+0.000)#67 | 0.24%(+0.009)#1,498 |
| 68. | Prospect Heights | 0.25% | 0.25%(-0.006)#68 | 0.24%(+0.003)#1,518 |
| 69. | Bloomingdale | 0.25% | 0.25%(-0.007)#69 | 0.24%(+0.002)#1,519 |
| 70. | Burnham | 0.22% | 0.25%(-0.028)#70 | 0.24%(-0.019)#1,591 |
| 71. | Forest Park | 0.22% | 0.25%(-0.033)#71 | 0.24%(-0.024)#1,615 |
| 72. | Morton Grove | 0.22% | 0.25%(-0.035)#72 | 0.24%(-0.026)#1,628 |
| 73. | Hoffman Estates | 0.21% | 0.25%(-0.037)#73 | 0.24%(-0.028)#1,631 |
| 74. | Waukegan | 0.21% | 0.25%(-0.043)#74 | 0.24%(-0.034)#1,654 |
| 75. | Streamwood | 0.20% | 0.25%(-0.047)#75 | 0.24%(-0.038)#1,671 |
| 76. | Lincolnwood | 0.20% | 0.25%(-0.048)#76 | 0.24%(-0.039)#1,678 |
| 77. | Lisle | 0.20% | 0.25%(-0.052)#77 | 0.24%(-0.043)#1,691 |
| 78. | West Chicago | 0.20% | 0.25%(-0.057)#78 | 0.24%(-0.048)#1,711 |
| 79. | Hillside | 0.19% | 0.25%(-0.057)#79 | 0.24%(-0.048)#1,713 |
| 80. | Paxton | 0.19% | 0.25%(-0.062)#80 | 0.24%(-0.053)#1,734 |
| 81. | Homer Glen | 0.19% | 0.25%(-0.064)#81 | 0.24%(-0.055)#1,739 |
| 82. | Wilmette | 0.19% | 0.25%(-0.065)#82 | 0.24%(-0.056)#1,744 |
| 83. | Elgin | 0.19% | 0.25%(-0.065)#83 | 0.24%(-0.056)#1,747 |
| 84. | Bolingbrook | 0.18% | 0.25%(-0.071)#84 | 0.24%(-0.062)#1,775 |
| 85. | Bartlett | 0.18% | 0.25%(-0.073)#85 | 0.24%(-0.064)#1,783 |
| 86. | Greenville | 0.17% | 0.25%(-0.083)#86 | 0.24%(-0.074)#1,819 |
| 87. | River Forest | 0.15% | 0.25%(-0.105)#87 | 0.24%(-0.096)#1,929 |
| 88. | Woodridge | 0.15% | 0.25%(-0.105)#88 | 0.24%(-0.096)#1,932 |
| 89. | Mokena | 0.15% | 0.25%(-0.106)#89 | 0.24%(-0.097)#1,943 |
| 90. | Schaumburg | 0.14% | 0.25%(-0.109)#90 | 0.24%(-0.100)#1,954 |
| 91. | La Grange | 0.14% | 0.25%(-0.109)#91 | 0.24%(-0.100)#1,959 |
| 92. | Palatine | 0.14% | 0.25%(-0.113)#92 | 0.24%(-0.104)#1,987 |
| 93. | Skokie | 0.13% | 0.25%(-0.122)#93 | 0.24%(-0.113)#2,027 |
| 94. | Elmhurst | 0.13% | 0.25%(-0.123)#94 | 0.24%(-0.114)#2,033 |
| 95. | Gages Lake | 0.13% | 0.25%(-0.123)#95 | 0.24%(-0.114)#2,040 |
| 96. | North Barrington | 0.13% | 0.25%(-0.124)#96 | 0.24%(-0.115)#2,043 |
| 97. | Carpentersville | 0.12% | 0.25%(-0.128)#97 | 0.24%(-0.119)#2,061 |
| 98. | Aurora | 0.12% | 0.25%(-0.135)#98 | 0.24%(-0.126)#2,118 |
| 99. | Canton | 0.11% | 0.25%(-0.140)#99 | 0.24%(-0.131)#2,158 |
| 100. | Naperville | 0.11% | 0.25%(-0.146)#100 | 0.24%(-0.137)#2,196 |
Common Questions
What are the Top 10 Cities with the Highest Percentage of Ecuadorian Population in Illinois?
Top 10 Cities with the Highest Percentage of Ecuadorian Population in Illinois are:
#1
17.72%
#2
7.97%
#3
3.65%
#4
3.52%
#5
3.25%
#6
2.47%
#7
2.40%
#8
1.83%
#9
1.36%
#10
0.97%
What city has the Highest Percentage of Ecuadorian Population in Illinois?
Forest View has the Highest Percentage of Ecuadorian Population in Illinois with 17.72%.
What is the Percentage of Ecuadorian Population in the State of Illinois?
Percentage of Ecuadorian Population in Illinois is 0.25%.
What is the Percentage of Ecuadorian Population in the United States?
Percentage of Ecuadorian Population in the United States is 0.24%.