Cities with the Highest Percentage of Slovene Population in Illinois
RELATED REPORTS & OPTIONS
Slovene
Illinois
Compare Cities
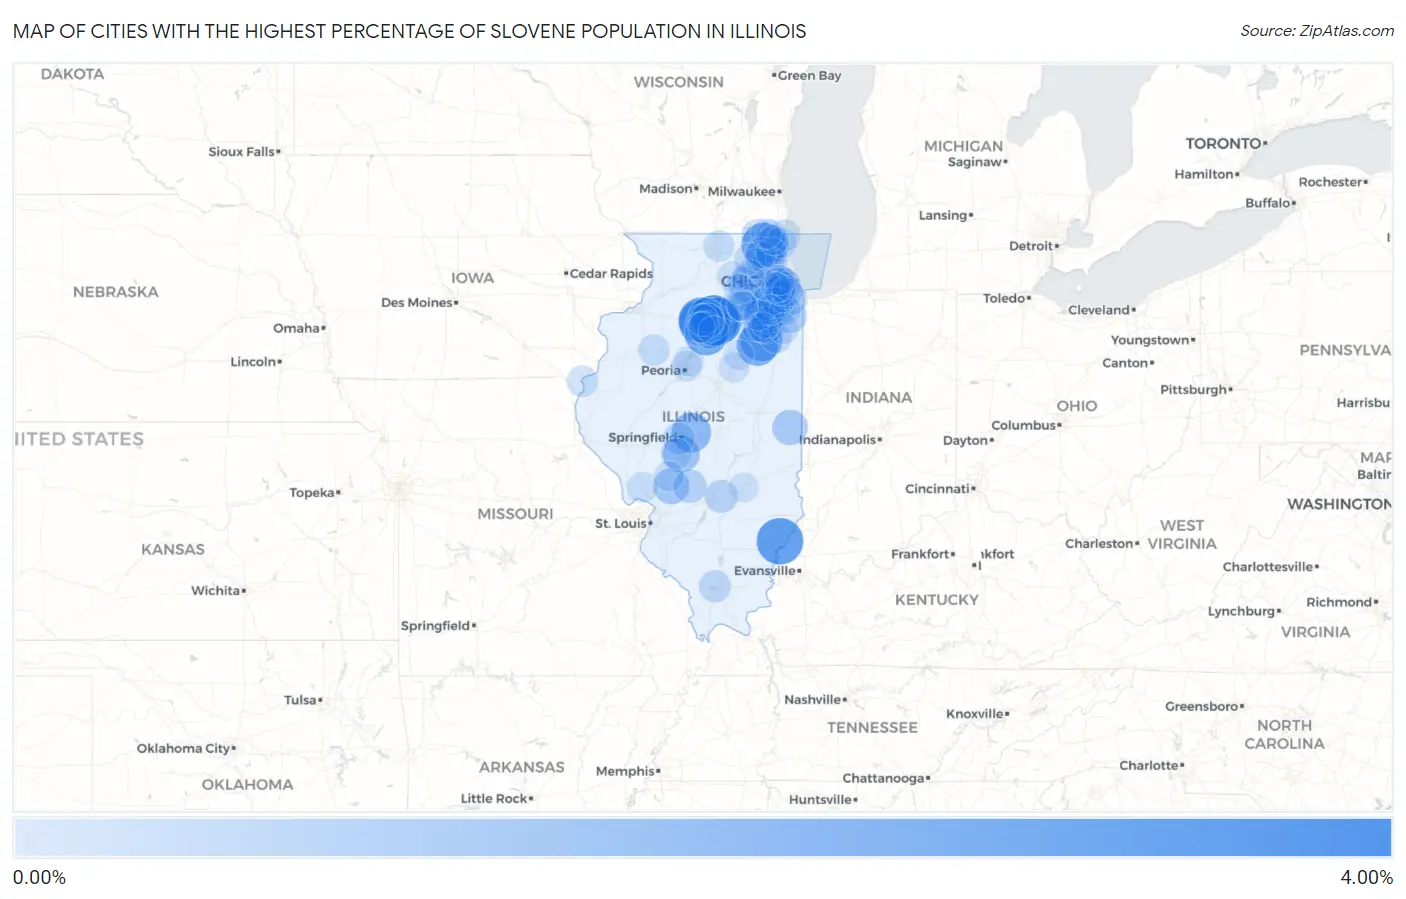
Map of Cities with the Highest Percentage of Slovene Population in Illinois
0.00%
4.00%
Cities with the Highest Percentage of Slovene Population in Illinois
| City | Slovene | vs State | vs National | |
| 1. | Lasalle | 3.11% | 0.096%(+3.01)#1 | 0.052%(+3.05)#90 |
| 2. | North Utica | 2.82% | 0.096%(+2.72)#2 | 0.052%(+2.77)#99 |
| 3. | Bellmont | 2.67% | 0.096%(+2.57)#3 | 0.052%(+2.61)#110 |
| 4. | De Pue | 2.44% | 0.096%(+2.34)#4 | 0.052%(+2.39)#118 |
| 5. | Hollowayville | 2.44% | 0.096%(+2.34)#5 | 0.052%(+2.39)#119 |
| 6. | Lakemoor | 2.33% | 0.096%(+2.24)#6 | 0.052%(+2.28)#123 |
| 7. | Mcnabb | 2.16% | 0.096%(+2.07)#7 | 0.052%(+2.11)#129 |
| 8. | Reddick | 2.00% | 0.096%(+1.90)#8 | 0.052%(+1.95)#146 |
| 9. | Cedar Point | 2.00% | 0.096%(+1.90)#9 | 0.052%(+1.95)#147 |
| 10. | Campus | 1.92% | 0.096%(+1.83)#10 | 0.052%(+1.87)#154 |
| 11. | Rockdale | 1.92% | 0.096%(+1.83)#11 | 0.052%(+1.87)#155 |
| 12. | Peru | 1.69% | 0.096%(+1.59)#12 | 0.052%(+1.64)#179 |
| 13. | Dawson | 1.64% | 0.096%(+1.55)#13 | 0.052%(+1.59)#184 |
| 14. | Divernon | 1.26% | 0.096%(+1.16)#14 | 0.052%(+1.21)#247 |
| 15. | Minooka | 1.25% | 0.096%(+1.16)#15 | 0.052%(+1.20)#249 |
| 16. | Rest Haven | 1.20% | 0.096%(+1.11)#16 | 0.052%(+1.15)#258 |
| 17. | Gillespie | 1.10% | 0.096%(+1.000)#17 | 0.052%(+1.04)#292 |
| 18. | Spring Valley | 1.07% | 0.096%(+0.973)#18 | 0.052%(+1.02)#300 |
| 19. | Deer Park | 1.03% | 0.096%(+0.933)#19 | 0.052%(+0.977)#309 |
| 20. | Indianola | 1.02% | 0.096%(+0.919)#20 | 0.052%(+0.964)#315 |
| 21. | Crest Hill | 1.00% | 0.096%(+0.899)#21 | 0.052%(+0.944)#319 |
| 22. | Hainesville | 0.99% | 0.096%(+0.891)#22 | 0.052%(+0.935)#323 |
| 23. | Lakewood Shores | 0.91% | 0.096%(+0.813)#23 | 0.052%(+0.857)#352 |
| 24. | Cherry | 0.87% | 0.096%(+0.773)#24 | 0.052%(+0.818)#370 |
| 25. | Shorewood | 0.83% | 0.096%(+0.738)#25 | 0.052%(+0.782)#386 |
| 26. | New Lenox | 0.83% | 0.096%(+0.737)#26 | 0.052%(+0.782)#387 |
| 27. | Elwood | 0.82% | 0.096%(+0.725)#27 | 0.052%(+0.769)#391 |
| 28. | La Grange | 0.82% | 0.096%(+0.722)#28 | 0.052%(+0.767)#394 |
| 29. | Granville | 0.81% | 0.096%(+0.718)#29 | 0.052%(+0.762)#398 |
| 30. | Monee | 0.76% | 0.096%(+0.666)#30 | 0.052%(+0.710)#423 |
| 31. | Crestwood | 0.75% | 0.096%(+0.658)#31 | 0.052%(+0.703)#429 |
| 32. | Taylor Springs | 0.75% | 0.096%(+0.658)#32 | 0.052%(+0.702)#430 |
| 33. | Dalzell | 0.73% | 0.096%(+0.637)#33 | 0.052%(+0.681)#446 |
| 34. | Ingalls Park | 0.71% | 0.096%(+0.613)#34 | 0.052%(+0.657)#465 |
| 35. | Joliet | 0.71% | 0.096%(+0.612)#35 | 0.052%(+0.657)#467 |
| 36. | Kaneville | 0.70% | 0.096%(+0.604)#36 | 0.052%(+0.649)#472 |
| 37. | Indian Head Park | 0.70% | 0.096%(+0.600)#37 | 0.052%(+0.644)#475 |
| 38. | Carbon Hill | 0.69% | 0.096%(+0.590)#38 | 0.052%(+0.635)#482 |
| 39. | Brownstown | 0.67% | 0.096%(+0.571)#39 | 0.052%(+0.616)#497 |
| 40. | Lombard | 0.61% | 0.096%(+0.514)#40 | 0.052%(+0.559)#527 |
| 41. | Westchester | 0.58% | 0.096%(+0.485)#41 | 0.052%(+0.529)#544 |
| 42. | Crainville | 0.56% | 0.096%(+0.460)#42 | 0.052%(+0.504)#563 |
| 43. | Inverness | 0.54% | 0.096%(+0.448)#43 | 0.052%(+0.492)#576 |
| 44. | Leland Grove | 0.54% | 0.096%(+0.445)#44 | 0.052%(+0.490)#581 |
| 45. | Elburn | 0.54% | 0.096%(+0.441)#45 | 0.052%(+0.485)#586 |
| 46. | Oak Brook | 0.50% | 0.096%(+0.400)#46 | 0.052%(+0.444)#629 |
| 47. | Riverside | 0.49% | 0.096%(+0.392)#47 | 0.052%(+0.436)#642 |
| 48. | Crystal Lawns | 0.49% | 0.096%(+0.391)#48 | 0.052%(+0.435)#646 |
| 49. | Richmond | 0.49% | 0.096%(+0.389)#49 | 0.052%(+0.434)#650 |
| 50. | Huntley | 0.47% | 0.096%(+0.374)#50 | 0.052%(+0.418)#669 |
| 51. | Nauvoo | 0.46% | 0.096%(+0.368)#51 | 0.052%(+0.413)#675 |
| 52. | Winthrop Harbor | 0.46% | 0.096%(+0.367)#52 | 0.052%(+0.411)#680 |
| 53. | Seatonville | 0.46% | 0.096%(+0.367)#53 | 0.052%(+0.411)#683 |
| 54. | Plano | 0.46% | 0.096%(+0.363)#54 | 0.052%(+0.407)#688 |
| 55. | Palos Park | 0.45% | 0.096%(+0.359)#55 | 0.052%(+0.403)#694 |
| 56. | Downers Grove | 0.45% | 0.096%(+0.350)#56 | 0.052%(+0.394)#715 |
| 57. | Oak Run | 0.45% | 0.096%(+0.350)#57 | 0.052%(+0.394)#716 |
| 58. | Lockport | 0.42% | 0.096%(+0.321)#58 | 0.052%(+0.366)#751 |
| 59. | Loves Park | 0.41% | 0.096%(+0.314)#59 | 0.052%(+0.358)#765 |
| 60. | Frankfort | 0.41% | 0.096%(+0.313)#60 | 0.052%(+0.358)#766 |
| 61. | Limestone | 0.41% | 0.096%(+0.310)#61 | 0.052%(+0.354)#770 |
| 62. | Wilmington | 0.40% | 0.096%(+0.302)#62 | 0.052%(+0.346)#781 |
| 63. | Homer Glen | 0.40% | 0.096%(+0.300)#63 | 0.052%(+0.344)#785 |
| 64. | Mark | 0.38% | 0.096%(+0.280)#64 | 0.052%(+0.325)#812 |
| 65. | Auburn | 0.37% | 0.096%(+0.279)#65 | 0.052%(+0.323)#819 |
| 66. | Sleepy Hollow | 0.37% | 0.096%(+0.278)#66 | 0.052%(+0.323)#823 |
| 67. | Yorkville | 0.37% | 0.096%(+0.275)#67 | 0.052%(+0.320)#831 |
| 68. | Jerseyville | 0.37% | 0.096%(+0.271)#68 | 0.052%(+0.316)#837 |
| 69. | Waukegan | 0.37% | 0.096%(+0.271)#69 | 0.052%(+0.315)#839 |
| 70. | Chicago Ridge | 0.36% | 0.096%(+0.268)#70 | 0.052%(+0.312)#844 |
| 71. | Oakwood Hills | 0.36% | 0.096%(+0.267)#71 | 0.052%(+0.312)#845 |
| 72. | Millington | 0.36% | 0.096%(+0.264)#72 | 0.052%(+0.309)#851 |
| 73. | Lily Lake | 0.36% | 0.096%(+0.264)#73 | 0.052%(+0.308)#852 |
| 74. | Peoria Heights | 0.34% | 0.096%(+0.243)#74 | 0.052%(+0.288)#891 |
| 75. | Trout Valley | 0.34% | 0.096%(+0.241)#75 | 0.052%(+0.286)#897 |
| 76. | Manteno | 0.34% | 0.096%(+0.240)#76 | 0.052%(+0.284)#903 |
| 77. | Antioch | 0.33% | 0.096%(+0.230)#77 | 0.052%(+0.274)#919 |
| 78. | Chenoa | 0.32% | 0.096%(+0.226)#78 | 0.052%(+0.270)#931 |
| 79. | Dekalb | 0.31% | 0.096%(+0.216)#79 | 0.052%(+0.260)#951 |
| 80. | Warrenville | 0.31% | 0.096%(+0.212)#80 | 0.052%(+0.257)#958 |
| 81. | Carlinville | 0.30% | 0.096%(+0.201)#81 | 0.052%(+0.245)#982 |
| 82. | Sheridan | 0.30% | 0.096%(+0.201)#82 | 0.052%(+0.245)#983 |
| 83. | Bay View Gardens | 0.29% | 0.096%(+0.196)#83 | 0.052%(+0.241)#996 |
| 84. | Western Springs | 0.29% | 0.096%(+0.191)#84 | 0.052%(+0.236)#1,013 |
| 85. | Burr Ridge | 0.29% | 0.096%(+0.191)#85 | 0.052%(+0.236)#1,014 |
| 86. | Tonica | 0.29% | 0.096%(+0.190)#86 | 0.052%(+0.235)#1,018 |
| 87. | Hawthorn Woods | 0.29% | 0.096%(+0.189)#87 | 0.052%(+0.234)#1,020 |
| 88. | Burbank | 0.29% | 0.096%(+0.189)#88 | 0.052%(+0.233)#1,022 |
| 89. | Lindenhurst | 0.28% | 0.096%(+0.188)#89 | 0.052%(+0.233)#1,027 |
| 90. | Berkeley | 0.28% | 0.096%(+0.188)#90 | 0.052%(+0.232)#1,032 |
| 91. | Channel Lake | 0.28% | 0.096%(+0.184)#91 | 0.052%(+0.229)#1,047 |
| 92. | Hinckley | 0.28% | 0.096%(+0.182)#92 | 0.052%(+0.227)#1,051 |
| 93. | Channahon | 0.28% | 0.096%(+0.179)#93 | 0.052%(+0.224)#1,058 |
| 94. | Westmont | 0.27% | 0.096%(+0.176)#94 | 0.052%(+0.220)#1,071 |
| 95. | Preston Heights | 0.27% | 0.096%(+0.175)#95 | 0.052%(+0.219)#1,077 |
| 96. | Pontiac | 0.26% | 0.096%(+0.166)#96 | 0.052%(+0.210)#1,101 |
| 97. | Effingham | 0.26% | 0.096%(+0.165)#97 | 0.052%(+0.210)#1,102 |
| 98. | Hennepin | 0.26% | 0.096%(+0.165)#98 | 0.052%(+0.209)#1,103 |
| 99. | Braidwood | 0.26% | 0.096%(+0.164)#99 | 0.052%(+0.208)#1,106 |
| 100. | Newark | 0.26% | 0.096%(+0.163)#100 | 0.052%(+0.208)#1,108 |
Common Questions
What are the Top 10 Cities with the Highest Percentage of Slovene Population in Illinois?
Top 10 Cities with the Highest Percentage of Slovene Population in Illinois are:
#1
3.11%
#2
2.82%
#3
2.67%
#4
2.44%
#5
2.44%
#6
2.33%
#7
2.16%
#8
2.00%
#9
2.00%
#10
1.92%
What city has the Highest Percentage of Slovene Population in Illinois?
LaSalle has the Highest Percentage of Slovene Population in Illinois with 3.11%.
What is the Percentage of Slovene Population in the State of Illinois?
Percentage of Slovene Population in Illinois is 0.096%.
What is the Percentage of Slovene Population in the United States?
Percentage of Slovene Population in the United States is 0.052%.