Zip Codes with the Highest Percentage of Population Employed in Food Preparation & Serving in Evanston, IL
RELATED REPORTS & OPTIONS
Food Preparation & Serving
Evanston
Compare Zip Codes
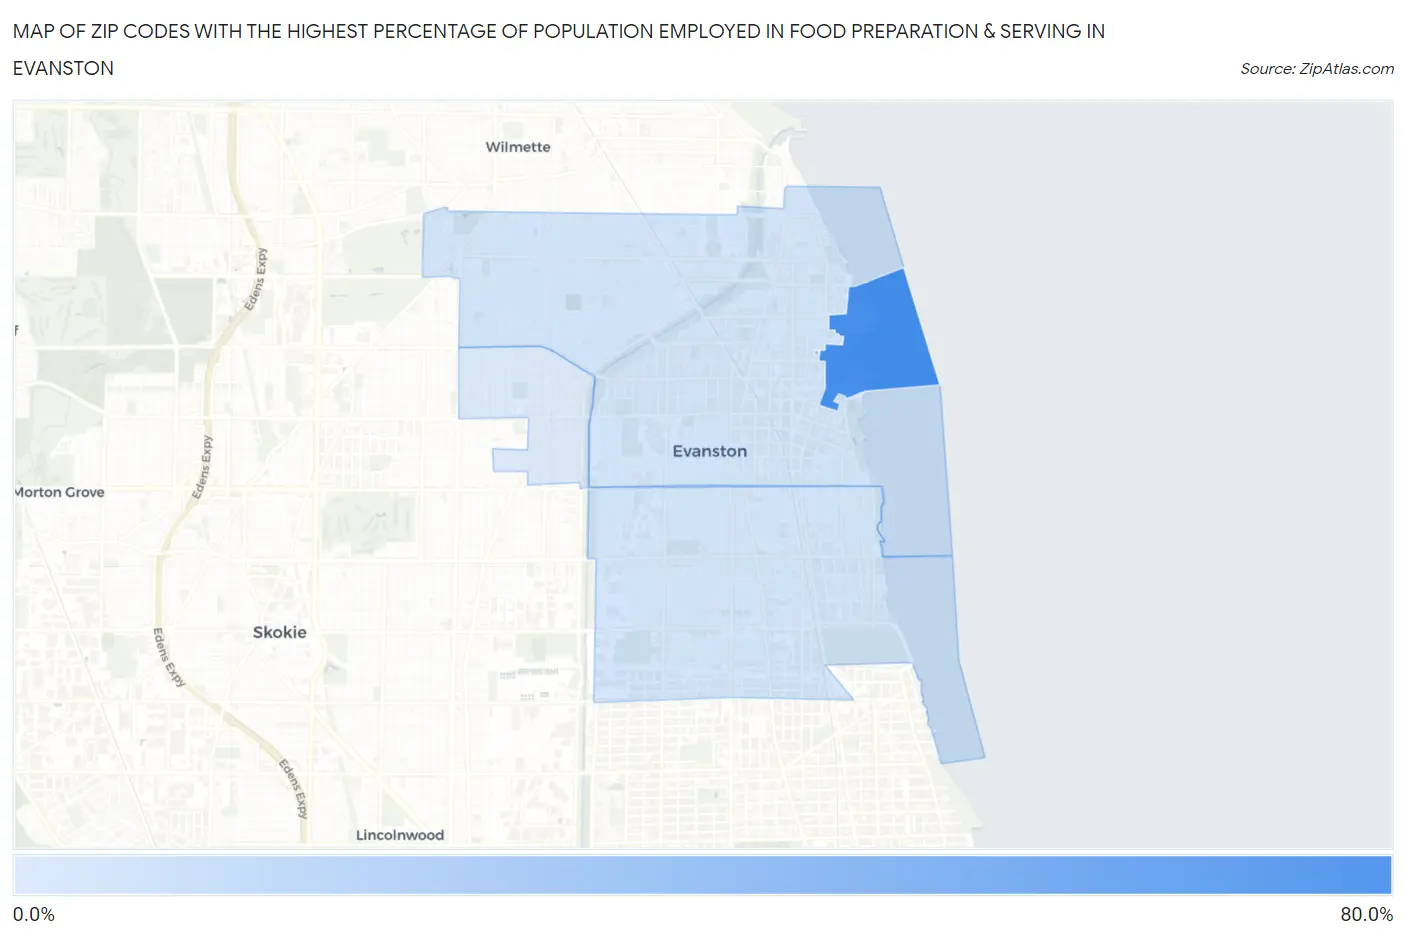
Map of Zip Codes with the Highest Percentage of Population Employed in Food Preparation & Serving in Evanston
0.27%
69.4%
Zip Codes with the Highest Percentage of Population Employed in Food Preparation & Serving in Evanston, IL
| Zip Code | % Employed | vs State | vs National | |
| 1. | 60208 | 69.4% | 5.0%(+64.4)#1 | 5.3%(+64.2)#23 |
| 2. | 60201 | 3.4% | 5.0%(-1.64)#848 | 5.3%(-1.89)#19,645 |
| 3. | 60202 | 3.3% | 5.0%(-1.77)#873 | 5.3%(-2.03)#20,250 |
| 4. | 60203 | 0.27% | 5.0%(-4.76)#1,251 | 5.3%(-5.02)#27,863 |
1
Common Questions
What are the Top 3 Zip Codes with the Highest Percentage of Population Employed in Food Preparation & Serving in Evanston, IL?
Top 3 Zip Codes with the Highest Percentage of Population Employed in Food Preparation & Serving in Evanston, IL are:
What zip code has the Highest Percentage of Population Employed in Food Preparation & Serving in Evanston, IL?
60208 has the Highest Percentage of Population Employed in Food Preparation & Serving in Evanston, IL with 69.4%.
What is the Percentage of Population Employed in Food Preparation & Serving in Evanston, IL?
Percentage of Population Employed in Food Preparation & Serving in Evanston is 3.4%.
What is the Percentage of Population Employed in Food Preparation & Serving in Illinois?
Percentage of Population Employed in Food Preparation & Serving in Illinois is 5.0%.
What is the Percentage of Population Employed in Food Preparation & Serving in the United States?
Percentage of Population Employed in Food Preparation & Serving in the United States is 5.3%.