Cities with the Highest Percentage of Population Employed in Enterprise Management in Illinois
RELATED REPORTS & OPTIONS
Enterprise Management
Illinois
Compare Cities
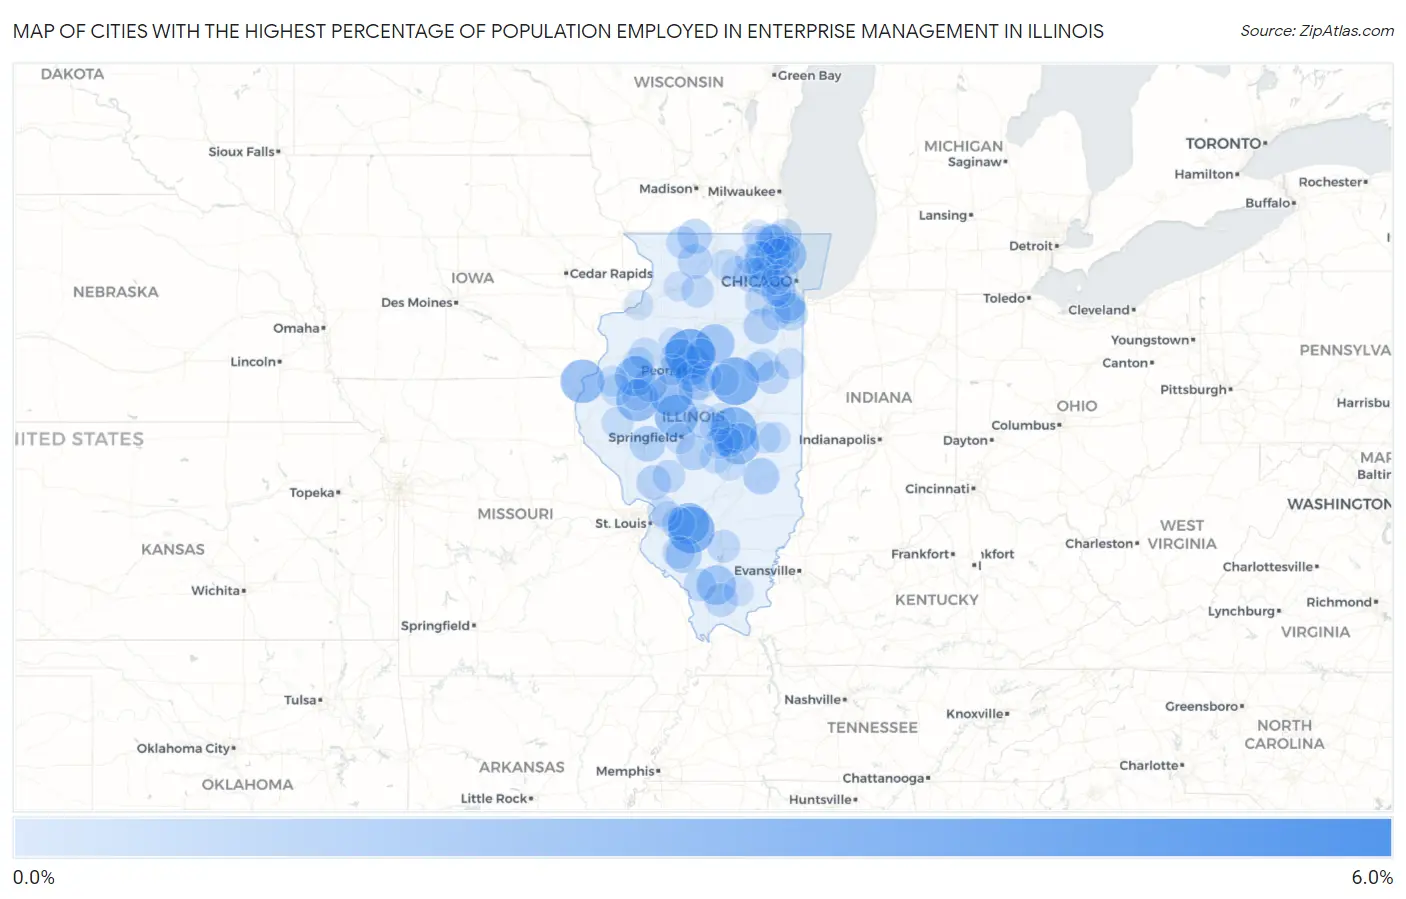
Map of Cities with the Highest Percentage of Population Employed in Enterprise Management in Illinois
0.0%
6.0%
Cities with the Highest Percentage of Population Employed in Enterprise Management in Illinois
| City | % Employed | vs State | vs National | |
| 1. | Trivoli | 5.8% | 0.17%(+5.60)#1 | 0.14%(+5.64)#43 |
| 2. | Chillicothe | 3.8% | 0.17%(+3.66)#2 | 0.14%(+3.70)#86 |
| 3. | Cooksville | 3.5% | 0.17%(+3.35)#3 | 0.14%(+3.39)#98 |
| 4. | Bartelso | 3.3% | 0.17%(+3.17)#4 | 0.14%(+3.20)#106 |
| 5. | Cerro Gordo | 3.2% | 0.17%(+3.02)#5 | 0.14%(+3.06)#119 |
| 6. | Nauvoo | 2.8% | 0.17%(+2.63)#6 | 0.14%(+2.67)#145 |
| 7. | Greenview | 2.7% | 0.17%(+2.54)#7 | 0.14%(+2.58)#152 |
| 8. | Forest City | 2.7% | 0.17%(+2.49)#8 | 0.14%(+2.53)#155 |
| 9. | Blairsville | 2.6% | 0.17%(+2.46)#9 | 0.14%(+2.49)#163 |
| 10. | Vermont | 2.6% | 0.17%(+2.45)#10 | 0.14%(+2.48)#165 |
| 11. | Breese | 2.5% | 0.17%(+2.31)#11 | 0.14%(+2.35)#181 |
| 12. | Lovington | 2.4% | 0.17%(+2.24)#12 | 0.14%(+2.27)#191 |
| 13. | Highwood | 2.2% | 0.17%(+2.08)#13 | 0.14%(+2.11)#210 |
| 14. | Prairie City | 2.2% | 0.17%(+2.02)#14 | 0.14%(+2.05)#217 |
| 15. | Arbury Hills | 2.1% | 0.17%(+1.95)#15 | 0.14%(+1.99)#224 |
| 16. | Germantown Hills | 2.1% | 0.17%(+1.94)#16 | 0.14%(+1.98)#225 |
| 17. | Energy | 2.1% | 0.17%(+1.92)#17 | 0.14%(+1.96)#227 |
| 18. | Wenona | 2.1% | 0.17%(+1.89)#18 | 0.14%(+1.93)#232 |
| 19. | Dunlap | 2.1% | 0.17%(+1.88)#19 | 0.14%(+1.92)#233 |
| 20. | Long Grove | 2.0% | 0.17%(+1.86)#20 | 0.14%(+1.90)#239 |
| 21. | Barrington Hills | 1.8% | 0.17%(+1.59)#21 | 0.14%(+1.63)#290 |
| 22. | Toledo | 1.6% | 0.17%(+1.39)#22 | 0.14%(+1.43)#339 |
| 23. | Coulterville | 1.5% | 0.17%(+1.35)#23 | 0.14%(+1.38)#353 |
| 24. | South Jacksonville | 1.4% | 0.17%(+1.27)#24 | 0.14%(+1.31)#378 |
| 25. | Diamond | 1.4% | 0.17%(+1.25)#25 | 0.14%(+1.29)#385 |
| 26. | Kincaid | 1.4% | 0.17%(+1.23)#26 | 0.14%(+1.26)#394 |
| 27. | Grandwood Park | 1.3% | 0.17%(+1.12)#27 | 0.14%(+1.16)#434 |
| 28. | Mackinaw | 1.3% | 0.17%(+1.11)#28 | 0.14%(+1.14)#439 |
| 29. | Mount Zion | 1.3% | 0.17%(+1.10)#29 | 0.14%(+1.14)#442 |
| 30. | Medora | 1.3% | 0.17%(+1.09)#30 | 0.14%(+1.13)#445 |
| 31. | Lake Summerset | 1.3% | 0.17%(+1.09)#31 | 0.14%(+1.12)#447 |
| 32. | Leaf River | 1.3% | 0.17%(+1.08)#32 | 0.14%(+1.11)#454 |
| 33. | Campton Hills | 1.2% | 0.17%(+1.04)#33 | 0.14%(+1.07)#466 |
| 34. | Cuba | 1.2% | 0.17%(+1.02)#34 | 0.14%(+1.06)#475 |
| 35. | Mount Pulaski | 1.2% | 0.17%(+0.988)#35 | 0.14%(+1.02)#493 |
| 36. | Avon | 1.1% | 0.17%(+0.972)#36 | 0.14%(+1.01)#500 |
| 37. | Goreville | 1.1% | 0.17%(+0.952)#37 | 0.14%(+0.988)#514 |
| 38. | Third Lake | 1.1% | 0.17%(+0.944)#38 | 0.14%(+0.980)#519 |
| 39. | Hinsdale | 1.1% | 0.17%(+0.938)#39 | 0.14%(+0.974)#521 |
| 40. | University Park | 1.1% | 0.17%(+0.933)#40 | 0.14%(+0.969)#523 |
| 41. | Winfield | 1.1% | 0.17%(+0.902)#41 | 0.14%(+0.938)#533 |
| 42. | Trenton | 1.1% | 0.17%(+0.891)#42 | 0.14%(+0.927)#539 |
| 43. | Buckley | 1.0% | 0.17%(+0.846)#43 | 0.14%(+0.882)#576 |
| 44. | Plainfield | 0.99% | 0.17%(+0.818)#44 | 0.14%(+0.854)#601 |
| 45. | Carlinville | 0.99% | 0.17%(+0.812)#45 | 0.14%(+0.848)#610 |
| 46. | Mount Vernon | 0.99% | 0.17%(+0.811)#46 | 0.14%(+0.847)#612 |
| 47. | Winthrop Harbor | 0.97% | 0.17%(+0.792)#47 | 0.14%(+0.828)#628 |
| 48. | Cedarville | 0.96% | 0.17%(+0.790)#48 | 0.14%(+0.826)#630 |
| 49. | Amboy | 0.96% | 0.17%(+0.781)#49 | 0.14%(+0.817)#634 |
| 50. | Tilden | 0.95% | 0.17%(+0.775)#50 | 0.14%(+0.811)#638 |
| 51. | Murphysboro | 0.92% | 0.17%(+0.750)#51 | 0.14%(+0.786)#663 |
| 52. | Lake Forest | 0.92% | 0.17%(+0.749)#52 | 0.14%(+0.785)#665 |
| 53. | Bartlett | 0.91% | 0.17%(+0.732)#53 | 0.14%(+0.768)#680 |
| 54. | Piper City | 0.91% | 0.17%(+0.732)#54 | 0.14%(+0.768)#681 |
| 55. | Knoxville | 0.86% | 0.17%(+0.686)#55 | 0.14%(+0.722)#722 |
| 56. | Colchester | 0.82% | 0.17%(+0.647)#56 | 0.14%(+0.682)#763 |
| 57. | Towanda | 0.82% | 0.17%(+0.642)#57 | 0.14%(+0.678)#767 |
| 58. | Frankfort Square | 0.82% | 0.17%(+0.641)#58 | 0.14%(+0.676)#768 |
| 59. | Mount Sterling | 0.81% | 0.17%(+0.637)#59 | 0.14%(+0.673)#772 |
| 60. | Morton | 0.81% | 0.17%(+0.633)#60 | 0.14%(+0.669)#777 |
| 61. | Assumption | 0.76% | 0.17%(+0.589)#61 | 0.14%(+0.625)#841 |
| 62. | Kirkland | 0.76% | 0.17%(+0.586)#62 | 0.14%(+0.622)#846 |
| 63. | Camargo | 0.75% | 0.17%(+0.580)#63 | 0.14%(+0.616)#854 |
| 64. | Matteson | 0.75% | 0.17%(+0.580)#64 | 0.14%(+0.615)#856 |
| 65. | Table Grove | 0.73% | 0.17%(+0.555)#65 | 0.14%(+0.591)#884 |
| 66. | Watseka | 0.73% | 0.17%(+0.554)#66 | 0.14%(+0.589)#887 |
| 67. | Shelbyville | 0.73% | 0.17%(+0.552)#67 | 0.14%(+0.588)#889 |
| 68. | Abingdon | 0.70% | 0.17%(+0.530)#68 | 0.14%(+0.566)#920 |
| 69. | Maroa | 0.70% | 0.17%(+0.529)#69 | 0.14%(+0.565)#923 |
| 70. | Schiller Park | 0.70% | 0.17%(+0.525)#70 | 0.14%(+0.561)#929 |
| 71. | Blandinsville | 0.69% | 0.17%(+0.520)#71 | 0.14%(+0.556)#939 |
| 72. | Country Club Hills | 0.69% | 0.17%(+0.518)#72 | 0.14%(+0.554)#940 |
| 73. | Hanna City | 0.67% | 0.17%(+0.494)#73 | 0.14%(+0.530)#969 |
| 74. | Jerome | 0.66% | 0.17%(+0.490)#74 | 0.14%(+0.526)#974 |
| 75. | Newman | 0.66% | 0.17%(+0.486)#75 | 0.14%(+0.521)#985 |
| 76. | Chatsworth | 0.66% | 0.17%(+0.485)#76 | 0.14%(+0.520)#989 |
| 77. | Richmond | 0.63% | 0.17%(+0.458)#77 | 0.14%(+0.494)#1,023 |
| 78. | Hopedale | 0.63% | 0.17%(+0.454)#78 | 0.14%(+0.490)#1,034 |
| 79. | Johnsburg | 0.62% | 0.17%(+0.444)#79 | 0.14%(+0.480)#1,055 |
| 80. | Manhattan | 0.62% | 0.17%(+0.442)#80 | 0.14%(+0.478)#1,059 |
| 81. | Lake Villa | 0.61% | 0.17%(+0.435)#81 | 0.14%(+0.471)#1,071 |
| 82. | Congerville | 0.59% | 0.17%(+0.415)#82 | 0.14%(+0.451)#1,109 |
| 83. | Willow Springs | 0.58% | 0.17%(+0.410)#83 | 0.14%(+0.445)#1,117 |
| 84. | Edwardsville | 0.58% | 0.17%(+0.410)#84 | 0.14%(+0.445)#1,118 |
| 85. | Macon | 0.57% | 0.17%(+0.399)#85 | 0.14%(+0.435)#1,134 |
| 86. | Trout Valley | 0.57% | 0.17%(+0.395)#86 | 0.14%(+0.431)#1,147 |
| 87. | Indian Creek | 0.56% | 0.17%(+0.387)#87 | 0.14%(+0.423)#1,172 |
| 88. | Wyoming | 0.56% | 0.17%(+0.385)#88 | 0.14%(+0.421)#1,177 |
| 89. | Sterling | 0.56% | 0.17%(+0.384)#89 | 0.14%(+0.420)#1,179 |
| 90. | Darien | 0.56% | 0.17%(+0.383)#90 | 0.14%(+0.419)#1,183 |
| 91. | Washburn | 0.56% | 0.17%(+0.382)#91 | 0.14%(+0.418)#1,186 |
| 92. | Troy | 0.56% | 0.17%(+0.382)#92 | 0.14%(+0.418)#1,187 |
| 93. | South Elgin | 0.56% | 0.17%(+0.381)#93 | 0.14%(+0.417)#1,191 |
| 94. | Sycamore | 0.55% | 0.17%(+0.379)#94 | 0.14%(+0.415)#1,194 |
| 95. | Carrier Mills | 0.55% | 0.17%(+0.374)#95 | 0.14%(+0.410)#1,206 |
| 96. | Dalton City | 0.54% | 0.17%(+0.363)#96 | 0.14%(+0.399)#1,232 |
| 97. | Warrensburg | 0.53% | 0.17%(+0.355)#97 | 0.14%(+0.390)#1,255 |
| 98. | Huntley | 0.53% | 0.17%(+0.354)#98 | 0.14%(+0.390)#1,256 |
| 99. | Villa Park | 0.52% | 0.17%(+0.350)#99 | 0.14%(+0.386)#1,264 |
| 100. | Hampton | 0.51% | 0.17%(+0.337)#100 | 0.14%(+0.373)#1,292 |
Common Questions
What are the Top 10 Cities with the Highest Percentage of Population Employed in Enterprise Management in Illinois?
Top 10 Cities with the Highest Percentage of Population Employed in Enterprise Management in Illinois are:
#1
3.8%
#2
3.5%
#3
3.3%
#4
3.2%
#5
2.8%
#6
2.7%
#7
2.7%
#8
2.6%
#9
2.5%
#10
2.4%
What city has the Highest Percentage of Population Employed in Enterprise Management in Illinois?
Chillicothe has the Highest Percentage of Population Employed in Enterprise Management in Illinois with 3.8%.
What is the Percentage of Population Employed in Enterprise Management in the State of Illinois?
Percentage of Population Employed in Enterprise Management in Illinois is 0.17%.
What is the Percentage of Population Employed in Enterprise Management in the United States?
Percentage of Population Employed in Enterprise Management in the United States is 0.14%.