Cities with the Highest Percentage of Population Employed in Administrative & Support Services in Illinois
RELATED REPORTS & OPTIONS
Administrative & Support Services
Illinois
Compare Cities
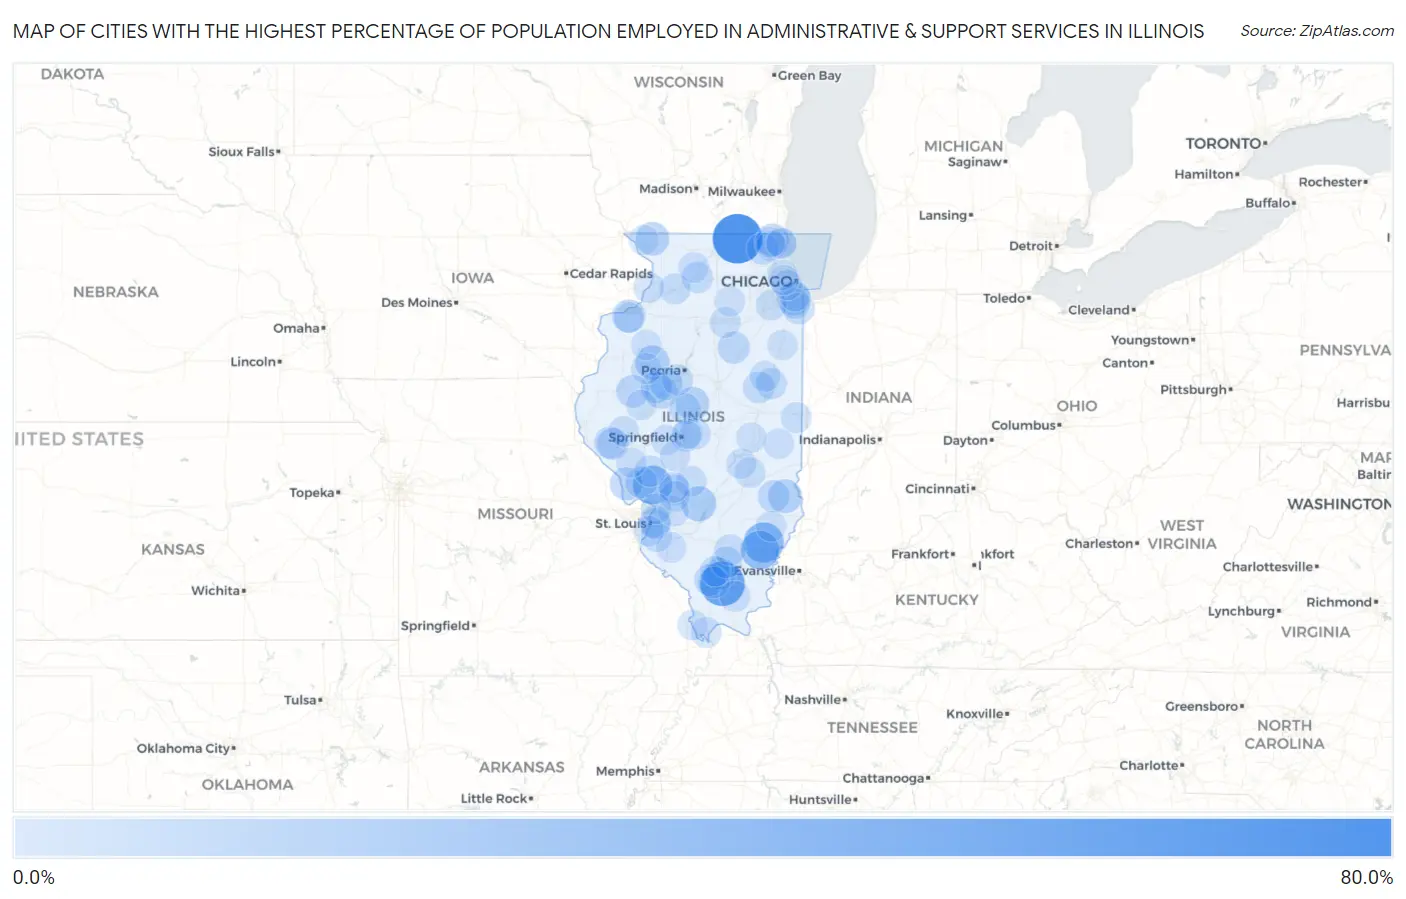
Map of Cities with the Highest Percentage of Population Employed in Administrative & Support Services in Illinois
0.0%
80.0%
Cities with the Highest Percentage of Population Employed in Administrative & Support Services in Illinois
| City | % Employed | vs State | vs National | |
| 1. | Chemung | 75.0% | 4.0%(+71.0)#1 | 4.1%(+70.9)#20 |
| 2. | Whiteash | 57.4% | 4.0%(+53.4)#2 | 4.1%(+53.3)#37 |
| 3. | Wedron | 54.7% | 4.0%(+50.6)#3 | 4.1%(+50.5)#40 |
| 4. | Golden Gate | 42.1% | 4.0%(+38.1)#4 | 4.1%(+38.0)#92 |
| 5. | Fidelity | 38.5% | 4.0%(+34.4)#5 | 4.1%(+34.3)#114 |
| 6. | Burnt Prairie | 36.2% | 4.0%(+32.2)#6 | 4.1%(+32.1)#122 |
| 7. | Marcelline | 29.6% | 4.0%(+25.6)#7 | 4.1%(+25.5)#187 |
| 8. | Gulfport | 28.3% | 4.0%(+24.2)#8 | 4.1%(+24.1)#220 |
| 9. | Smithboro | 24.4% | 4.0%(+20.4)#9 | 4.1%(+20.3)#302 |
| 10. | Maquon | 22.1% | 4.0%(+18.1)#10 | 4.1%(+18.0)#373 |
| 11. | Smithville | 20.7% | 4.0%(+16.6)#11 | 4.1%(+16.5)#416 |
| 12. | Stoy | 20.5% | 4.0%(+16.5)#12 | 4.1%(+16.4)#421 |
| 13. | Hartsburg | 20.0% | 4.0%(+16.0)#13 | 4.1%(+15.9)#434 |
| 14. | Apple Canyon Lake | 19.2% | 4.0%(+15.2)#14 | 4.1%(+15.1)#477 |
| 15. | Dixmoor | 19.1% | 4.0%(+15.0)#15 | 4.1%(+14.9)#485 |
| 16. | Lowpoint | 18.8% | 4.0%(+14.7)#16 | 4.1%(+14.6)#496 |
| 17. | Oak Grove | 18.5% | 4.0%(+14.5)#17 | 4.1%(+14.3)#508 |
| 18. | Prairietown | 17.9% | 4.0%(+13.9)#18 | 4.1%(+13.7)#550 |
| 19. | Hardin | 17.3% | 4.0%(+13.3)#19 | 4.1%(+13.2)#587 |
| 20. | Venetian Village | 17.1% | 4.0%(+13.1)#20 | 4.1%(+12.9)#601 |
| 21. | Ridgewood | 17.0% | 4.0%(+13.0)#21 | 4.1%(+12.9)#609 |
| 22. | Adair | 16.6% | 4.0%(+12.6)#22 | 4.1%(+12.4)#640 |
| 23. | Rest Haven | 16.4% | 4.0%(+12.4)#23 | 4.1%(+12.2)#655 |
| 24. | Liverpool | 16.3% | 4.0%(+12.3)#24 | 4.1%(+12.1)#663 |
| 25. | Banner | 15.8% | 4.0%(+11.8)#25 | 4.1%(+11.6)#700 |
| 26. | Cornell | 15.2% | 4.0%(+11.2)#26 | 4.1%(+11.1)#771 |
| 27. | Burtons Bridge | 14.5% | 4.0%(+10.4)#27 | 4.1%(+10.3)#870 |
| 28. | Willow Hill | 14.3% | 4.0%(+10.3)#28 | 4.1%(+10.1)#901 |
| 29. | Bryant | 14.1% | 4.0%(+10.1)#29 | 4.1%(+9.97)#929 |
| 30. | Baylis | 13.8% | 4.0%(+9.83)#30 | 4.1%(+9.70)#967 |
| 31. | New Salem | 13.7% | 4.0%(+9.71)#31 | 4.1%(+9.58)#990 |
| 32. | Holiday Hills | 13.6% | 4.0%(+9.62)#32 | 4.1%(+9.49)#1,004 |
| 33. | Orient | 13.6% | 4.0%(+9.62)#33 | 4.1%(+9.49)#1,007 |
| 34. | Hurst | 13.6% | 4.0%(+9.60)#34 | 4.1%(+9.47)#1,012 |
| 35. | Kane | 13.5% | 4.0%(+9.52)#35 | 4.1%(+9.39)#1,029 |
| 36. | Elliott | 13.3% | 4.0%(+9.26)#36 | 4.1%(+9.13)#1,069 |
| 37. | Fairmont City | 13.1% | 4.0%(+9.09)#37 | 4.1%(+8.96)#1,096 |
| 38. | Colp | 13.0% | 4.0%(+8.97)#38 | 4.1%(+8.84)#1,121 |
| 39. | Campbell's Island | 12.8% | 4.0%(+8.78)#39 | 4.1%(+8.64)#1,155 |
| 40. | New Holland | 12.7% | 4.0%(+8.69)#40 | 4.1%(+8.56)#1,175 |
| 41. | Ewing | 12.4% | 4.0%(+8.42)#41 | 4.1%(+8.29)#1,223 |
| 42. | Ford Heights | 12.4% | 4.0%(+8.39)#42 | 4.1%(+8.26)#1,227 |
| 43. | Greenfield | 12.2% | 4.0%(+8.20)#43 | 4.1%(+8.07)#1,264 |
| 44. | Loda | 12.2% | 4.0%(+8.20)#44 | 4.1%(+8.06)#1,266 |
| 45. | Opdyke | 12.2% | 4.0%(+8.18)#45 | 4.1%(+8.05)#1,269 |
| 46. | Lost Nation | 12.1% | 4.0%(+8.04)#46 | 4.1%(+7.91)#1,299 |
| 47. | Buffalo | 11.8% | 4.0%(+7.78)#47 | 4.1%(+7.65)#1,356 |
| 48. | Como | 11.6% | 4.0%(+7.59)#48 | 4.1%(+7.46)#1,400 |
| 49. | Mapleton | 11.4% | 4.0%(+7.39)#49 | 4.1%(+7.26)#1,442 |
| 50. | Moro | 11.3% | 4.0%(+7.27)#50 | 4.1%(+7.14)#1,467 |
| 51. | Millstadt | 11.3% | 4.0%(+7.24)#51 | 4.1%(+7.10)#1,477 |
| 52. | Fairmont | 11.1% | 4.0%(+7.10)#52 | 4.1%(+6.97)#1,507 |
| 53. | Stonefort | 11.0% | 4.0%(+6.94)#53 | 4.1%(+6.81)#1,563 |
| 54. | Mounds | 10.7% | 4.0%(+6.70)#54 | 4.1%(+6.56)#1,633 |
| 55. | Naplate | 10.7% | 4.0%(+6.67)#55 | 4.1%(+6.53)#1,638 |
| 56. | Hillsboro | 10.5% | 4.0%(+6.52)#56 | 4.1%(+6.38)#1,682 |
| 57. | Alexander | 10.5% | 4.0%(+6.44)#57 | 4.1%(+6.31)#1,718 |
| 58. | East St Louis | 10.4% | 4.0%(+6.37)#58 | 4.1%(+6.24)#1,745 |
| 59. | Belgium | 10.4% | 4.0%(+6.35)#59 | 4.1%(+6.22)#1,752 |
| 60. | Neoga | 10.3% | 4.0%(+6.27)#60 | 4.1%(+6.14)#1,785 |
| 61. | London Mills | 10.1% | 4.0%(+6.05)#61 | 4.1%(+5.92)#1,872 |
| 62. | Clear Lake | 10.1% | 4.0%(+6.05)#62 | 4.1%(+5.92)#1,873 |
| 63. | Albany | 10.1% | 4.0%(+6.05)#63 | 4.1%(+5.92)#1,874 |
| 64. | Roberts | 10.1% | 4.0%(+6.03)#64 | 4.1%(+5.90)#1,881 |
| 65. | Mount Morris | 10.0% | 4.0%(+5.95)#65 | 4.1%(+5.82)#1,929 |
| 66. | White City | 9.9% | 4.0%(+5.91)#66 | 4.1%(+5.77)#1,943 |
| 67. | Marine | 9.9% | 4.0%(+5.88)#67 | 4.1%(+5.75)#1,951 |
| 68. | Round Lake Park | 9.9% | 4.0%(+5.87)#68 | 4.1%(+5.74)#1,957 |
| 69. | Williamson | 9.9% | 4.0%(+5.84)#69 | 4.1%(+5.71)#1,969 |
| 70. | Parkersburg | 9.8% | 4.0%(+5.80)#70 | 4.1%(+5.67)#1,985 |
| 71. | Preemption | 9.7% | 4.0%(+5.66)#71 | 4.1%(+5.53)#2,045 |
| 72. | Westlake | 9.6% | 4.0%(+5.58)#72 | 4.1%(+5.45)#2,075 |
| 73. | Eagarville | 9.6% | 4.0%(+5.57)#73 | 4.1%(+5.44)#2,081 |
| 74. | Lenzburg | 9.5% | 4.0%(+5.51)#74 | 4.1%(+5.37)#2,108 |
| 75. | East Hazel Crest | 9.5% | 4.0%(+5.48)#75 | 4.1%(+5.35)#2,122 |
| 76. | Christopher | 9.4% | 4.0%(+5.38)#76 | 4.1%(+5.25)#2,170 |
| 77. | Brocton | 9.4% | 4.0%(+5.36)#77 | 4.1%(+5.23)#2,182 |
| 78. | Dupo | 9.3% | 4.0%(+5.32)#78 | 4.1%(+5.19)#2,192 |
| 79. | Calumet Park | 9.3% | 4.0%(+5.31)#79 | 4.1%(+5.17)#2,199 |
| 80. | Thebes | 9.3% | 4.0%(+5.30)#80 | 4.1%(+5.17)#2,201 |
| 81. | Waukegan | 9.2% | 4.0%(+5.21)#81 | 4.1%(+5.08)#2,245 |
| 82. | Schiller Park | 9.2% | 4.0%(+5.16)#82 | 4.1%(+5.02)#2,277 |
| 83. | Astoria | 9.1% | 4.0%(+5.13)#83 | 4.1%(+4.99)#2,285 |
| 84. | Park City | 9.1% | 4.0%(+5.12)#84 | 4.1%(+4.98)#2,293 |
| 85. | Hartford | 9.1% | 4.0%(+5.11)#85 | 4.1%(+4.98)#2,296 |
| 86. | Berlin | 9.1% | 4.0%(+5.07)#86 | 4.1%(+4.94)#2,326 |
| 87. | Stickney | 9.0% | 4.0%(+5.03)#87 | 4.1%(+4.90)#2,351 |
| 88. | Versailles | 9.0% | 4.0%(+5.02)#88 | 4.1%(+4.88)#2,360 |
| 89. | Thayer | 8.9% | 4.0%(+4.92)#89 | 4.1%(+4.79)#2,408 |
| 90. | Windsor | 8.9% | 4.0%(+4.92)#90 | 4.1%(+4.79)#2,411 |
| 91. | Wataga | 8.9% | 4.0%(+4.88)#91 | 4.1%(+4.75)#2,434 |
| 92. | Round Lake Beach | 8.9% | 4.0%(+4.87)#92 | 4.1%(+4.74)#2,439 |
| 93. | Leland | 8.9% | 4.0%(+4.84)#93 | 4.1%(+4.71)#2,461 |
| 94. | Sammons Point | 8.8% | 4.0%(+4.77)#94 | 4.1%(+4.64)#2,500 |
| 95. | Garrett | 8.7% | 4.0%(+4.68)#95 | 4.1%(+4.55)#2,559 |
| 96. | Hillview | 8.6% | 4.0%(+4.60)#96 | 4.1%(+4.47)#2,608 |
| 97. | The Galena Territory | 8.6% | 4.0%(+4.59)#97 | 4.1%(+4.45)#2,617 |
| 98. | Riverton | 8.5% | 4.0%(+4.53)#98 | 4.1%(+4.39)#2,658 |
| 99. | Maywood | 8.4% | 4.0%(+4.43)#99 | 4.1%(+4.29)#2,709 |
| 100. | Coyne Center | 8.4% | 4.0%(+4.36)#100 | 4.1%(+4.23)#2,750 |
Common Questions
What are the Top 10 Cities with the Highest Percentage of Population Employed in Administrative & Support Services in Illinois?
Top 10 Cities with the Highest Percentage of Population Employed in Administrative & Support Services in Illinois are:
#1
75.0%
#2
57.4%
#3
42.1%
#4
38.5%
#5
36.2%
#6
24.4%
#7
22.1%
#8
20.5%
#9
20.0%
#10
19.2%
What city has the Highest Percentage of Population Employed in Administrative & Support Services in Illinois?
Chemung has the Highest Percentage of Population Employed in Administrative & Support Services in Illinois with 75.0%.
What is the Percentage of Population Employed in Administrative & Support Services in the State of Illinois?
Percentage of Population Employed in Administrative & Support Services in Illinois is 4.0%.
What is the Percentage of Population Employed in Administrative & Support Services in the United States?
Percentage of Population Employed in Administrative & Support Services in the United States is 4.1%.