Cities with the Highest Inequality / Gini Index in Illinois
RELATED REPORTS & OPTIONS
Highest Inequality / Gini Index
Illinois
Compare Cities
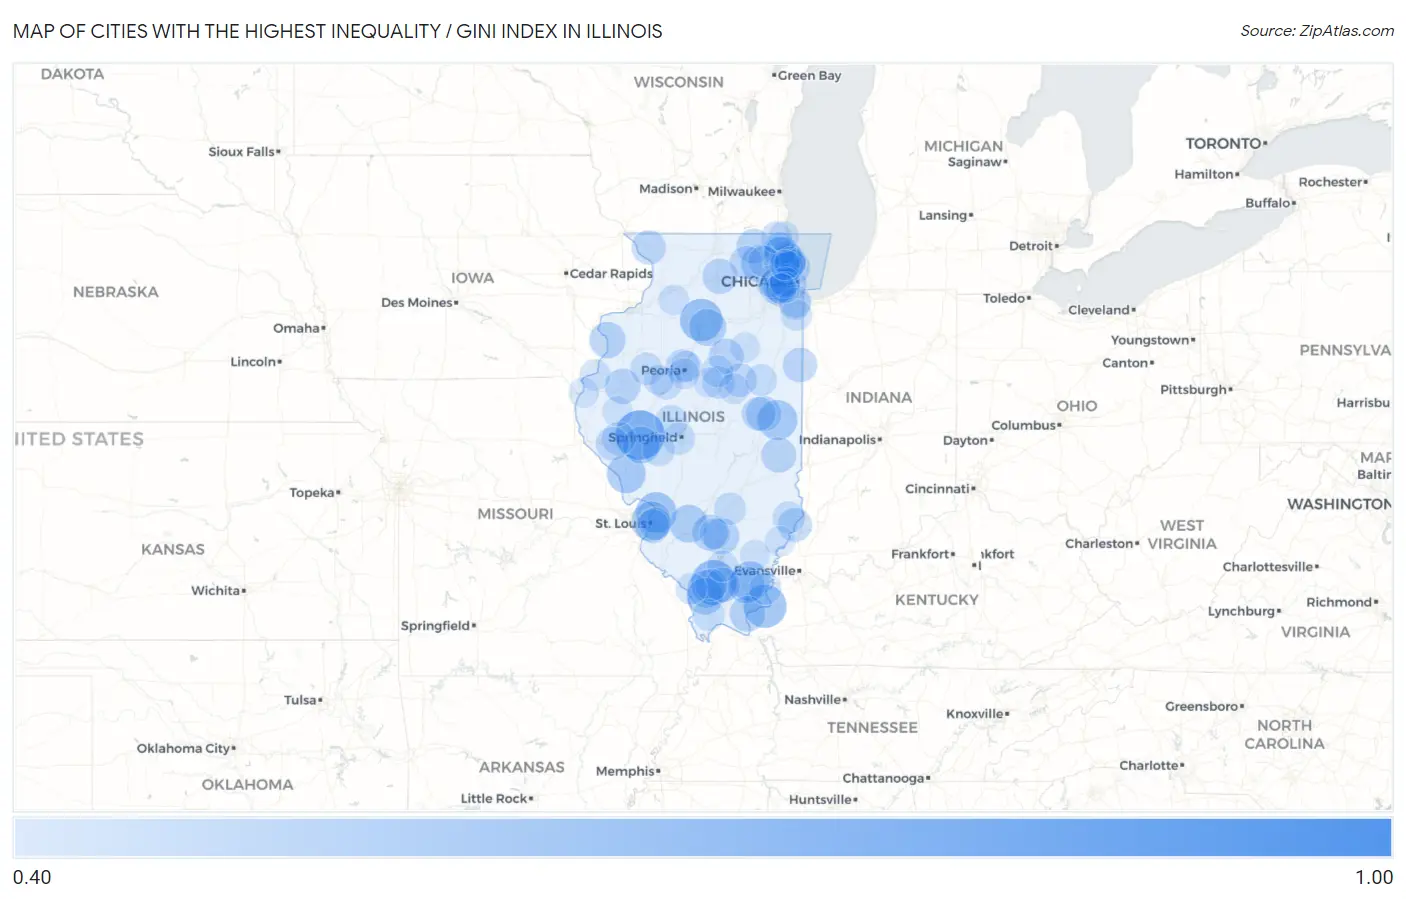
Map of Cities with the Highest Inequality / Gini Index in Illinois
0.00
1.00
Cities with the Highest Inequality / Gini Index in Illinois
| City | Inequality / Gini Index | vs State | vs National | |
| 1. | Janesville | 0.83 | 0.48(+0.352)#1 | 0.48(+0.350)#2 |
| 2. | Serena | 0.78 | 0.48(+0.301)#2 | 0.48(+0.300)#10 |
| 3. | Galt | 0.75 | 0.48(+0.272)#3 | 0.48(+0.270)#19 |
| 4. | Concord | 0.69 | 0.48(+0.213)#4 | 0.48(+0.211)#75 |
| 5. | Colp | 0.65 | 0.48(+0.164)#5 | 0.48(+0.162)#177 |
| 6. | Cave In Rock | 0.63 | 0.48(+0.145)#6 | 0.48(+0.143)#244 |
| 7. | Hollowayville | 0.62 | 0.48(+0.140)#7 | 0.48(+0.138)#271 |
| 8. | Mitchell | 0.60 | 0.48(+0.119)#8 | 0.48(+0.117)#409 |
| 9. | Homer | 0.59 | 0.48(+0.111)#9 | 0.48(+0.109)#489 |
| 10. | Eldorado | 0.59 | 0.48(+0.110)#10 | 0.48(+0.109)#492 |
| 11. | Brooklyn | 0.59 | 0.48(+0.109)#11 | 0.48(+0.107)#510 |
| 12. | Kampsville | 0.58 | 0.48(+0.101)#12 | 0.48(+0.099)#595 |
| 13. | Bannockburn | 0.58 | 0.48(+0.100)#13 | 0.48(+0.098)#614 |
| 14. | Breese | 0.57 | 0.48(+0.090)#14 | 0.48(+0.089)#738 |
| 15. | Carbondale | 0.57 | 0.48(+0.090)#15 | 0.48(+0.088)#743 |
| 16. | East Dundee | 0.57 | 0.48(+0.090)#16 | 0.48(+0.088)#744 |
| 17. | Standard | 0.57 | 0.48(+0.085)#17 | 0.48(+0.083)#820 |
| 18. | Lynnville | 0.56 | 0.48(+0.083)#18 | 0.48(+0.082)#844 |
| 19. | Muddy | 0.56 | 0.48(+0.079)#19 | 0.48(+0.078)#911 |
| 20. | Clarendon Hills | 0.56 | 0.48(+0.078)#20 | 0.48(+0.076)#936 |
| 21. | Makanda | 0.56 | 0.48(+0.078)#21 | 0.48(+0.076)#938 |
| 22. | Northfield | 0.56 | 0.48(+0.077)#22 | 0.48(+0.076)#958 |
| 23. | Keithsburg | 0.55 | 0.48(+0.074)#23 | 0.48(+0.072)#1,034 |
| 24. | Dix | 0.55 | 0.48(+0.073)#24 | 0.48(+0.071)#1,053 |
| 25. | Wamac | 0.55 | 0.48(+0.071)#25 | 0.48(+0.069)#1,105 |
| 26. | Lowpoint | 0.55 | 0.48(+0.070)#26 | 0.48(+0.069)#1,118 |
| 27. | Golconda | 0.55 | 0.48(+0.068)#27 | 0.48(+0.067)#1,152 |
| 28. | Evanston | 0.55 | 0.48(+0.067)#28 | 0.48(+0.066)#1,172 |
| 29. | Macomb | 0.55 | 0.48(+0.065)#29 | 0.48(+0.063)#1,225 |
| 30. | Solon Mills | 0.55 | 0.48(+0.065)#30 | 0.48(+0.063)#1,237 |
| 31. | Glencoe | 0.55 | 0.48(+0.064)#31 | 0.48(+0.062)#1,249 |
| 32. | Urbana | 0.54 | 0.48(+0.063)#32 | 0.48(+0.062)#1,270 |
| 33. | Kansas | 0.54 | 0.48(+0.062)#33 | 0.48(+0.060)#1,314 |
| 34. | Flanagan | 0.54 | 0.48(+0.062)#34 | 0.48(+0.060)#1,318 |
| 35. | Creston | 0.54 | 0.48(+0.061)#35 | 0.48(+0.060)#1,325 |
| 36. | Spillertown | 0.54 | 0.48(+0.060)#36 | 0.48(+0.058)#1,374 |
| 37. | Bull Valley | 0.54 | 0.48(+0.057)#37 | 0.48(+0.055)#1,447 |
| 38. | Sheldon | 0.54 | 0.48(+0.056)#38 | 0.48(+0.055)#1,456 |
| 39. | Elizabeth | 0.54 | 0.48(+0.054)#39 | 0.48(+0.052)#1,527 |
| 40. | Oak Brook | 0.53 | 0.48(+0.052)#40 | 0.48(+0.050)#1,598 |
| 41. | St Francisville | 0.53 | 0.48(+0.049)#41 | 0.48(+0.048)#1,669 |
| 42. | Champaign | 0.53 | 0.48(+0.049)#42 | 0.48(+0.047)#1,683 |
| 43. | Peoria | 0.53 | 0.48(+0.049)#43 | 0.48(+0.047)#1,696 |
| 44. | Sauget | 0.53 | 0.48(+0.048)#44 | 0.48(+0.047)#1,713 |
| 45. | Colfax | 0.53 | 0.48(+0.047)#45 | 0.48(+0.045)#1,768 |
| 46. | Chicago | 0.53 | 0.48(+0.046)#46 | 0.48(+0.045)#1,776 |
| 47. | Perry | 0.53 | 0.48(+0.046)#47 | 0.48(+0.045)#1,787 |
| 48. | New Salem | 0.53 | 0.48(+0.046)#48 | 0.48(+0.044)#1,801 |
| 49. | Hampshire | 0.52 | 0.48(+0.043)#49 | 0.48(+0.041)#1,921 |
| 50. | Normal | 0.52 | 0.48(+0.038)#50 | 0.48(+0.036)#2,131 |
| 51. | Petersburg | 0.52 | 0.48(+0.037)#51 | 0.48(+0.035)#2,161 |
| 52. | East St Louis | 0.52 | 0.48(+0.037)#52 | 0.48(+0.035)#2,165 |
| 53. | Burr Ridge | 0.52 | 0.48(+0.035)#53 | 0.48(+0.034)#2,233 |
| 54. | Leland Grove | 0.52 | 0.48(+0.035)#54 | 0.48(+0.034)#2,236 |
| 55. | Highland Park | 0.52 | 0.48(+0.035)#55 | 0.48(+0.033)#2,251 |
| 56. | Green Oaks | 0.52 | 0.48(+0.035)#56 | 0.48(+0.033)#2,258 |
| 57. | Cambria | 0.51 | 0.48(+0.034)#57 | 0.48(+0.032)#2,328 |
| 58. | London Mills | 0.51 | 0.48(+0.034)#58 | 0.48(+0.032)#2,330 |
| 59. | Harvey | 0.51 | 0.48(+0.033)#59 | 0.48(+0.031)#2,350 |
| 60. | Farina | 0.51 | 0.48(+0.033)#60 | 0.48(+0.031)#2,357 |
| 61. | Franklin | 0.51 | 0.48(+0.033)#61 | 0.48(+0.031)#2,358 |
| 62. | Bridgeport | 0.51 | 0.48(+0.033)#62 | 0.48(+0.031)#2,360 |
| 63. | River Forest | 0.51 | 0.48(+0.031)#63 | 0.48(+0.029)#2,430 |
| 64. | Mettawa | 0.51 | 0.48(+0.031)#64 | 0.48(+0.029)#2,454 |
| 65. | Shawneetown | 0.51 | 0.48(+0.030)#65 | 0.48(+0.029)#2,473 |
| 66. | East Hazel Crest | 0.51 | 0.48(+0.030)#66 | 0.48(+0.028)#2,483 |
| 67. | Banner | 0.51 | 0.48(+0.029)#67 | 0.48(+0.027)#2,538 |
| 68. | Kappa | 0.51 | 0.48(+0.029)#68 | 0.48(+0.027)#2,556 |
| 69. | Dongola | 0.51 | 0.48(+0.029)#69 | 0.48(+0.027)#2,560 |
| 70. | Glen Ellyn | 0.51 | 0.48(+0.028)#70 | 0.48(+0.026)#2,606 |
| 71. | Melvin | 0.51 | 0.48(+0.028)#71 | 0.48(+0.026)#2,609 |
| 72. | Baileyville | 0.51 | 0.48(+0.027)#72 | 0.48(+0.025)#2,653 |
| 73. | Gorham | 0.51 | 0.48(+0.026)#73 | 0.48(+0.024)#2,703 |
| 74. | Wilmette | 0.51 | 0.48(+0.026)#74 | 0.48(+0.024)#2,718 |
| 75. | Crete | 0.51 | 0.48(+0.025)#75 | 0.48(+0.023)#2,745 |
| 76. | Old Mill Creek | 0.51 | 0.48(+0.024)#76 | 0.48(+0.023)#2,795 |
| 77. | Golf | 0.50 | 0.48(+0.023)#77 | 0.48(+0.021)#2,862 |
| 78. | Peoria Heights | 0.50 | 0.48(+0.023)#78 | 0.48(+0.021)#2,884 |
| 79. | Benton | 0.50 | 0.48(+0.022)#79 | 0.48(+0.021)#2,899 |
| 80. | Barrington Hills | 0.50 | 0.48(+0.022)#80 | 0.48(+0.021)#2,905 |
| 81. | Dallas City | 0.50 | 0.48(+0.022)#81 | 0.48(+0.020)#2,925 |
| 82. | Hinsdale | 0.50 | 0.48(+0.022)#82 | 0.48(+0.020)#2,948 |
| 83. | Winnetka | 0.50 | 0.48(+0.021)#83 | 0.48(+0.019)#2,965 |
| 84. | Walnut Hill | 0.50 | 0.48(+0.020)#84 | 0.48(+0.018)#3,033 |
| 85. | Creve Coeur | 0.50 | 0.48(+0.019)#85 | 0.48(+0.018)#3,063 |
| 86. | Summit | 0.50 | 0.48(+0.019)#86 | 0.48(+0.017)#3,093 |
| 87. | North Riverside | 0.50 | 0.48(+0.018)#87 | 0.48(+0.016)#3,163 |
| 88. | Indian Head Park | 0.50 | 0.48(+0.017)#88 | 0.48(+0.016)#3,178 |
| 89. | Riggston | 0.50 | 0.48(+0.017)#89 | 0.48(+0.015)#3,200 |
| 90. | Ellsworth | 0.50 | 0.48(+0.017)#90 | 0.48(+0.015)#3,209 |
| 91. | Tampico | 0.50 | 0.48(+0.017)#91 | 0.48(+0.015)#3,215 |
| 92. | Canton | 0.50 | 0.48(+0.016)#92 | 0.48(+0.015)#3,238 |
| 93. | Zion | 0.50 | 0.48(+0.016)#93 | 0.48(+0.014)#3,241 |
| 94. | Bellmont | 0.50 | 0.48(+0.014)#94 | 0.48(+0.013)#3,354 |
| 95. | Odell | 0.50 | 0.48(+0.014)#95 | 0.48(+0.012)#3,379 |
| 96. | Danvers | 0.49 | 0.48(+0.014)#96 | 0.48(+0.012)#3,401 |
| 97. | Hamilton | 0.49 | 0.48(+0.013)#97 | 0.48(+0.011)#3,461 |
| 98. | Camden | 0.49 | 0.48(+0.012)#98 | 0.48(+0.011)#3,498 |
| 99. | Glenview | 0.49 | 0.48(+0.012)#99 | 0.48(+0.011)#3,500 |
| 100. | Springerton | 0.49 | 0.48(+0.012)#100 | 0.48(+0.010)#3,538 |
Common Questions
What are the Top 10 Cities with the Highest Inequality / Gini Index in Illinois?
Top 10 Cities with the Highest Inequality / Gini Index in Illinois are:
#1
0.69
#2
0.65
#3
0.63
#4
0.62
#5
0.60
#6
0.59
#7
0.59
#8
0.59
#9
0.58
#10
0.58
What city has the Highest Inequality / Gini Index in Illinois?
Concord has the Highest Inequality / Gini Index in Illinois with 0.69.
What is the Inequality / Gini Index in the State of Illinois?
Inequality / Gini Index in Illinois is 0.48.
What is the Inequality / Gini Index in the United States?
Inequality / Gini Index in the United States is 0.48.