Cities with the Highest Percentage of Scandinavian Population in Illinois
RELATED REPORTS & OPTIONS
Scandinavian
Illinois
Compare Cities
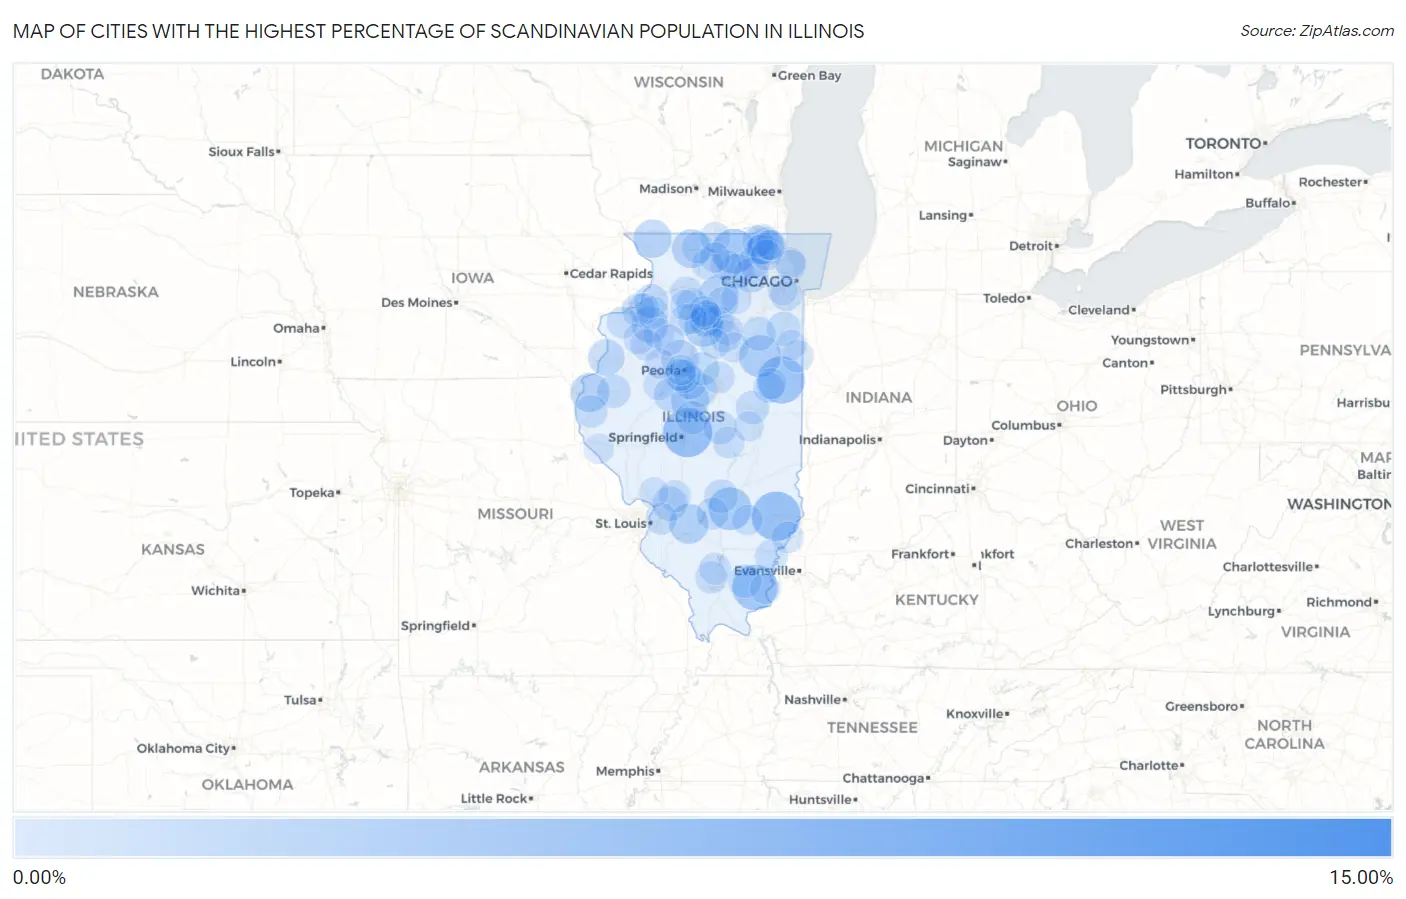
Map of Cities with the Highest Percentage of Scandinavian Population in Illinois
0.00%
15.00%
Cities with the Highest Percentage of Scandinavian Population in Illinois
| City | Scandinavian | vs State | vs National | |
| 1. | Cameron | 13.60% | 0.22%(+13.4)#1 | 0.30%(+13.3)#73 |
| 2. | Spaulding | 5.70% | 0.22%(+5.48)#2 | 0.30%(+5.40)#278 |
| 3. | Claremont | 5.66% | 0.22%(+5.44)#3 | 0.30%(+5.36)#280 |
| 4. | Cissna Park | 5.10% | 0.22%(+4.88)#4 | 0.30%(+4.80)#329 |
| 5. | Equality | 4.67% | 0.22%(+4.45)#5 | 0.30%(+4.36)#375 |
| 6. | Garden Prairie | 4.57% | 0.22%(+4.35)#6 | 0.30%(+4.27)#385 |
| 7. | Farina | 4.08% | 0.22%(+3.86)#7 | 0.30%(+3.77)#464 |
| 8. | Cullom | 3.84% | 0.22%(+3.62)#8 | 0.30%(+3.53)#521 |
| 9. | Breese | 3.22% | 0.22%(+3.00)#9 | 0.30%(+2.92)#672 |
| 10. | Paw Paw | 3.06% | 0.22%(+2.84)#10 | 0.30%(+2.75)#717 |
| 11. | Mark | 3.01% | 0.22%(+2.79)#11 | 0.30%(+2.71)#738 |
| 12. | Elvaston | 3.01% | 0.22%(+2.79)#12 | 0.30%(+2.71)#740 |
| 13. | Ridott | 2.94% | 0.22%(+2.72)#13 | 0.30%(+2.64)#766 |
| 14. | Apple Canyon Lake | 2.84% | 0.22%(+2.62)#14 | 0.30%(+2.54)#804 |
| 15. | Emden | 2.82% | 0.22%(+2.60)#15 | 0.30%(+2.52)#818 |
| 16. | Dunlap | 2.68% | 0.22%(+2.46)#16 | 0.30%(+2.38)#883 |
| 17. | Volo | 2.54% | 0.22%(+2.33)#17 | 0.30%(+2.24)#950 |
| 18. | Cambridge | 2.44% | 0.22%(+2.22)#18 | 0.30%(+2.14)#993 |
| 19. | Gladstone | 2.40% | 0.22%(+2.18)#19 | 0.30%(+2.09)#1,023 |
| 20. | Sycamore | 2.04% | 0.22%(+1.82)#20 | 0.30%(+1.74)#1,278 |
| 21. | Campton Hills | 2.04% | 0.22%(+1.82)#21 | 0.30%(+1.73)#1,286 |
| 22. | Hamel | 2.00% | 0.22%(+1.79)#22 | 0.30%(+1.70)#1,310 |
| 23. | Forest City | 1.96% | 0.22%(+1.74)#23 | 0.30%(+1.66)#1,352 |
| 24. | Ladd | 1.83% | 0.22%(+1.61)#24 | 0.30%(+1.52)#1,465 |
| 25. | Hillsdale | 1.81% | 0.22%(+1.59)#25 | 0.30%(+1.51)#1,480 |
| 26. | Manteno | 1.80% | 0.22%(+1.58)#26 | 0.30%(+1.49)#1,500 |
| 27. | Minier | 1.79% | 0.22%(+1.57)#27 | 0.30%(+1.48)#1,510 |
| 28. | South Wilmington | 1.76% | 0.22%(+1.54)#28 | 0.30%(+1.46)#1,538 |
| 29. | Brownstown | 1.74% | 0.22%(+1.52)#29 | 0.30%(+1.43)#1,572 |
| 30. | Tremont | 1.70% | 0.22%(+1.48)#30 | 0.30%(+1.39)#1,610 |
| 31. | Silvis | 1.69% | 0.22%(+1.47)#31 | 0.30%(+1.38)#1,620 |
| 32. | Tennessee | 1.68% | 0.22%(+1.46)#32 | 0.30%(+1.38)#1,630 |
| 33. | Eureka | 1.67% | 0.22%(+1.45)#33 | 0.30%(+1.37)#1,646 |
| 34. | Broadwell | 1.67% | 0.22%(+1.45)#34 | 0.30%(+1.36)#1,654 |
| 35. | Forsyth | 1.66% | 0.22%(+1.44)#35 | 0.30%(+1.36)#1,665 |
| 36. | Mahomet | 1.66% | 0.22%(+1.44)#36 | 0.30%(+1.35)#1,670 |
| 37. | Raleigh | 1.65% | 0.22%(+1.43)#37 | 0.30%(+1.35)#1,674 |
| 38. | Marquette Heights | 1.65% | 0.22%(+1.43)#38 | 0.30%(+1.34)#1,676 |
| 39. | Ohio | 1.61% | 0.22%(+1.39)#39 | 0.30%(+1.30)#1,730 |
| 40. | Spring Valley | 1.52% | 0.22%(+1.30)#40 | 0.30%(+1.22)#1,820 |
| 41. | Crossville | 1.48% | 0.22%(+1.26)#41 | 0.30%(+1.17)#1,879 |
| 42. | Geneseo | 1.45% | 0.22%(+1.23)#42 | 0.30%(+1.14)#1,915 |
| 43. | Loraine | 1.43% | 0.22%(+1.21)#43 | 0.30%(+1.12)#1,948 |
| 44. | Patoka | 1.35% | 0.22%(+1.13)#44 | 0.30%(+1.05)#2,070 |
| 45. | Bartonville | 1.34% | 0.22%(+1.13)#45 | 0.30%(+1.04)#2,080 |
| 46. | Pistakee Highlands | 1.34% | 0.22%(+1.12)#46 | 0.30%(+1.03)#2,102 |
| 47. | North Utica | 1.32% | 0.22%(+1.10)#47 | 0.30%(+1.02)#2,133 |
| 48. | Donovan | 1.32% | 0.22%(+1.10)#48 | 0.30%(+1.01)#2,145 |
| 49. | Royalton | 1.31% | 0.22%(+1.09)#49 | 0.30%(+1.01)#2,153 |
| 50. | Hudson | 1.30% | 0.22%(+1.08)#50 | 0.30%(+0.999)#2,167 |
| 51. | Williamson | 1.30% | 0.22%(+1.08)#51 | 0.30%(+0.994)#2,177 |
| 52. | Worth | 1.30% | 0.22%(+1.08)#52 | 0.30%(+0.994)#2,178 |
| 53. | North City | 1.29% | 0.22%(+1.07)#53 | 0.30%(+0.987)#2,187 |
| 54. | Kangley | 1.28% | 0.22%(+1.06)#54 | 0.30%(+0.978)#2,205 |
| 55. | Harmon | 1.28% | 0.22%(+1.06)#55 | 0.30%(+0.978)#2,206 |
| 56. | Collinsville | 1.27% | 0.22%(+1.05)#56 | 0.30%(+0.963)#2,232 |
| 57. | Pecatonica | 1.26% | 0.22%(+1.04)#57 | 0.30%(+0.957)#2,249 |
| 58. | Mount Carmel | 1.25% | 0.22%(+1.03)#58 | 0.30%(+0.942)#2,284 |
| 59. | Gilberts | 1.21% | 0.22%(+0.991)#59 | 0.30%(+0.906)#2,359 |
| 60. | Dalton City | 1.19% | 0.22%(+0.968)#60 | 0.30%(+0.883)#2,410 |
| 61. | Wataga | 1.18% | 0.22%(+0.958)#61 | 0.30%(+0.872)#2,429 |
| 62. | Cleveland | 1.18% | 0.22%(+0.958)#62 | 0.30%(+0.872)#2,432 |
| 63. | Reynolds | 1.17% | 0.22%(+0.956)#63 | 0.30%(+0.870)#2,436 |
| 64. | Wyanet | 1.16% | 0.22%(+0.940)#64 | 0.30%(+0.855)#2,463 |
| 65. | Ringwood | 1.16% | 0.22%(+0.936)#65 | 0.30%(+0.851)#2,473 |
| 66. | Kirkland | 1.14% | 0.22%(+0.920)#66 | 0.30%(+0.834)#2,506 |
| 67. | Galva | 1.13% | 0.22%(+0.913)#67 | 0.30%(+0.828)#2,523 |
| 68. | Stillman Valley | 1.10% | 0.22%(+0.886)#68 | 0.30%(+0.800)#2,599 |
| 69. | Toulon | 1.10% | 0.22%(+0.878)#69 | 0.30%(+0.792)#2,621 |
| 70. | Paxton | 1.09% | 0.22%(+0.870)#70 | 0.30%(+0.784)#2,640 |
| 71. | Earlville | 1.09% | 0.22%(+0.869)#71 | 0.30%(+0.784)#2,642 |
| 72. | Loda | 1.05% | 0.22%(+0.826)#72 | 0.30%(+0.741)#2,731 |
| 73. | Dunfermline | 1.04% | 0.22%(+0.820)#73 | 0.30%(+0.735)#2,756 |
| 74. | Holiday Hills | 1.04% | 0.22%(+0.817)#74 | 0.30%(+0.731)#2,769 |
| 75. | Winnetka | 1.03% | 0.22%(+0.812)#75 | 0.30%(+0.727)#2,778 |
| 76. | Rio | 1.03% | 0.22%(+0.807)#76 | 0.30%(+0.721)#2,796 |
| 77. | Grand Ridge | 1.01% | 0.22%(+0.793)#77 | 0.30%(+0.707)#2,827 |
| 78. | Rockton | 1.01% | 0.22%(+0.788)#78 | 0.30%(+0.703)#2,838 |
| 79. | Somonauk | 1.00% | 0.22%(+0.783)#79 | 0.30%(+0.697)#2,849 |
| 80. | Yates City | 0.99% | 0.22%(+0.771)#80 | 0.30%(+0.686)#2,881 |
| 81. | Arlington | 0.99% | 0.22%(+0.771)#81 | 0.30%(+0.686)#2,885 |
| 82. | Prairie Grove | 0.97% | 0.22%(+0.747)#82 | 0.30%(+0.662)#2,943 |
| 83. | Flora | 0.96% | 0.22%(+0.738)#83 | 0.30%(+0.653)#2,963 |
| 84. | Lake Barrington | 0.95% | 0.22%(+0.730)#84 | 0.30%(+0.644)#2,983 |
| 85. | Kenilworth | 0.95% | 0.22%(+0.727)#85 | 0.30%(+0.642)#2,992 |
| 86. | New Milford | 0.94% | 0.22%(+0.724)#86 | 0.30%(+0.639)#2,999 |
| 87. | West Peoria | 0.94% | 0.22%(+0.723)#87 | 0.30%(+0.637)#3,010 |
| 88. | Hainesville | 0.93% | 0.22%(+0.711)#88 | 0.30%(+0.626)#3,034 |
| 89. | Shawneetown | 0.93% | 0.22%(+0.711)#89 | 0.30%(+0.626)#3,036 |
| 90. | Princeton | 0.93% | 0.22%(+0.710)#90 | 0.30%(+0.625)#3,037 |
| 91. | Cornell | 0.91% | 0.22%(+0.692)#91 | 0.30%(+0.607)#3,093 |
| 92. | Walnut | 0.89% | 0.22%(+0.671)#92 | 0.30%(+0.586)#3,168 |
| 93. | New Canton | 0.88% | 0.22%(+0.658)#93 | 0.30%(+0.573)#3,210 |
| 94. | Hodgkins | 0.88% | 0.22%(+0.656)#94 | 0.30%(+0.571)#3,216 |
| 95. | St Anne | 0.87% | 0.22%(+0.655)#95 | 0.30%(+0.569)#3,226 |
| 96. | Cherry | 0.87% | 0.22%(+0.651)#96 | 0.30%(+0.565)#3,239 |
| 97. | Brighton | 0.86% | 0.22%(+0.642)#97 | 0.30%(+0.556)#3,267 |
| 98. | Wenona | 0.86% | 0.22%(+0.641)#98 | 0.30%(+0.555)#3,271 |
| 99. | Round Lake | 0.84% | 0.22%(+0.622)#99 | 0.30%(+0.536)#3,336 |
| 100. | Ivesdale | 0.84% | 0.22%(+0.621)#100 | 0.30%(+0.536)#3,341 |
Common Questions
What are the Top 10 Cities with the Highest Percentage of Scandinavian Population in Illinois?
Top 10 Cities with the Highest Percentage of Scandinavian Population in Illinois are:
#1
5.70%
#2
5.66%
#3
5.10%
#4
4.67%
#5
4.57%
#6
4.08%
#7
3.84%
#8
3.22%
#9
3.06%
#10
3.01%
What city has the Highest Percentage of Scandinavian Population in Illinois?
Spaulding has the Highest Percentage of Scandinavian Population in Illinois with 5.70%.
What is the Percentage of Scandinavian Population in the State of Illinois?
Percentage of Scandinavian Population in Illinois is 0.22%.
What is the Percentage of Scandinavian Population in the United States?
Percentage of Scandinavian Population in the United States is 0.30%.