Cities with the Highest Percentage of Population Employed in Production in Illinois
RELATED REPORTS & OPTIONS
Production
Illinois
Compare Cities
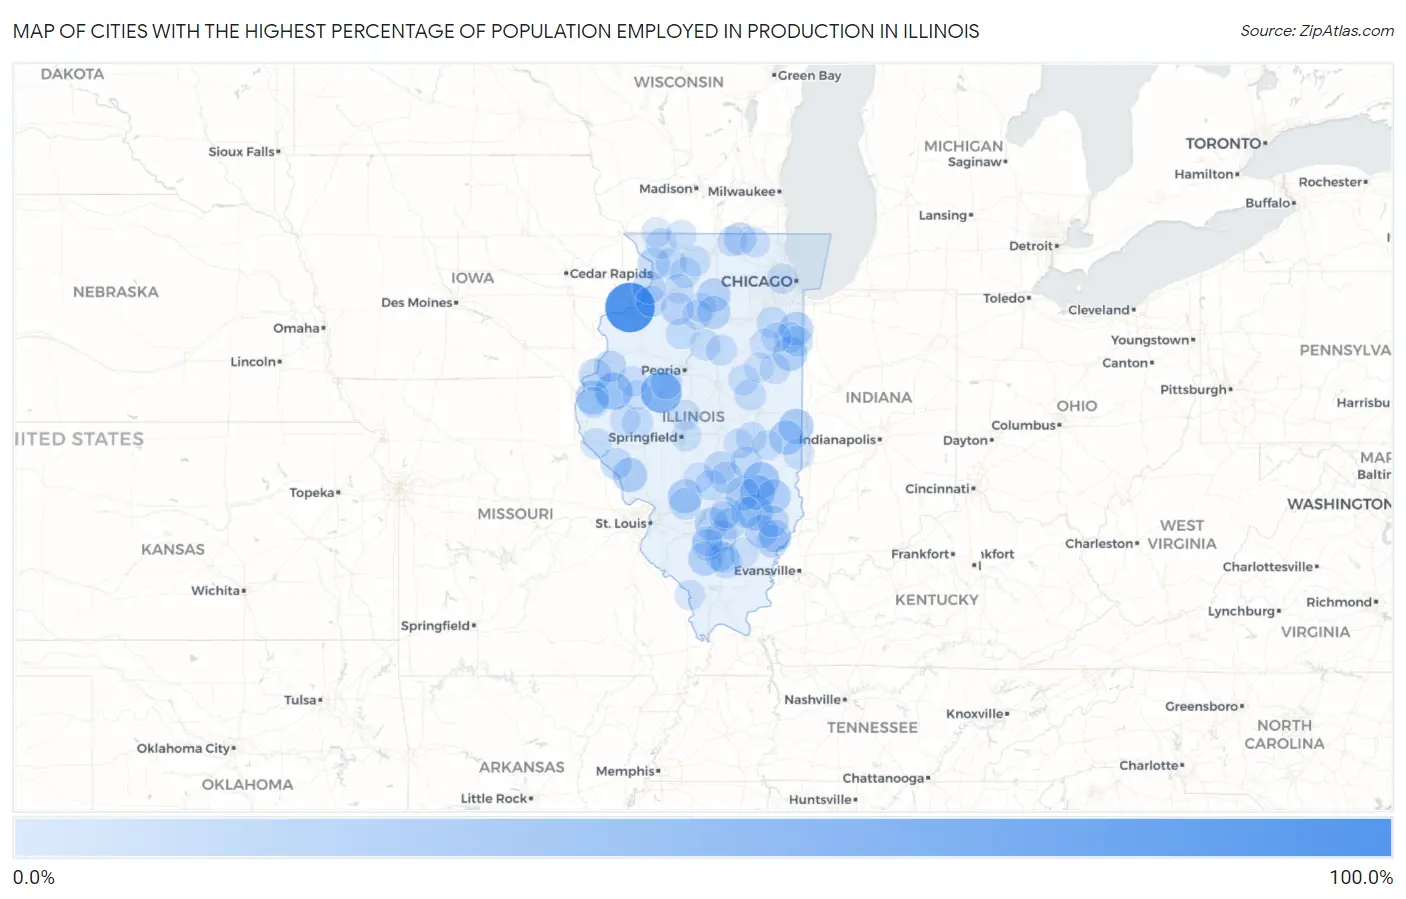
Map of Cities with the Highest Percentage of Population Employed in Production in Illinois
0.0%
100.0%
Cities with the Highest Percentage of Population Employed in Production in Illinois
| City | % Employed | vs State | vs National | |
| 1. | Rock Island Arsenal | 82.5% | 6.0%(+76.5)#1 | 5.5%(+77.0)#56 |
| 2. | Solon Mills | 58.2% | 6.0%(+52.2)#2 | 5.5%(+52.7)#134 |
| 3. | Dewey | 56.9% | 6.0%(+50.9)#3 | 5.5%(+51.5)#143 |
| 4. | Triumph | 55.3% | 6.0%(+49.3)#4 | 5.5%(+49.8)#156 |
| 5. | Liverpool | 53.5% | 6.0%(+47.5)#5 | 5.5%(+48.0)#174 |
| 6. | Harding | 52.4% | 6.0%(+46.4)#6 | 5.5%(+46.9)#181 |
| 7. | Tennessee | 41.7% | 6.0%(+35.7)#7 | 5.5%(+36.2)#323 |
| 8. | Merritt | 41.2% | 6.0%(+35.2)#8 | 5.5%(+35.7)#332 |
| 9. | Rockport | 39.7% | 6.0%(+33.7)#9 | 5.5%(+34.2)#369 |
| 10. | Jewett | 37.5% | 6.0%(+31.5)#10 | 5.5%(+32.0)#426 |
| 11. | Sailor Springs | 36.2% | 6.0%(+30.2)#11 | 5.5%(+30.7)#462 |
| 12. | Wheeler | 34.7% | 6.0%(+28.7)#12 | 5.5%(+29.2)#514 |
| 13. | Olivet | 33.8% | 6.0%(+27.8)#13 | 5.5%(+28.3)#549 |
| 14. | Watson | 32.4% | 6.0%(+26.4)#14 | 5.5%(+26.9)#622 |
| 15. | Eldred | 32.3% | 6.0%(+26.3)#15 | 5.5%(+26.8)#631 |
| 16. | Metcalf | 32.1% | 6.0%(+26.1)#16 | 5.5%(+26.7)#638 |
| 17. | Martinton | 31.7% | 6.0%(+25.7)#17 | 5.5%(+26.2)#660 |
| 18. | Willow Hill | 31.4% | 6.0%(+25.4)#18 | 5.5%(+26.0)#681 |
| 19. | Nachusa | 31.4% | 6.0%(+25.4)#19 | 5.5%(+26.0)#683 |
| 20. | Sorento | 31.3% | 6.0%(+25.3)#20 | 5.5%(+25.8)#688 |
| 21. | Basco | 31.0% | 6.0%(+24.9)#21 | 5.5%(+25.5)#711 |
| 22. | Grant Park | 30.9% | 6.0%(+24.9)#22 | 5.5%(+25.4)#715 |
| 23. | Tamaroa | 30.6% | 6.0%(+24.6)#23 | 5.5%(+25.1)#731 |
| 24. | Compton | 28.8% | 6.0%(+22.8)#24 | 5.5%(+23.4)#850 |
| 25. | Troy Grove | 28.7% | 6.0%(+22.7)#25 | 5.5%(+23.2)#866 |
| 26. | Sandoval | 28.5% | 6.0%(+22.5)#26 | 5.5%(+23.0)#887 |
| 27. | Mount Erie | 28.1% | 6.0%(+22.1)#27 | 5.5%(+22.7)#925 |
| 28. | Albany | 27.4% | 6.0%(+21.4)#28 | 5.5%(+22.0)#981 |
| 29. | Albion | 27.3% | 6.0%(+21.3)#29 | 5.5%(+21.9)#992 |
| 30. | Harvard | 27.1% | 6.0%(+21.1)#30 | 5.5%(+21.6)#1,020 |
| 31. | New Bedford | 26.9% | 6.0%(+20.9)#31 | 5.5%(+21.5)#1,039 |
| 32. | Dallas City | 26.7% | 6.0%(+20.7)#32 | 5.5%(+21.3)#1,055 |
| 33. | Bone Gap | 26.6% | 6.0%(+20.6)#33 | 5.5%(+21.1)#1,071 |
| 34. | Savanna | 26.1% | 6.0%(+20.1)#34 | 5.5%(+20.6)#1,116 |
| 35. | Tower Hill | 25.6% | 6.0%(+19.6)#35 | 5.5%(+20.1)#1,187 |
| 36. | Dix | 24.9% | 6.0%(+18.9)#36 | 5.5%(+19.4)#1,295 |
| 37. | Stronghurst | 24.8% | 6.0%(+18.8)#37 | 5.5%(+19.4)#1,303 |
| 38. | Calhoun | 24.7% | 6.0%(+18.7)#38 | 5.5%(+19.3)#1,314 |
| 39. | Nebo | 24.5% | 6.0%(+18.5)#39 | 5.5%(+19.0)#1,346 |
| 40. | Ashley | 24.3% | 6.0%(+18.3)#40 | 5.5%(+18.8)#1,374 |
| 41. | Cowden | 24.1% | 6.0%(+18.1)#41 | 5.5%(+18.7)#1,393 |
| 42. | Old Ripley | 24.1% | 6.0%(+18.1)#42 | 5.5%(+18.7)#1,394 |
| 43. | Iuka | 24.0% | 6.0%(+18.0)#43 | 5.5%(+18.5)#1,427 |
| 44. | Symerton | 23.5% | 6.0%(+17.5)#44 | 5.5%(+18.1)#1,501 |
| 45. | Lanark | 23.5% | 6.0%(+17.5)#45 | 5.5%(+18.0)#1,506 |
| 46. | Ewing | 23.3% | 6.0%(+17.3)#46 | 5.5%(+17.8)#1,535 |
| 47. | Wedron | 23.3% | 6.0%(+17.2)#47 | 5.5%(+17.8)#1,549 |
| 48. | Osco | 23.2% | 6.0%(+17.2)#48 | 5.5%(+17.7)#1,557 |
| 49. | Kinmundy | 23.1% | 6.0%(+17.1)#49 | 5.5%(+17.6)#1,574 |
| 50. | Foosland | 23.1% | 6.0%(+17.1)#50 | 5.5%(+17.6)#1,584 |
| 51. | Gays | 22.9% | 6.0%(+16.9)#51 | 5.5%(+17.4)#1,613 |
| 52. | Banner | 22.8% | 6.0%(+16.8)#52 | 5.5%(+17.3)#1,626 |
| 53. | Hillsdale | 22.5% | 6.0%(+16.5)#53 | 5.5%(+17.1)#1,666 |
| 54. | Vermilion | 22.4% | 6.0%(+16.4)#54 | 5.5%(+16.9)#1,694 |
| 55. | Beardstown | 22.3% | 6.0%(+16.2)#55 | 5.5%(+16.8)#1,714 |
| 56. | Sun River Terrace | 22.2% | 6.0%(+16.2)#56 | 5.5%(+16.8)#1,719 |
| 57. | Varna | 22.2% | 6.0%(+16.2)#57 | 5.5%(+16.8)#1,720 |
| 58. | West Point | 22.2% | 6.0%(+16.2)#58 | 5.5%(+16.8)#1,724 |
| 59. | Barstow | 22.2% | 6.0%(+16.2)#59 | 5.5%(+16.8)#1,736 |
| 60. | Dana | 21.8% | 6.0%(+15.8)#60 | 5.5%(+16.3)#1,809 |
| 61. | Kinderhook | 21.8% | 6.0%(+15.8)#61 | 5.5%(+16.3)#1,815 |
| 62. | Louisville | 21.7% | 6.0%(+15.7)#62 | 5.5%(+16.3)#1,819 |
| 63. | Garrett | 21.7% | 6.0%(+15.7)#63 | 5.5%(+16.3)#1,829 |
| 64. | Ina | 21.7% | 6.0%(+15.7)#64 | 5.5%(+16.3)#1,831 |
| 65. | Bradford | 21.7% | 6.0%(+15.7)#65 | 5.5%(+16.2)#1,836 |
| 66. | Ramsey | 21.7% | 6.0%(+15.6)#66 | 5.5%(+16.2)#1,841 |
| 67. | Polo | 21.6% | 6.0%(+15.6)#67 | 5.5%(+16.1)#1,857 |
| 68. | Hopkins Park | 21.6% | 6.0%(+15.6)#68 | 5.5%(+16.1)#1,864 |
| 69. | Leaf River | 21.2% | 6.0%(+15.2)#69 | 5.5%(+15.8)#1,932 |
| 70. | Onarga | 21.2% | 6.0%(+15.2)#70 | 5.5%(+15.8)#1,933 |
| 71. | Nason | 21.2% | 6.0%(+15.2)#71 | 5.5%(+15.7)#1,943 |
| 72. | Stone Park | 21.1% | 6.0%(+15.1)#72 | 5.5%(+15.7)#1,973 |
| 73. | Stockton | 21.0% | 6.0%(+15.0)#73 | 5.5%(+15.6)#1,996 |
| 74. | Anchor | 20.8% | 6.0%(+14.8)#74 | 5.5%(+15.4)#2,048 |
| 75. | Lawrence | 20.8% | 6.0%(+14.8)#75 | 5.5%(+15.4)#2,051 |
| 76. | Carman | 20.7% | 6.0%(+14.7)#76 | 5.5%(+15.3)#2,075 |
| 77. | Smithville | 20.7% | 6.0%(+14.6)#77 | 5.5%(+15.2)#2,089 |
| 78. | Middletown | 20.5% | 6.0%(+14.4)#78 | 5.5%(+15.0)#2,144 |
| 79. | Bushnell | 20.2% | 6.0%(+14.2)#79 | 5.5%(+14.7)#2,208 |
| 80. | Buckingham | 20.2% | 6.0%(+14.2)#80 | 5.5%(+14.7)#2,213 |
| 81. | Lovington | 20.1% | 6.0%(+14.1)#81 | 5.5%(+14.6)#2,232 |
| 82. | Ripley | 20.0% | 6.0%(+14.0)#82 | 5.5%(+14.5)#2,274 |
| 83. | Richview | 19.8% | 6.0%(+13.8)#83 | 5.5%(+14.3)#2,320 |
| 84. | Capron | 19.8% | 6.0%(+13.8)#84 | 5.5%(+14.3)#2,324 |
| 85. | Grand Tower | 19.7% | 6.0%(+13.7)#85 | 5.5%(+14.3)#2,336 |
| 86. | Witt | 19.7% | 6.0%(+13.7)#86 | 5.5%(+14.2)#2,354 |
| 87. | Malden | 19.7% | 6.0%(+13.7)#87 | 5.5%(+14.2)#2,362 |
| 88. | Limestone | 19.6% | 6.0%(+13.6)#88 | 5.5%(+14.2)#2,367 |
| 89. | Rock Falls | 19.6% | 6.0%(+13.5)#89 | 5.5%(+14.1)#2,392 |
| 90. | Orangeville | 19.5% | 6.0%(+13.5)#90 | 5.5%(+14.0)#2,404 |
| 91. | Clear Lake | 19.4% | 6.0%(+13.4)#91 | 5.5%(+14.0)#2,431 |
| 92. | Wonder Lake | 19.3% | 6.0%(+13.3)#92 | 5.5%(+13.9)#2,454 |
| 93. | Hindsboro | 19.3% | 6.0%(+13.3)#93 | 5.5%(+13.8)#2,459 |
| 94. | Belle Prairie City | 19.2% | 6.0%(+13.2)#94 | 5.5%(+13.8)#2,481 |
| 95. | Apple River | 19.2% | 6.0%(+13.1)#95 | 5.5%(+13.7)#2,502 |
| 96. | La Moille | 19.1% | 6.0%(+13.1)#96 | 5.5%(+13.6)#2,516 |
| 97. | Table Grove | 19.0% | 6.0%(+13.0)#97 | 5.5%(+13.5)#2,570 |
| 98. | Chatsworth | 18.9% | 6.0%(+12.9)#98 | 5.5%(+13.5)#2,578 |
| 99. | Alma | 18.9% | 6.0%(+12.9)#99 | 5.5%(+13.5)#2,580 |
| 100. | Lowpoint | 18.8% | 6.0%(+12.7)#100 | 5.5%(+13.3)#2,653 |
Common Questions
What are the Top 10 Cities with the Highest Percentage of Population Employed in Production in Illinois?
Top 10 Cities with the Highest Percentage of Population Employed in Production in Illinois are:
#1
82.5%
#2
53.5%
#3
41.7%
#4
37.5%
#5
36.2%
#6
34.7%
#7
33.8%
#8
32.4%
#9
32.3%
#10
32.1%
What city has the Highest Percentage of Population Employed in Production in Illinois?
Rock Island Arsenal has the Highest Percentage of Population Employed in Production in Illinois with 82.5%.
What is the Percentage of Population Employed in Production in the State of Illinois?
Percentage of Population Employed in Production in Illinois is 6.0%.
What is the Percentage of Population Employed in Production in the United States?
Percentage of Population Employed in Production in the United States is 5.5%.