Cities with the Highest Percentage of Population Working from Home in Illinois
RELATED REPORTS & OPTIONS
Work from Home
Illinois
Compare Cities
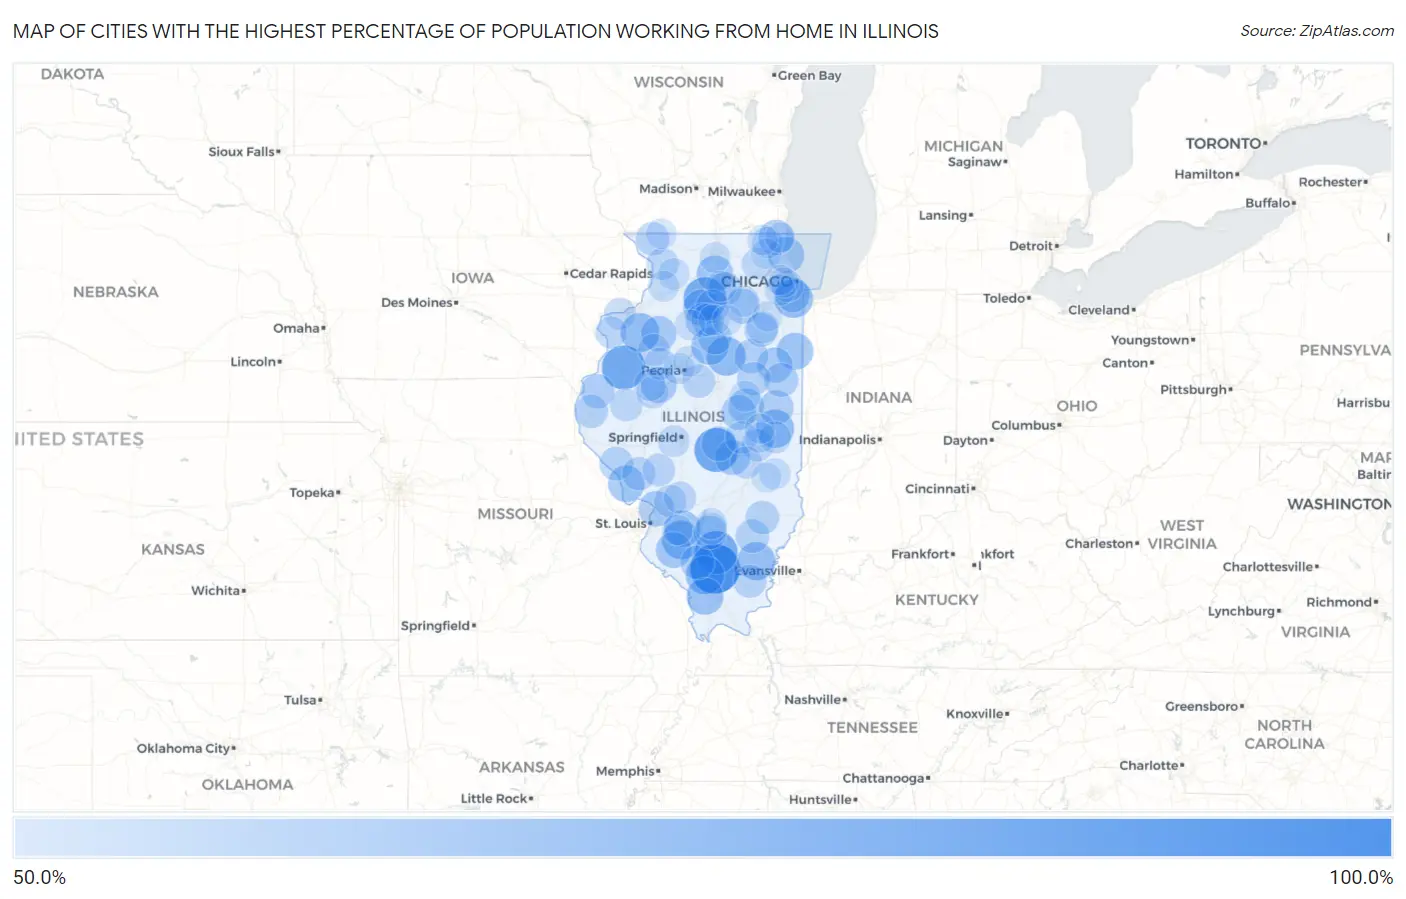
Map of Cities with the Highest Percentage of Population Working from Home in Illinois
0.0%
100.0%
Cities with the Highest Percentage of Population Working from Home in Illinois
| City | % Work from Home | vs State | vs National | |
| 1. | North City | 86.2% | 43.1%(+43.1)#1 | 44.0%(+42.2)#4 |
| 2. | Moweaqua | 77.3% | 43.1%(+34.2)#2 | 44.0%(+33.3)#31 |
| 3. | Roseville | 77.3% | 43.1%(+34.2)#3 | 44.0%(+33.3)#32 |
| 4. | Waltonville | 76.1% | 43.1%(+33.0)#4 | 44.0%(+32.1)#42 |
| 5. | Sublette | 76.0% | 43.1%(+32.9)#5 | 44.0%(+32.0)#44 |
| 6. | Flanagan | 69.8% | 43.1%(+26.7)#6 | 44.0%(+25.8)#175 |
| 7. | Alpha | 69.3% | 43.1%(+26.2)#7 | 44.0%(+25.3)#188 |
| 8. | Venedy | 69.3% | 43.1%(+26.2)#8 | 44.0%(+25.3)#194 |
| 9. | Dixmoor | 69.2% | 43.1%(+26.1)#9 | 44.0%(+25.2)#196 |
| 10. | Elkville | 69.2% | 43.1%(+26.1)#10 | 44.0%(+25.2)#199 |
| 11. | Broadlands | 68.8% | 43.1%(+25.7)#11 | 44.0%(+24.8)#223 |
| 12. | Enfield | 68.6% | 43.1%(+25.5)#12 | 44.0%(+24.6)#229 |
| 13. | Toluca | 67.5% | 43.1%(+24.4)#13 | 44.0%(+23.5)#289 |
| 14. | Makanda | 66.8% | 43.1%(+23.7)#14 | 44.0%(+22.8)#337 |
| 15. | Beaverville | 66.5% | 43.1%(+23.4)#15 | 44.0%(+22.5)#350 |
| 16. | Hardin | 66.2% | 43.1%(+23.1)#16 | 44.0%(+22.2)#377 |
| 17. | Hillcrest | 66.0% | 43.1%(+22.9)#17 | 44.0%(+22.0)#394 |
| 18. | Albers | 66.0% | 43.1%(+22.9)#18 | 44.0%(+22.0)#395 |
| 19. | Highwood | 65.5% | 43.1%(+22.4)#19 | 44.0%(+21.5)#424 |
| 20. | La Moille | 65.5% | 43.1%(+22.4)#20 | 44.0%(+21.5)#431 |
| 21. | Marissa | 65.1% | 43.1%(+22.0)#21 | 44.0%(+21.1)#493 |
| 22. | St David | 65.1% | 43.1%(+22.0)#22 | 44.0%(+21.1)#500 |
| 23. | Galva | 64.6% | 43.1%(+21.5)#23 | 44.0%(+20.6)#533 |
| 24. | Hartford | 64.6% | 43.1%(+21.5)#24 | 44.0%(+20.6)#535 |
| 25. | Old Mill Creek | 64.5% | 43.1%(+21.4)#25 | 44.0%(+20.5)#559 |
| 26. | Mansfield | 64.3% | 43.1%(+21.2)#26 | 44.0%(+20.3)#583 |
| 27. | Findlay | 64.2% | 43.1%(+21.1)#27 | 44.0%(+20.2)#605 |
| 28. | Gilman | 64.1% | 43.1%(+21.0)#28 | 44.0%(+20.1)#617 |
| 29. | Merrionette Park | 63.8% | 43.1%(+20.7)#29 | 44.0%(+19.8)#646 |
| 30. | De Land | 63.8% | 43.1%(+20.7)#30 | 44.0%(+19.8)#657 |
| 31. | Newark | 63.5% | 43.1%(+20.4)#31 | 44.0%(+19.5)#694 |
| 32. | Macon | 63.2% | 43.1%(+20.1)#32 | 44.0%(+19.2)#760 |
| 33. | Royal | 63.2% | 43.1%(+20.1)#33 | 44.0%(+19.2)#772 |
| 34. | Willow Lake | 63.1% | 43.1%(+20.0)#34 | 44.0%(+19.1)#788 |
| 35. | Carthage | 62.5% | 43.1%(+19.4)#35 | 44.0%(+18.5)#860 |
| 36. | Cissna Park | 62.5% | 43.1%(+19.4)#36 | 44.0%(+18.5)#867 |
| 37. | Seatonville | 62.5% | 43.1%(+19.4)#37 | 44.0%(+18.5)#875 |
| 38. | Saunemin | 62.5% | 43.1%(+19.4)#38 | 44.0%(+18.5)#876 |
| 39. | Pinckneyville | 62.3% | 43.1%(+19.2)#39 | 44.0%(+18.3)#908 |
| 40. | Lostant | 62.1% | 43.1%(+19.0)#40 | 44.0%(+18.1)#973 |
| 41. | Nebo | 62.1% | 43.1%(+19.0)#41 | 44.0%(+18.1)#976 |
| 42. | Jeffersonville | 61.8% | 43.1%(+18.7)#42 | 44.0%(+17.8)#1,028 |
| 43. | Braceville | 61.6% | 43.1%(+18.5)#43 | 44.0%(+17.6)#1,055 |
| 44. | Sibley | 61.6% | 43.1%(+18.5)#44 | 44.0%(+17.6)#1,058 |
| 45. | Shabbona | 61.5% | 43.1%(+18.4)#45 | 44.0%(+17.5)#1,080 |
| 46. | Noble | 61.5% | 43.1%(+18.4)#46 | 44.0%(+17.5)#1,083 |
| 47. | Loraine | 61.4% | 43.1%(+18.3)#47 | 44.0%(+17.4)#1,113 |
| 48. | Carrollton | 61.3% | 43.1%(+18.2)#48 | 44.0%(+17.3)#1,124 |
| 49. | Wamac | 61.3% | 43.1%(+18.2)#49 | 44.0%(+17.3)#1,141 |
| 50. | Apple Canyon Lake | 61.3% | 43.1%(+18.2)#50 | 44.0%(+17.3)#1,144 |
| 51. | Mendota | 61.2% | 43.1%(+18.1)#51 | 44.0%(+17.2)#1,157 |
| 52. | Eldorado | 61.0% | 43.1%(+17.9)#52 | 44.0%(+17.0)#1,218 |
| 53. | Heritage Lake | 61.0% | 43.1%(+17.9)#53 | 44.0%(+17.0)#1,226 |
| 54. | Hettick | 60.5% | 43.1%(+17.4)#54 | 44.0%(+16.5)#1,333 |
| 55. | Dalzell | 60.3% | 43.1%(+17.2)#55 | 44.0%(+16.3)#1,394 |
| 56. | Arcola | 60.2% | 43.1%(+17.1)#56 | 44.0%(+16.2)#1,414 |
| 57. | Littleton | 60.1% | 43.1%(+17.0)#57 | 44.0%(+16.1)#1,465 |
| 58. | Worden | 59.9% | 43.1%(+16.8)#58 | 44.0%(+15.9)#1,503 |
| 59. | Hammond | 59.8% | 43.1%(+16.7)#59 | 44.0%(+15.8)#1,521 |
| 60. | Mount Carroll | 59.6% | 43.1%(+16.5)#60 | 44.0%(+15.6)#1,550 |
| 61. | Andalusia | 59.5% | 43.1%(+16.4)#61 | 44.0%(+15.5)#1,592 |
| 62. | Newman | 59.5% | 43.1%(+16.4)#62 | 44.0%(+15.5)#1,600 |
| 63. | Oak Run | 59.5% | 43.1%(+16.4)#63 | 44.0%(+15.5)#1,602 |
| 64. | Joy | 59.5% | 43.1%(+16.4)#64 | 44.0%(+15.5)#1,610 |
| 65. | New Douglas | 59.5% | 43.1%(+16.4)#65 | 44.0%(+15.5)#1,613 |
| 66. | Gays | 59.5% | 43.1%(+16.4)#66 | 44.0%(+15.5)#1,622 |
| 67. | Braidwood | 59.4% | 43.1%(+16.3)#67 | 44.0%(+15.4)#1,629 |
| 68. | Lewistown | 59.4% | 43.1%(+16.3)#68 | 44.0%(+15.4)#1,641 |
| 69. | Cuba | 59.4% | 43.1%(+16.3)#69 | 44.0%(+15.4)#1,647 |
| 70. | Yates City | 59.3% | 43.1%(+16.2)#70 | 44.0%(+15.3)#1,676 |
| 71. | Sleepy Hollow | 59.1% | 43.1%(+16.0)#71 | 44.0%(+15.1)#1,736 |
| 72. | Forest View | 59.0% | 43.1%(+15.9)#72 | 44.0%(+15.0)#1,778 |
| 73. | Curran | 59.0% | 43.1%(+15.9)#73 | 44.0%(+15.0)#1,793 |
| 74. | Central City | 58.8% | 43.1%(+15.7)#74 | 44.0%(+14.8)#1,821 |
| 75. | Sandoval | 58.3% | 43.1%(+15.2)#75 | 44.0%(+14.3)#1,970 |
| 76. | Norwood | 58.3% | 43.1%(+15.2)#76 | 44.0%(+14.3)#1,981 |
| 77. | Long Lake | 58.2% | 43.1%(+15.1)#77 | 44.0%(+14.2)#2,006 |
| 78. | Casey | 58.2% | 43.1%(+15.1)#78 | 44.0%(+14.2)#2,011 |
| 79. | Milledgeville | 58.1% | 43.1%(+15.0)#79 | 44.0%(+14.1)#2,057 |
| 80. | Morrison | 58.0% | 43.1%(+14.9)#80 | 44.0%(+14.0)#2,081 |
| 81. | Bellflower | 58.0% | 43.1%(+14.9)#81 | 44.0%(+14.0)#2,105 |
| 82. | Millbrook | 58.0% | 43.1%(+14.9)#82 | 44.0%(+14.0)#2,110 |
| 83. | Burr Ridge | 57.8% | 43.1%(+14.7)#83 | 44.0%(+13.8)#2,128 |
| 84. | New Milford | 57.8% | 43.1%(+14.7)#84 | 44.0%(+13.8)#2,142 |
| 85. | Lee | 57.8% | 43.1%(+14.7)#85 | 44.0%(+13.8)#2,150 |
| 86. | Tuscola | 57.6% | 43.1%(+14.5)#86 | 44.0%(+13.6)#2,178 |
| 87. | Lasalle | 57.5% | 43.1%(+14.4)#87 | 44.0%(+13.5)#2,200 |
| 88. | Tiskilwa | 57.5% | 43.1%(+14.4)#88 | 44.0%(+13.5)#2,230 |
| 89. | Bay View Gardens | 57.5% | 43.1%(+14.4)#89 | 44.0%(+13.5)#2,241 |
| 90. | Tower Lakes | 57.3% | 43.1%(+14.2)#90 | 44.0%(+13.3)#2,318 |
| 91. | Berkeley | 57.2% | 43.1%(+14.1)#91 | 44.0%(+13.2)#2,354 |
| 92. | New Baden | 57.1% | 43.1%(+14.0)#92 | 44.0%(+13.1)#2,401 |
| 93. | Pistakee Highlands | 57.1% | 43.1%(+14.0)#93 | 44.0%(+13.1)#2,402 |
| 94. | Elwood | 57.1% | 43.1%(+14.0)#94 | 44.0%(+13.1)#2,411 |
| 95. | Warren | 57.1% | 43.1%(+14.0)#95 | 44.0%(+13.1)#2,416 |
| 96. | Greenup | 56.9% | 43.1%(+13.8)#96 | 44.0%(+12.9)#2,473 |
| 97. | Wadsworth | 56.8% | 43.1%(+13.7)#97 | 44.0%(+12.8)#2,489 |
| 98. | Ottawa | 56.7% | 43.1%(+13.6)#98 | 44.0%(+12.7)#2,520 |
| 99. | Broadview | 56.7% | 43.1%(+13.6)#99 | 44.0%(+12.7)#2,523 |
| 100. | Pesotum | 56.7% | 43.1%(+13.6)#100 | 44.0%(+12.7)#2,538 |
Common Questions
What are the Top 10 Cities with the Highest Percentage of Population Working from Home in Illinois?
Top 10 Cities with the Highest Percentage of Population Working from Home in Illinois are:
#1
86.2%
#2
77.3%
#3
77.3%
#4
76.1%
#5
76.0%
#6
69.8%
#7
69.3%
#8
69.3%
#9
69.2%
#10
69.2%
What city has the Highest Percentage of Population Working from Home in Illinois?
North City has the Highest Percentage of Population Working from Home in Illinois with 86.2%.
What is the Percentage of Population Working from Home in the State of Illinois?
Percentage of Population Working from Home in Illinois is 43.1%.
What is the Percentage of Population Working from Home in the United States?
Percentage of Population Working from Home in the United States is 44.0%.