Cities with the Lowest Wage/Income Gap (%) in Illinois
RELATED REPORTS & OPTIONS
Lowest Wage/Income Gap (%)
Illinois
Compare Cities
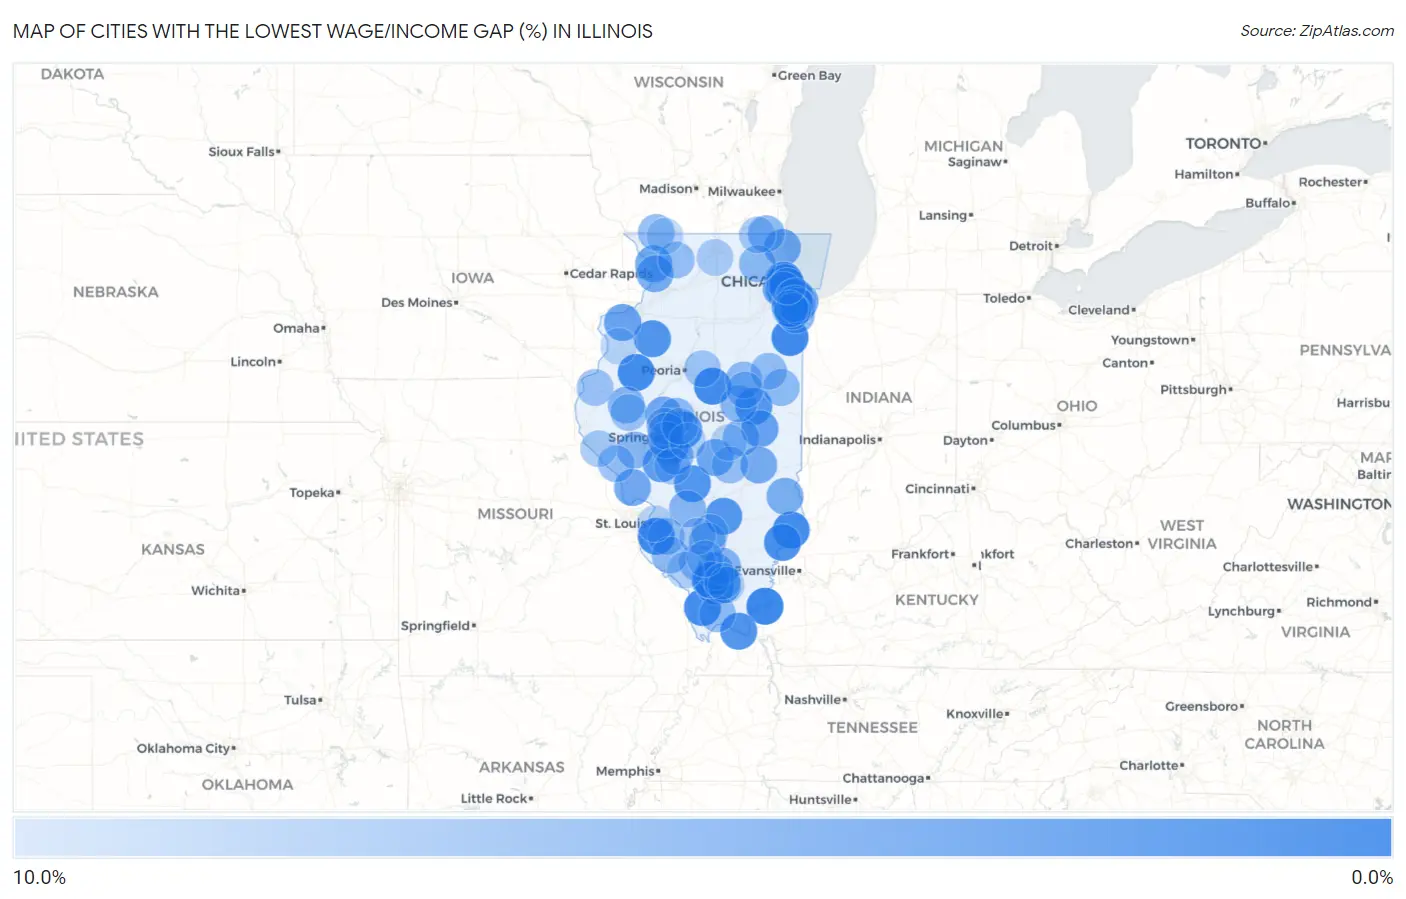
Map of Cities with the Lowest Wage/Income Gap (%) in Illinois
10.0%
0.0%
Cities with the Lowest Wage/Income Gap (%) in Illinois
| City | Wage/Income Gap (%) | vs State | vs National | |
| 1. | Olympia Fields | 0.17% | 29.6%(-0.294)#1 | 28.0%(-0.278)#33 |
| 2. | Forest Park | 0.23% | 29.6%(-0.293)#2 | 28.0%(-0.277)#45 |
| 3. | Cave In Rock | 0.35% | 29.6%(-0.292)#3 | 28.0%(-0.276)#78 |
| 4. | Sun River Terrace | 0.79% | 29.6%(-0.288)#4 | 28.0%(-0.272)#194 |
| 5. | Millstadt | 0.79% | 29.6%(-0.288)#5 | 28.0%(-0.272)#195 |
| 6. | Avon | 0.87% | 29.6%(-0.287)#6 | 28.0%(-0.271)#211 |
| 7. | Allendale | 0.87% | 29.6%(-0.287)#7 | 28.0%(-0.271)#213 |
| 8. | Twin Grove | 0.97% | 29.6%(-0.286)#8 | 28.0%(-0.270)#245 |
| 9. | Lawrence | 1.00% | 29.6%(-0.286)#9 | 28.0%(-0.270)#255 |
| 10. | Jonesboro | 1.1% | 29.6%(-0.285)#10 | 28.0%(-0.269)#271 |
| 11. | Crainville | 1.3% | 29.6%(-0.283)#11 | 28.0%(-0.267)#325 |
| 12. | Keensburg | 1.4% | 29.6%(-0.282)#12 | 28.0%(-0.266)#364 |
| 13. | Hurst | 1.4% | 29.6%(-0.282)#13 | 28.0%(-0.266)#368 |
| 14. | Loami | 1.6% | 29.6%(-0.279)#14 | 28.0%(-0.264)#414 |
| 15. | Brookport | 1.9% | 29.6%(-0.277)#15 | 28.0%(-0.261)#480 |
| 16. | Schram City | 2.0% | 29.6%(-0.276)#16 | 28.0%(-0.260)#489 |
| 17. | Altona | 2.1% | 29.6%(-0.275)#17 | 28.0%(-0.259)#516 |
| 18. | Sherman | 2.1% | 29.6%(-0.275)#18 | 28.0%(-0.259)#518 |
| 19. | Lake Of The Woods | 2.1% | 29.6%(-0.275)#19 | 28.0%(-0.259)#532 |
| 20. | Alma | 2.2% | 29.6%(-0.274)#20 | 28.0%(-0.258)#546 |
| 21. | Palmyra | 2.9% | 29.6%(-0.267)#21 | 28.0%(-0.251)#727 |
| 22. | Indian Head Park | 3.2% | 29.6%(-0.264)#22 | 28.0%(-0.248)#797 |
| 23. | Pesotum | 3.4% | 29.6%(-0.261)#23 | 28.0%(-0.245)#865 |
| 24. | Spillertown | 3.5% | 29.6%(-0.260)#24 | 28.0%(-0.244)#886 |
| 25. | Calumet City | 3.7% | 29.6%(-0.258)#25 | 28.0%(-0.243)#932 |
| 26. | Merrionette Park | 3.7% | 29.6%(-0.258)#26 | 28.0%(-0.242)#934 |
| 27. | Reynolds | 3.7% | 29.6%(-0.258)#27 | 28.0%(-0.242)#935 |
| 28. | Assumption | 4.0% | 29.6%(-0.256)#28 | 28.0%(-0.240)#1,007 |
| 29. | Savanna | 4.1% | 29.6%(-0.255)#29 | 28.0%(-0.239)#1,020 |
| 30. | Wilton Center | 4.1% | 29.6%(-0.255)#30 | 28.0%(-0.239)#1,033 |
| 31. | North Chicago | 4.1% | 29.6%(-0.255)#31 | 28.0%(-0.239)#1,039 |
| 32. | Christopher | 4.1% | 29.6%(-0.255)#32 | 28.0%(-0.239)#1,040 |
| 33. | Oakford | 4.2% | 29.6%(-0.253)#33 | 28.0%(-0.237)#1,070 |
| 34. | Fieldon | 4.4% | 29.6%(-0.252)#34 | 28.0%(-0.236)#1,105 |
| 35. | Maywood | 4.5% | 29.6%(-0.251)#35 | 28.0%(-0.235)#1,125 |
| 36. | Dolton | 4.6% | 29.6%(-0.250)#36 | 28.0%(-0.234)#1,154 |
| 37. | Thomson | 4.6% | 29.6%(-0.249)#37 | 28.0%(-0.234)#1,159 |
| 38. | Lerna | 4.7% | 29.6%(-0.249)#38 | 28.0%(-0.233)#1,173 |
| 39. | Bridgeview | 4.8% | 29.6%(-0.248)#39 | 28.0%(-0.232)#1,199 |
| 40. | Trivoli | 4.9% | 29.6%(-0.247)#40 | 28.0%(-0.231)#1,215 |
| 41. | Stoy | 4.9% | 29.6%(-0.247)#41 | 28.0%(-0.231)#1,234 |
| 42. | North Riverside | 5.0% | 29.6%(-0.246)#42 | 28.0%(-0.230)#1,253 |
| 43. | Robbins | 5.0% | 29.6%(-0.245)#43 | 28.0%(-0.229)#1,272 |
| 44. | Richview | 5.1% | 29.6%(-0.245)#44 | 28.0%(-0.229)#1,284 |
| 45. | Justice | 5.1% | 29.6%(-0.245)#45 | 28.0%(-0.229)#1,286 |
| 46. | Hazel Crest | 5.3% | 29.6%(-0.242)#46 | 28.0%(-0.227)#1,358 |
| 47. | Blue Island | 5.4% | 29.6%(-0.242)#47 | 28.0%(-0.226)#1,379 |
| 48. | Crete | 5.5% | 29.6%(-0.240)#48 | 28.0%(-0.225)#1,422 |
| 49. | Country Club Hills | 5.5% | 29.6%(-0.240)#49 | 28.0%(-0.224)#1,423 |
| 50. | Littleton | 5.6% | 29.6%(-0.239)#50 | 28.0%(-0.223)#1,449 |
| 51. | Thayer | 5.6% | 29.6%(-0.239)#51 | 28.0%(-0.223)#1,451 |
| 52. | Benton | 5.7% | 29.6%(-0.239)#52 | 28.0%(-0.223)#1,460 |
| 53. | Hammond | 5.9% | 29.6%(-0.237)#53 | 28.0%(-0.221)#1,507 |
| 54. | Channel Lake | 5.9% | 29.6%(-0.237)#54 | 28.0%(-0.221)#1,508 |
| 55. | Pocahontas | 6.0% | 29.6%(-0.236)#55 | 28.0%(-0.220)#1,522 |
| 56. | Calumet Park | 6.0% | 29.6%(-0.236)#56 | 28.0%(-0.220)#1,526 |
| 57. | Glenwood | 6.0% | 29.6%(-0.236)#57 | 28.0%(-0.220)#1,530 |
| 58. | Farmer City | 6.0% | 29.6%(-0.235)#58 | 28.0%(-0.220)#1,543 |
| 59. | Winchester | 6.1% | 29.6%(-0.235)#59 | 28.0%(-0.219)#1,548 |
| 60. | Greenview | 6.1% | 29.6%(-0.235)#60 | 28.0%(-0.219)#1,560 |
| 61. | West Dundee | 6.2% | 29.6%(-0.234)#61 | 28.0%(-0.218)#1,580 |
| 62. | Rankin | 6.2% | 29.6%(-0.233)#62 | 28.0%(-0.217)#1,596 |
| 63. | Anchor | 6.5% | 29.6%(-0.231)#63 | 28.0%(-0.215)#1,651 |
| 64. | Freeburg | 6.5% | 29.6%(-0.231)#64 | 28.0%(-0.215)#1,655 |
| 65. | Apple River | 6.6% | 29.6%(-0.230)#65 | 28.0%(-0.214)#1,680 |
| 66. | Pinckneyville | 6.6% | 29.6%(-0.229)#66 | 28.0%(-0.213)#1,690 |
| 67. | Baldwin | 6.6% | 29.6%(-0.229)#67 | 28.0%(-0.213)#1,693 |
| 68. | Tallula | 6.7% | 29.6%(-0.229)#68 | 28.0%(-0.213)#1,702 |
| 69. | Cypress | 6.7% | 29.6%(-0.229)#69 | 28.0%(-0.213)#1,704 |
| 70. | Berlin | 6.7% | 29.6%(-0.229)#70 | 28.0%(-0.213)#1,707 |
| 71. | Thawville | 6.7% | 29.6%(-0.228)#71 | 28.0%(-0.212)#1,727 |
| 72. | Nebo | 6.9% | 29.6%(-0.227)#72 | 28.0%(-0.211)#1,757 |
| 73. | East Hazel Crest | 6.9% | 29.6%(-0.227)#73 | 28.0%(-0.211)#1,765 |
| 74. | Pleasant Plains | 7.0% | 29.6%(-0.226)#74 | 28.0%(-0.210)#1,778 |
| 75. | Shannon | 7.0% | 29.6%(-0.226)#75 | 28.0%(-0.210)#1,785 |
| 76. | Saybrook | 7.1% | 29.6%(-0.225)#76 | 28.0%(-0.209)#1,817 |
| 77. | Shelbyville | 7.1% | 29.6%(-0.225)#77 | 28.0%(-0.209)#1,823 |
| 78. | Ferris | 7.3% | 29.6%(-0.222)#78 | 28.0%(-0.206)#1,888 |
| 79. | Rushville | 7.5% | 29.6%(-0.221)#79 | 28.0%(-0.205)#1,929 |
| 80. | Bush | 7.5% | 29.6%(-0.221)#80 | 28.0%(-0.205)#1,939 |
| 81. | Eureka | 7.5% | 29.6%(-0.220)#81 | 28.0%(-0.205)#1,953 |
| 82. | Richmond | 7.9% | 29.6%(-0.217)#82 | 28.0%(-0.201)#2,060 |
| 83. | New Canton | 7.9% | 29.6%(-0.216)#83 | 28.0%(-0.200)#2,074 |
| 84. | Wamac | 8.0% | 29.6%(-0.216)#84 | 28.0%(-0.200)#2,080 |
| 85. | New Milford | 8.3% | 29.6%(-0.213)#85 | 28.0%(-0.197)#2,180 |
| 86. | Nilwood | 8.3% | 29.6%(-0.213)#86 | 28.0%(-0.197)#2,192 |
| 87. | New Minden | 8.4% | 29.6%(-0.212)#87 | 28.0%(-0.196)#2,225 |
| 88. | Park Forest | 8.5% | 29.6%(-0.211)#88 | 28.0%(-0.195)#2,265 |
| 89. | Matteson | 8.6% | 29.6%(-0.210)#89 | 28.0%(-0.194)#2,287 |
| 90. | Pittsburg | 8.7% | 29.6%(-0.209)#90 | 28.0%(-0.193)#2,301 |
| 91. | Rochester | 8.8% | 29.6%(-0.208)#91 | 28.0%(-0.192)#2,335 |
| 92. | Willisville | 8.8% | 29.6%(-0.208)#92 | 28.0%(-0.192)#2,339 |
| 93. | Tamaroa | 8.9% | 29.6%(-0.207)#93 | 28.0%(-0.191)#2,356 |
| 94. | East St Louis | 8.9% | 29.6%(-0.207)#94 | 28.0%(-0.191)#2,369 |
| 95. | Forest View | 9.1% | 29.6%(-0.205)#95 | 28.0%(-0.189)#2,427 |
| 96. | Cantrall | 9.1% | 29.6%(-0.205)#96 | 28.0%(-0.189)#2,429 |
| 97. | Nora | 9.2% | 29.6%(-0.204)#97 | 28.0%(-0.188)#2,451 |
| 98. | Johnston City | 9.3% | 29.6%(-0.203)#98 | 28.0%(-0.187)#2,477 |
| 99. | Little York | 9.3% | 29.6%(-0.203)#99 | 28.0%(-0.187)#2,486 |
| 100. | Dalton City | 9.4% | 29.6%(-0.202)#100 | 28.0%(-0.186)#2,521 |
Common Questions
What are the Top 10 Cities with the Lowest Wage/Income Gap (%) in Illinois?
Top 10 Cities with the Lowest Wage/Income Gap (%) in Illinois are:
#1
0.17%
#2
0.23%
#3
0.35%
#4
0.79%
#5
0.79%
#6
0.87%
#7
0.87%
#8
0.97%
#9
1.1%
#10
1.3%
What city has the Lowest Wage/Income Gap (%) in Illinois?
Olympia Fields has the Lowest Wage/Income Gap (%) in Illinois with 0.17%.
What is the Wage / Income Gap in Percentage Terms in the State of Illinois?
Wage / Income Gap in Percentage Terms in Illinois is 29.6%.
What is the Wage / Income Gap in Percentage Terms in the United States?
Wage / Income Gap in Percentage Terms in the United States is 28.0%.