Zip Codes with the Highest Percentage of Population Employed in Food Preparation & Serving in Urbana, IL
RELATED REPORTS & OPTIONS
Food Preparation & Serving
Urbana
Compare Zip Codes
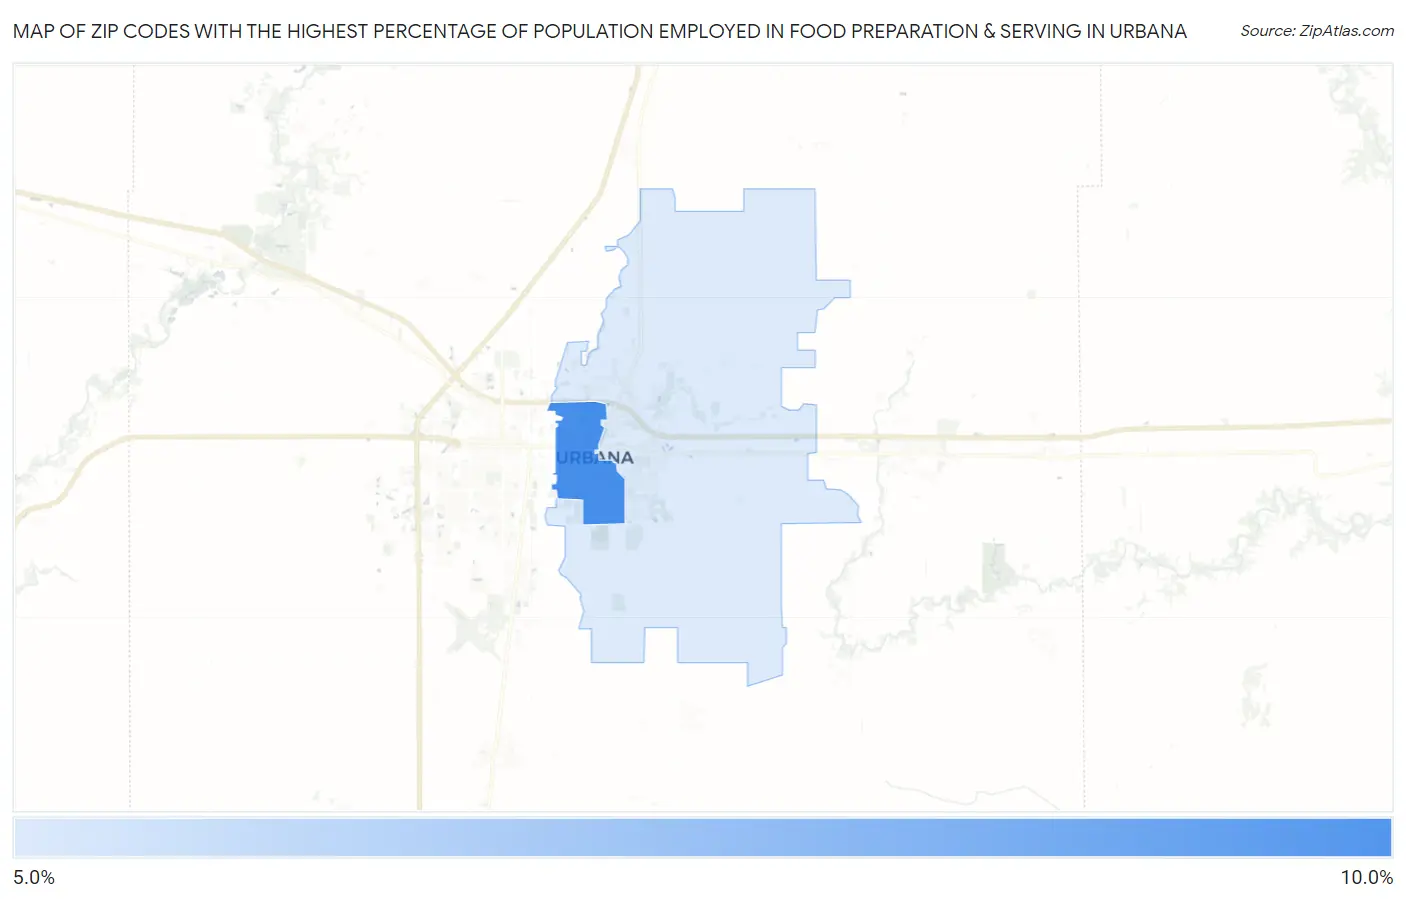
Map of Zip Codes with the Highest Percentage of Population Employed in Food Preparation & Serving in Urbana
5.6%
9.5%
Zip Codes with the Highest Percentage of Population Employed in Food Preparation & Serving in Urbana, IL
| Zip Code | % Employed | vs State | vs National | |
| 1. | 61801 | 9.5% | 5.0%(+4.43)#126 | 5.3%(+4.18)#3,086 |
| 2. | 61802 | 5.6% | 5.0%(+0.598)#450 | 5.3%(+0.346)#10,596 |
1
Common Questions
What are the Top Zip Codes with the Highest Percentage of Population Employed in Food Preparation & Serving in Urbana, IL?
Top Zip Codes with the Highest Percentage of Population Employed in Food Preparation & Serving in Urbana, IL are:
What zip code has the Highest Percentage of Population Employed in Food Preparation & Serving in Urbana, IL?
61801 has the Highest Percentage of Population Employed in Food Preparation & Serving in Urbana, IL with 9.5%.
What is the Percentage of Population Employed in Food Preparation & Serving in Urbana, IL?
Percentage of Population Employed in Food Preparation & Serving in Urbana is 8.5%.
What is the Percentage of Population Employed in Food Preparation & Serving in Illinois?
Percentage of Population Employed in Food Preparation & Serving in Illinois is 5.0%.
What is the Percentage of Population Employed in Food Preparation & Serving in the United States?
Percentage of Population Employed in Food Preparation & Serving in the United States is 5.3%.