Cities with the Most Immigrants from Spain in Illinois
RELATED REPORTS & OPTIONS
Spain
Illinois
Compare Cities
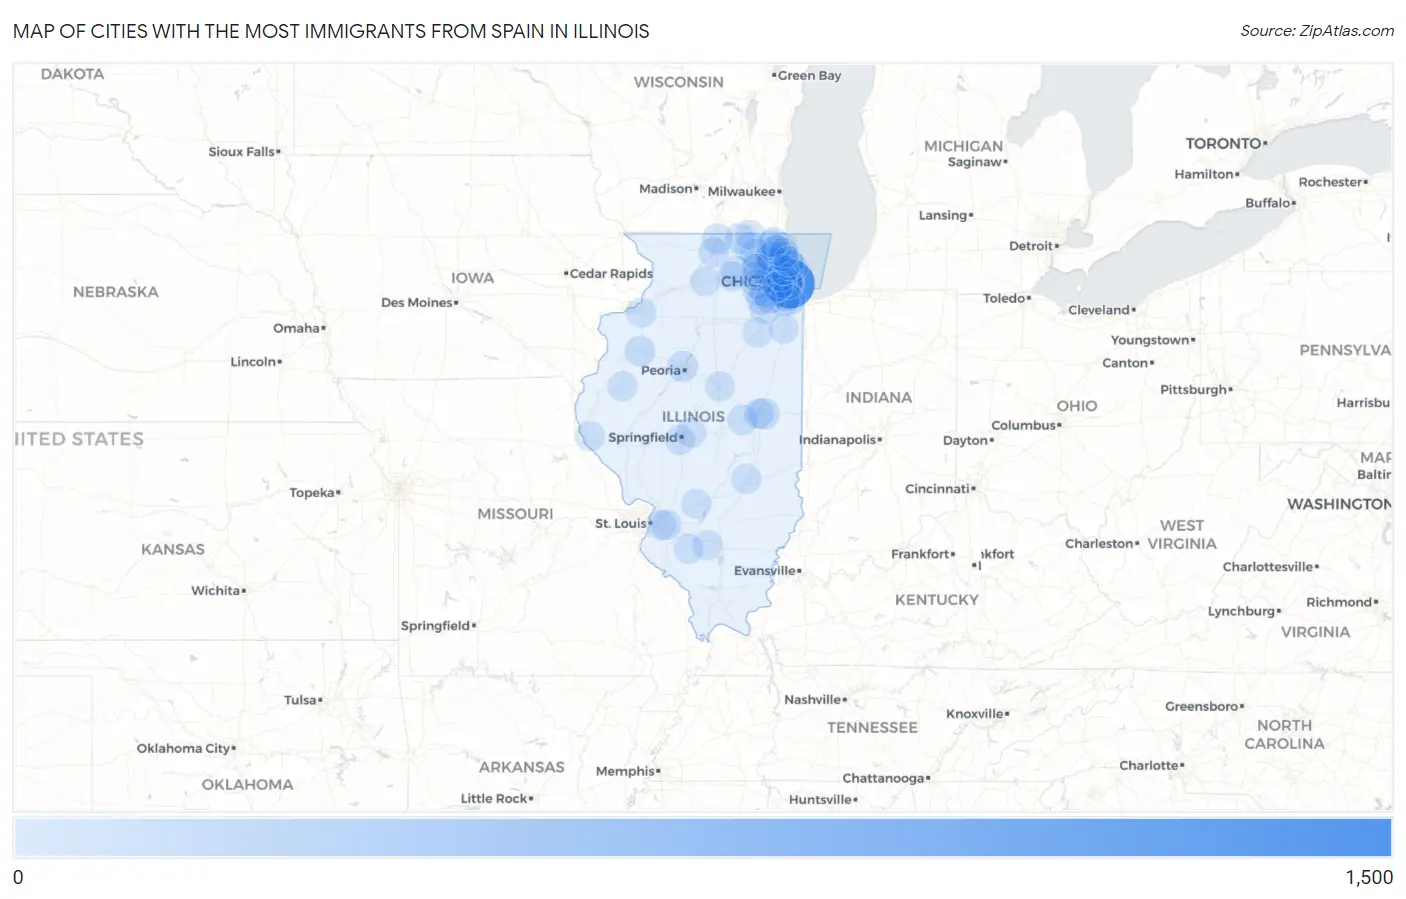
Map of Cities with the Most Immigrants from Spain in Illinois
0
1,500
Cities with the Most Immigrants from Spain in Illinois
| City | Spain | vs State | vs National | |
| 1. | Chicago | 1,230 | 2,861(42.99%)#1 | 120,953(1.02%)#8 |
| 2. | Naperville | 123 | 2,861(4.30%)#2 | 120,953(0.10%)#155 |
| 3. | Schaumburg | 113 | 2,861(3.95%)#3 | 120,953(0.09%)#174 |
| 4. | Urbana | 81 | 2,861(2.83%)#4 | 120,953(0.07%)#259 |
| 5. | Woodstock | 68 | 2,861(2.38%)#5 | 120,953(0.06%)#301 |
| 6. | Cicero | 58 | 2,861(2.03%)#6 | 120,953(0.05%)#364 |
| 7. | Evanston | 54 | 2,861(1.89%)#7 | 120,953(0.04%)#389 |
| 8. | Oak Park | 53 | 2,861(1.85%)#8 | 120,953(0.04%)#401 |
| 9. | Peoria | 49 | 2,861(1.71%)#9 | 120,953(0.04%)#422 |
| 10. | Mundelein | 48 | 2,861(1.68%)#10 | 120,953(0.04%)#435 |
| 11. | Downers Grove | 37 | 2,861(1.29%)#11 | 120,953(0.03%)#546 |
| 12. | Galesburg | 37 | 2,861(1.29%)#12 | 120,953(0.03%)#549 |
| 13. | Mount Prospect | 33 | 2,861(1.15%)#13 | 120,953(0.03%)#612 |
| 14. | Sycamore | 32 | 2,861(1.12%)#14 | 120,953(0.03%)#631 |
| 15. | Aurora | 31 | 2,861(1.08%)#15 | 120,953(0.03%)#640 |
| 16. | Berwyn | 31 | 2,861(1.08%)#16 | 120,953(0.03%)#645 |
| 17. | Roscoe | 31 | 2,861(1.08%)#17 | 120,953(0.03%)#654 |
| 18. | Palatine | 28 | 2,861(0.98%)#18 | 120,953(0.02%)#693 |
| 19. | Westmont | 28 | 2,861(0.98%)#19 | 120,953(0.02%)#702 |
| 20. | Harvard | 25 | 2,861(0.87%)#20 | 120,953(0.02%)#772 |
| 21. | Orland Park | 24 | 2,861(0.84%)#21 | 120,953(0.02%)#788 |
| 22. | Glendale Heights | 24 | 2,861(0.84%)#22 | 120,953(0.02%)#793 |
| 23. | Monticello | 21 | 2,861(0.73%)#23 | 120,953(0.02%)#919 |
| 24. | Kildeer | 21 | 2,861(0.73%)#24 | 120,953(0.02%)#923 |
| 25. | Rockford | 20 | 2,861(0.70%)#25 | 120,953(0.02%)#927 |
| 26. | O Fallon | 20 | 2,861(0.70%)#26 | 120,953(0.02%)#936 |
| 27. | Arlington Heights | 17 | 2,861(0.59%)#27 | 120,953(0.01%)#1,029 |
| 28. | Batavia | 17 | 2,861(0.59%)#28 | 120,953(0.01%)#1,034 |
| 29. | Streamwood | 15 | 2,861(0.52%)#29 | 120,953(0.01%)#1,104 |
| 30. | Westchester | 14 | 2,861(0.49%)#30 | 120,953(0.01%)#1,170 |
| 31. | Midlothian | 14 | 2,861(0.49%)#31 | 120,953(0.01%)#1,173 |
| 32. | Dekalb | 13 | 2,861(0.45%)#32 | 120,953(0.01%)#1,208 |
| 33. | Wilmette | 13 | 2,861(0.45%)#33 | 120,953(0.01%)#1,214 |
| 34. | Joliet | 12 | 2,861(0.42%)#34 | 120,953(0.01%)#1,243 |
| 35. | Romeoville | 12 | 2,861(0.42%)#35 | 120,953(0.01%)#1,258 |
| 36. | Springfield | 11 | 2,861(0.38%)#36 | 120,953(0.01%)#1,293 |
| 37. | Champaign | 11 | 2,861(0.38%)#37 | 120,953(0.01%)#1,295 |
| 38. | Palos Heights | 11 | 2,861(0.38%)#38 | 120,953(0.01%)#1,321 |
| 39. | West Dundee | 11 | 2,861(0.38%)#39 | 120,953(0.01%)#1,328 |
| 40. | Bloomington | 10 | 2,861(0.35%)#40 | 120,953(0.01%)#1,352 |
| 41. | Crystal Lake | 10 | 2,861(0.35%)#41 | 120,953(0.01%)#1,362 |
| 42. | Deerfield | 10 | 2,861(0.35%)#42 | 120,953(0.01%)#1,376 |
| 43. | Fairview Heights | 10 | 2,861(0.35%)#43 | 120,953(0.01%)#1,381 |
| 44. | Dawson | 10 | 2,861(0.35%)#44 | 120,953(0.01%)#1,409 |
| 45. | Plainfield | 9 | 2,861(0.31%)#45 | 120,953(0.01%)#1,423 |
| 46. | St Charles | 9 | 2,861(0.31%)#46 | 120,953(0.01%)#1,432 |
| 47. | Lake Zurich | 9 | 2,861(0.31%)#47 | 120,953(0.01%)#1,443 |
| 48. | Franklin Park | 9 | 2,861(0.31%)#48 | 120,953(0.01%)#1,447 |
| 49. | Bannockburn | 9 | 2,861(0.31%)#49 | 120,953(0.01%)#1,473 |
| 50. | Ashley | 9 | 2,861(0.31%)#50 | 120,953(0.01%)#1,476 |
| 51. | North Chicago | 8 | 2,861(0.28%)#51 | 120,953(0.01%)#1,492 |
| 52. | Elgin | 7 | 2,861(0.24%)#52 | 120,953(0.01%)#1,543 |
| 53. | Libertyville | 7 | 2,861(0.24%)#53 | 120,953(0.01%)#1,563 |
| 54. | Ashton | 7 | 2,861(0.24%)#54 | 120,953(0.01%)#1,596 |
| 55. | Colona | 6 | 2,861(0.21%)#55 | 120,953(0.00%)#1,632 |
| 56. | Lake Forest | 4 | 2,861(0.14%)#56 | 120,953(0.00%)#1,720 |
| 57. | Hainesville | 4 | 2,861(0.14%)#57 | 120,953(0.00%)#1,739 |
| 58. | Hebron | 4 | 2,861(0.14%)#58 | 120,953(0.00%)#1,752 |
| 59. | Third Lake | 4 | 2,861(0.14%)#59 | 120,953(0.00%)#1,756 |
| 60. | Macomb | 3 | 2,861(0.10%)#60 | 120,953(0.00%)#1,777 |
| 61. | Clarendon Hills | 3 | 2,861(0.10%)#61 | 120,953(0.00%)#1,780 |
| 62. | Greenville | 3 | 2,861(0.10%)#62 | 120,953(0.00%)#1,781 |
| 63. | Gardner | 3 | 2,861(0.10%)#63 | 120,953(0.00%)#1,799 |
| 64. | Manteno | 2 | 2,861(0.07%)#64 | 120,953(0.00%)#1,834 |
| 65. | Payson | 2 | 2,861(0.07%)#65 | 120,953(0.00%)#1,852 |
| 66. | Oakdale | 2 | 2,861(0.07%)#66 | 120,953(0.00%)#1,874 |
| 67. | Park Ridge | 1 | 2,861(0.03%)#67 | 120,953(0.00%)#1,886 |
| 68. | Glencoe | 1 | 2,861(0.03%)#68 | 120,953(0.00%)#1,901 |
| 69. | Sigel | 1 | 2,861(0.03%)#69 | 120,953(0.00%)#1,916 |
Common Questions
What are the Top 10 Cities with the Most Immigrants from Spain in Illinois?
Top 10 Cities with the Most Immigrants from Spain in Illinois are:
#1
1,230
#2
123
#3
113
#4
81
#5
68
#6
58
#7
54
#8
53
#9
49
#10
48
What city has the Most Immigrants from Spain in Illinois?
Chicago has the Most Immigrants from Spain in Illinois with 1,230.
What is the Total Immigrants from Spain in the State of Illinois?
Total Immigrants from Spain in Illinois is 2,861.
What is the Total Immigrants from Spain in the United States?
Total Immigrants from Spain in the United States is 120,953.