Cities with the Most Immigrants from Western Africa in Illinois
RELATED REPORTS & OPTIONS
Western Africa
Illinois
Compare Cities
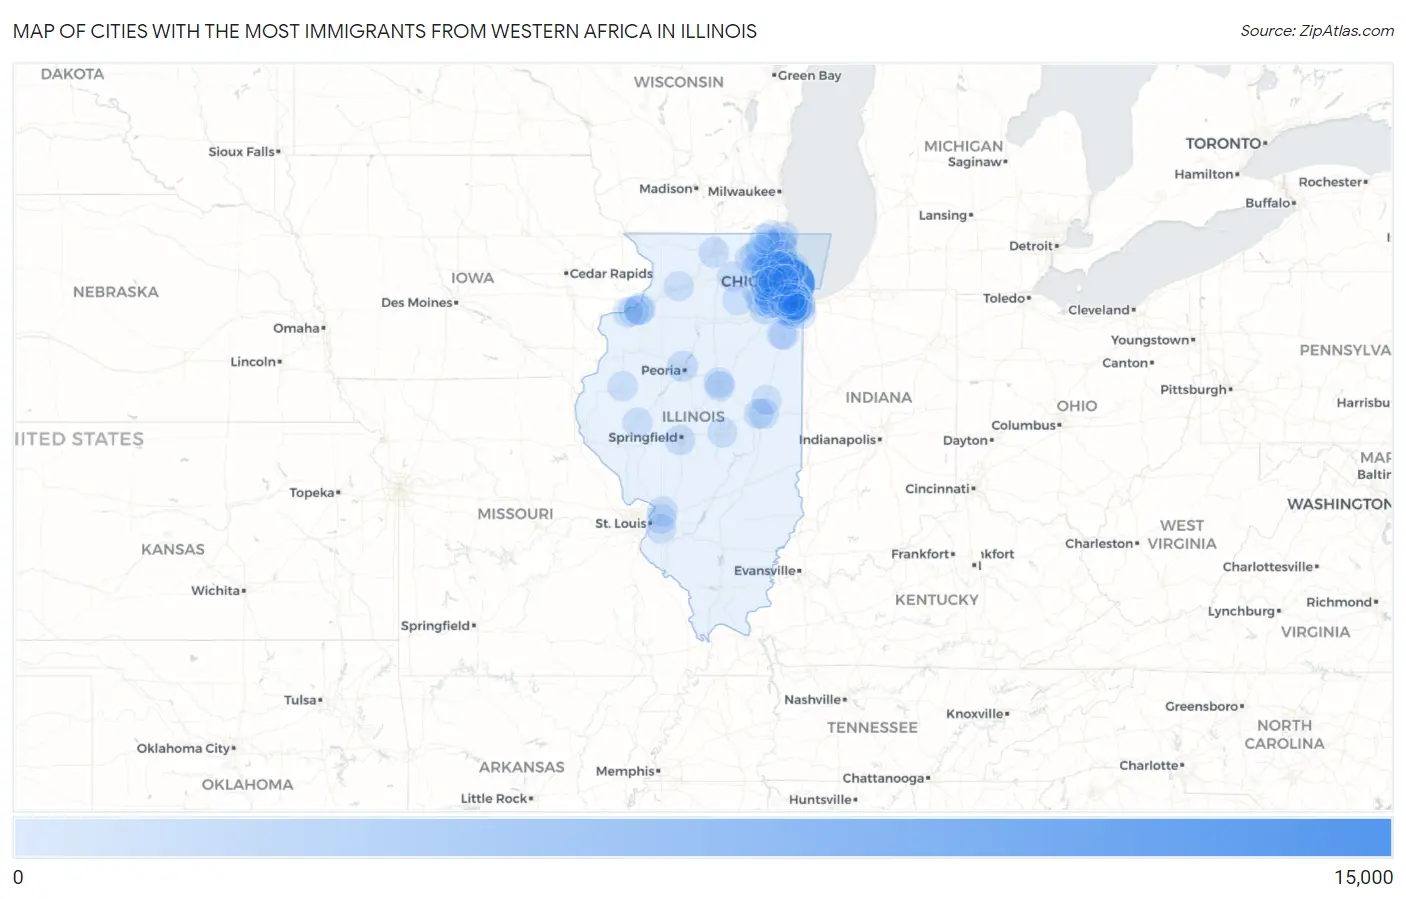
Map of Cities with the Most Immigrants from Western Africa in Illinois
0
15,000
Cities with the Most Immigrants from Western Africa in Illinois
| City | Western Africa | vs State | vs National | |
| 1. | Chicago | 14,678 | 34,412(42.65%)#1 | 985,560(1.49%)#5 |
| 2. | Evanston | 1,055 | 34,412(3.07%)#2 | 985,560(0.11%)#130 |
| 3. | Joliet | 904 | 34,412(2.63%)#3 | 985,560(0.09%)#151 |
| 4. | Plainfield | 781 | 34,412(2.27%)#4 | 985,560(0.08%)#168 |
| 5. | East Moline | 755 | 34,412(2.19%)#5 | 985,560(0.08%)#172 |
| 6. | Peoria | 651 | 34,412(1.89%)#6 | 985,560(0.07%)#216 |
| 7. | Aurora | 599 | 34,412(1.74%)#7 | 985,560(0.06%)#238 |
| 8. | Skokie | 568 | 34,412(1.65%)#8 | 985,560(0.06%)#249 |
| 9. | Calumet City | 549 | 34,412(1.60%)#9 | 985,560(0.06%)#257 |
| 10. | Woodridge | 472 | 34,412(1.37%)#10 | 985,560(0.05%)#305 |
| 11. | South Holland | 456 | 34,412(1.33%)#11 | 985,560(0.05%)#313 |
| 12. | Waukegan | 442 | 34,412(1.28%)#12 | 985,560(0.04%)#324 |
| 13. | Romeoville | 381 | 34,412(1.11%)#13 | 985,560(0.04%)#371 |
| 14. | Springfield | 374 | 34,412(1.09%)#14 | 985,560(0.04%)#379 |
| 15. | Bolingbrook | 363 | 34,412(1.05%)#15 | 985,560(0.04%)#387 |
| 16. | University Park | 339 | 34,412(0.99%)#16 | 985,560(0.03%)#412 |
| 17. | Rockford | 316 | 34,412(0.92%)#17 | 985,560(0.03%)#436 |
| 18. | Dekalb | 314 | 34,412(0.91%)#18 | 985,560(0.03%)#440 |
| 19. | Lansing | 285 | 34,412(0.83%)#19 | 985,560(0.03%)#486 |
| 20. | Hoffman Estates | 282 | 34,412(0.82%)#20 | 985,560(0.03%)#490 |
| 21. | Urbana | 270 | 34,412(0.78%)#21 | 985,560(0.03%)#515 |
| 22. | Country Club Hills | 250 | 34,412(0.73%)#22 | 985,560(0.03%)#555 |
| 23. | Normal | 229 | 34,412(0.67%)#23 | 985,560(0.02%)#592 |
| 24. | Berwyn | 220 | 34,412(0.64%)#24 | 985,560(0.02%)#603 |
| 25. | Oak Lawn | 200 | 34,412(0.58%)#25 | 985,560(0.02%)#652 |
| 26. | Streamwood | 179 | 34,412(0.52%)#26 | 985,560(0.02%)#712 |
| 27. | Frankfort | 165 | 34,412(0.48%)#27 | 985,560(0.02%)#760 |
| 28. | Huntley | 164 | 34,412(0.48%)#28 | 985,560(0.02%)#767 |
| 29. | Elgin | 158 | 34,412(0.46%)#29 | 985,560(0.02%)#786 |
| 30. | Naperville | 156 | 34,412(0.45%)#30 | 985,560(0.02%)#801 |
| 31. | Arlington Heights | 156 | 34,412(0.45%)#31 | 985,560(0.02%)#802 |
| 32. | Tinley Park | 153 | 34,412(0.44%)#32 | 985,560(0.02%)#819 |
| 33. | Lynwood | 152 | 34,412(0.44%)#33 | 985,560(0.02%)#826 |
| 34. | Palatine | 151 | 34,412(0.44%)#34 | 985,560(0.02%)#829 |
| 35. | Dolton | 149 | 34,412(0.43%)#35 | 985,560(0.02%)#834 |
| 36. | Matteson | 149 | 34,412(0.43%)#36 | 985,560(0.02%)#835 |
| 37. | Richton Park | 143 | 34,412(0.42%)#37 | 985,560(0.01%)#857 |
| 38. | Decatur | 142 | 34,412(0.41%)#38 | 985,560(0.01%)#859 |
| 39. | Des Plaines | 141 | 34,412(0.41%)#39 | 985,560(0.01%)#866 |
| 40. | Moline | 138 | 34,412(0.40%)#40 | 985,560(0.01%)#884 |
| 41. | Champaign | 129 | 34,412(0.37%)#41 | 985,560(0.01%)#928 |
| 42. | Schaumburg | 125 | 34,412(0.36%)#42 | 985,560(0.01%)#942 |
| 43. | Hazel Crest | 125 | 34,412(0.36%)#43 | 985,560(0.01%)#945 |
| 44. | Edwardsville | 120 | 34,412(0.35%)#44 | 985,560(0.01%)#971 |
| 45. | Lincolnwood | 120 | 34,412(0.35%)#45 | 985,560(0.01%)#972 |
| 46. | Berkeley | 119 | 34,412(0.35%)#46 | 985,560(0.01%)#980 |
| 47. | Rolling Meadows | 116 | 34,412(0.34%)#47 | 985,560(0.01%)#993 |
| 48. | Bellwood | 116 | 34,412(0.34%)#48 | 985,560(0.01%)#995 |
| 49. | Evergreen Park | 112 | 34,412(0.33%)#49 | 985,560(0.01%)#1,021 |
| 50. | North Chicago | 111 | 34,412(0.32%)#50 | 985,560(0.01%)#1,024 |
| 51. | Park Forest | 108 | 34,412(0.31%)#51 | 985,560(0.01%)#1,039 |
| 52. | Lisle | 106 | 34,412(0.31%)#52 | 985,560(0.01%)#1,044 |
| 53. | Lockport | 105 | 34,412(0.31%)#53 | 985,560(0.01%)#1,050 |
| 54. | Villa Park | 105 | 34,412(0.31%)#54 | 985,560(0.01%)#1,051 |
| 55. | Worth | 105 | 34,412(0.31%)#55 | 985,560(0.01%)#1,052 |
| 56. | East Dundee | 105 | 34,412(0.31%)#56 | 985,560(0.01%)#1,054 |
| 57. | Alsip | 103 | 34,412(0.30%)#57 | 985,560(0.01%)#1,059 |
| 58. | Beardstown | 92 | 34,412(0.27%)#58 | 985,560(0.01%)#1,149 |
| 59. | Oak Forest | 90 | 34,412(0.26%)#59 | 985,560(0.01%)#1,164 |
| 60. | Bloomington | 87 | 34,412(0.25%)#60 | 985,560(0.01%)#1,191 |
| 61. | Calumet Park | 85 | 34,412(0.25%)#61 | 985,560(0.01%)#1,214 |
| 62. | Posen | 80 | 34,412(0.23%)#62 | 985,560(0.01%)#1,262 |
| 63. | Rock Island | 79 | 34,412(0.23%)#63 | 985,560(0.01%)#1,268 |
| 64. | Broadview | 79 | 34,412(0.23%)#64 | 985,560(0.01%)#1,272 |
| 65. | Riverdale | 78 | 34,412(0.23%)#65 | 985,560(0.01%)#1,284 |
| 66. | Grayslake | 72 | 34,412(0.21%)#66 | 985,560(0.01%)#1,336 |
| 67. | Macomb | 72 | 34,412(0.21%)#67 | 985,560(0.01%)#1,340 |
| 68. | Lake In The Hills | 68 | 34,412(0.20%)#68 | 985,560(0.01%)#1,385 |
| 69. | Zion | 67 | 34,412(0.19%)#69 | 985,560(0.01%)#1,400 |
| 70. | Collinsville | 64 | 34,412(0.19%)#70 | 985,560(0.01%)#1,438 |
| 71. | Round Lake | 64 | 34,412(0.19%)#71 | 985,560(0.01%)#1,440 |
| 72. | Swansea | 64 | 34,412(0.19%)#72 | 985,560(0.01%)#1,442 |
| 73. | Crest Hill | 62 | 34,412(0.18%)#73 | 985,560(0.01%)#1,470 |
| 74. | Antioch | 62 | 34,412(0.18%)#74 | 985,560(0.01%)#1,475 |
| 75. | Fox Lake | 61 | 34,412(0.18%)#75 | 985,560(0.01%)#1,485 |
| 76. | Prairie Grove | 61 | 34,412(0.18%)#76 | 985,560(0.01%)#1,492 |
| 77. | Bourbonnais | 59 | 34,412(0.17%)#77 | 985,560(0.01%)#1,511 |
| 78. | Glenwood | 58 | 34,412(0.17%)#78 | 985,560(0.01%)#1,528 |
| 79. | Hanover Park | 51 | 34,412(0.15%)#79 | 985,560(0.01%)#1,621 |
| 80. | Bradley | 51 | 34,412(0.15%)#80 | 985,560(0.01%)#1,626 |
| 81. | Willowbrook | 50 | 34,412(0.15%)#81 | 985,560(0.01%)#1,649 |
| 82. | Homewood | 49 | 34,412(0.14%)#82 | 985,560(0.00%)#1,662 |
| 83. | Sterling | 49 | 34,412(0.14%)#83 | 985,560(0.00%)#1,663 |
| 84. | Bannockburn | 49 | 34,412(0.14%)#84 | 985,560(0.00%)#1,671 |
| 85. | Glendale Heights | 48 | 34,412(0.14%)#85 | 985,560(0.00%)#1,680 |
| 86. | Westmont | 48 | 34,412(0.14%)#86 | 985,560(0.00%)#1,681 |
| 87. | Chicago Heights | 47 | 34,412(0.14%)#87 | 985,560(0.00%)#1,694 |
| 88. | Glenview | 46 | 34,412(0.13%)#88 | 985,560(0.00%)#1,708 |
| 89. | Warrenville | 45 | 34,412(0.13%)#89 | 985,560(0.00%)#1,731 |
| 90. | Orland Park | 44 | 34,412(0.13%)#90 | 985,560(0.00%)#1,743 |
| 91. | Lake Holiday | 44 | 34,412(0.13%)#91 | 985,560(0.00%)#1,758 |
| 92. | Lombard | 43 | 34,412(0.12%)#92 | 985,560(0.00%)#1,767 |
| 93. | Mount Prospect | 42 | 34,412(0.12%)#93 | 985,560(0.00%)#1,781 |
| 94. | Wheaton | 42 | 34,412(0.12%)#94 | 985,560(0.00%)#1,782 |
| 95. | Flossmoor | 41 | 34,412(0.12%)#95 | 985,560(0.00%)#1,828 |
| 96. | Oak Park | 40 | 34,412(0.12%)#96 | 985,560(0.00%)#1,837 |
| 97. | Maywood | 40 | 34,412(0.12%)#97 | 985,560(0.00%)#1,846 |
| 98. | Carbon Cliff | 40 | 34,412(0.12%)#98 | 985,560(0.00%)#1,861 |
| 99. | Rantoul | 39 | 34,412(0.11%)#99 | 985,560(0.00%)#1,871 |
| 100. | Crestwood | 37 | 34,412(0.11%)#100 | 985,560(0.00%)#1,912 |
Common Questions
What are the Top 10 Cities with the Most Immigrants from Western Africa in Illinois?
Top 10 Cities with the Most Immigrants from Western Africa in Illinois are:
#1
14,678
#2
1,055
#3
904
#4
781
#5
755
#6
651
#7
599
#8
568
#9
549
#10
472
What city has the Most Immigrants from Western Africa in Illinois?
Chicago has the Most Immigrants from Western Africa in Illinois with 14,678.
What is the Total Immigrants from Western Africa in the State of Illinois?
Total Immigrants from Western Africa in Illinois is 34,412.
What is the Total Immigrants from Western Africa in the United States?
Total Immigrants from Western Africa in the United States is 985,560.