Zip Codes with the Highest Percentage of Population Employed in Food Preparation & Serving in Glenview, IL
RELATED REPORTS & OPTIONS
Food Preparation & Serving
Glenview
Compare Zip Codes
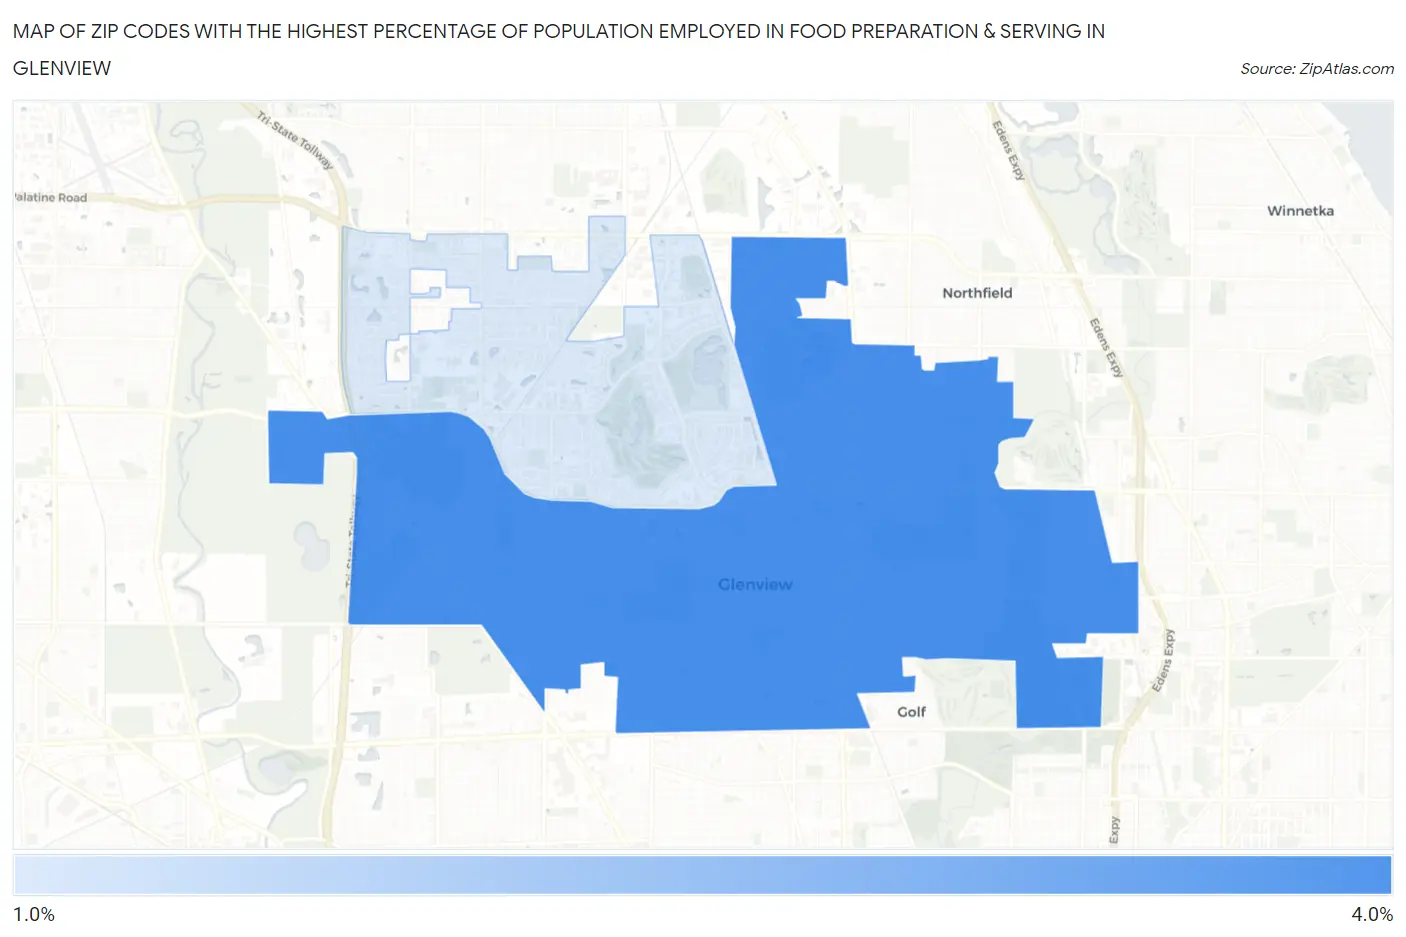
Map of Zip Codes with the Highest Percentage of Population Employed in Food Preparation & Serving in Glenview
1.6%
3.5%
Zip Codes with the Highest Percentage of Population Employed in Food Preparation & Serving in Glenview, IL
| Zip Code | % Employed | vs State | vs National | |
| 1. | 60025 | 3.5% | 5.0%(-1.56)#832 | 5.3%(-1.81)#19,304 |
| 2. | 60026 | 1.6% | 5.0%(-3.39)#1,141 | 5.3%(-3.64)#25,671 |
1
Common Questions
What are the Top Zip Codes with the Highest Percentage of Population Employed in Food Preparation & Serving in Glenview, IL?
Top Zip Codes with the Highest Percentage of Population Employed in Food Preparation & Serving in Glenview, IL are:
What zip code has the Highest Percentage of Population Employed in Food Preparation & Serving in Glenview, IL?
60025 has the Highest Percentage of Population Employed in Food Preparation & Serving in Glenview, IL with 3.5%.
What is the Percentage of Population Employed in Food Preparation & Serving in Glenview, IL?
Percentage of Population Employed in Food Preparation & Serving in Glenview is 3.2%.
What is the Percentage of Population Employed in Food Preparation & Serving in Illinois?
Percentage of Population Employed in Food Preparation & Serving in Illinois is 5.0%.
What is the Percentage of Population Employed in Food Preparation & Serving in the United States?
Percentage of Population Employed in Food Preparation & Serving in the United States is 5.3%.