Annapolis, IL Map & Demographics
Annapolis Map
Annapolis Overview
$36,509
PER CAPITA INCOME
$81,625
AVG FAMILY INCOME
$80,875
AVG HOUSEHOLD INCOME
0.18
INEQUALITY / GINI INDEX
57
TOTAL POPULATION
23
MALE POPULATION
34
FEMALE POPULATION
67.65
MALES / 100 FEMALES
147.83
FEMALES / 100 MALES
70.3
MEDIAN AGE
2.7
AVG FAMILY SIZE
2.3
AVG HOUSEHOLD SIZE
26
LABOR FORCE [ PEOPLE ]
45.6%
PERCENT IN LABOR FORCE
23.1%
UNEMPLOYMENT RATE
Annapolis Zip Codes
Annapolis Area Codes
Income in Annapolis
Income Overview in Annapolis
Per Capita Income in Annapolis is $36,509, while median incomes of families and households are $81,625 and $80,875 respectively.
| Characteristic | Number | Measure |
| Per Capita Income | 57 | $36,509 |
| Median Family Income | 19 | $81,625 |
| Mean Family Income | 19 | $86,026 |
| Median Household Income | 25 | $80,875 |
| Mean Household Income | 25 | $75,920 |
| Income Deficit | 19 | $0 |
| Wage / Income Gap (%) | 57 | 0.00% |
| Wage / Income Gap ($) | 57 | 100.00¢ per $1 |
| Gini / Inequality Index | 57 | 0.18 |
Earnings by Sex in Annapolis
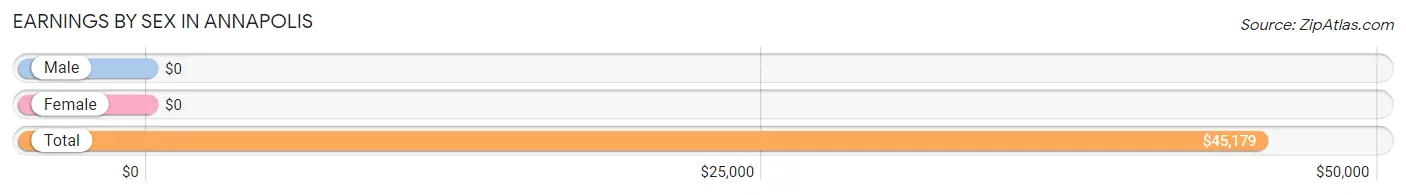
| Sex | Number | Average Earnings |
| Male | 17 (65.4%) | $0 |
| Female | 9 (34.6%) | $0 |
| Total | 26 (100.0%) | $45,179 |
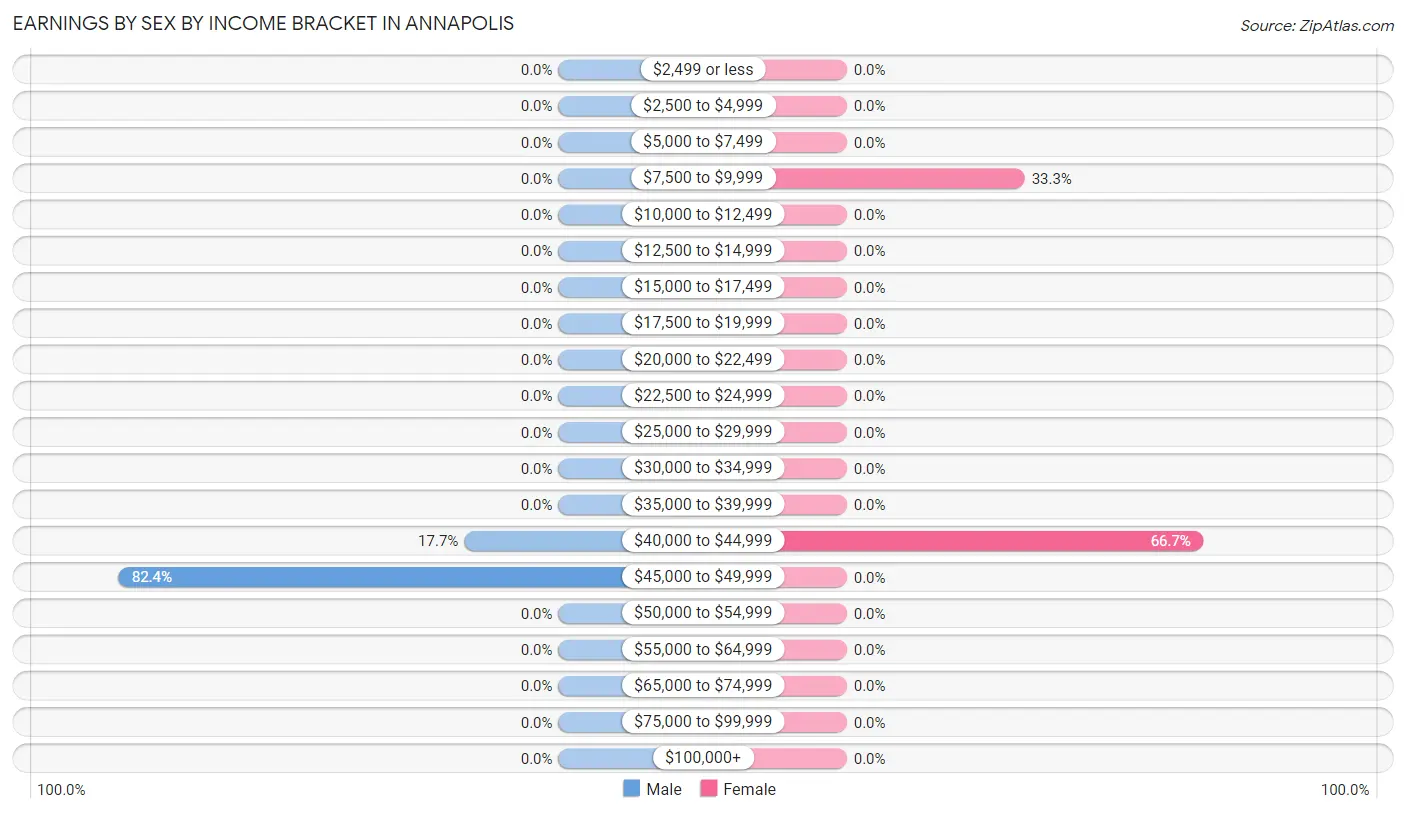
Earnings by Sex by Income Bracket in Annapolis
The most common earnings brackets in Annapolis are $45,000 to $49,999 for men (14 | 82.4%) and $40,000 to $44,999 for women (6 | 66.7%).
| Income | Male | Female |
| $2,499 or less | 0 (0.0%) | 0 (0.0%) |
| $2,500 to $4,999 | 0 (0.0%) | 0 (0.0%) |
| $5,000 to $7,499 | 0 (0.0%) | 0 (0.0%) |
| $7,500 to $9,999 | 0 (0.0%) | 3 (33.3%) |
| $10,000 to $12,499 | 0 (0.0%) | 0 (0.0%) |
| $12,500 to $14,999 | 0 (0.0%) | 0 (0.0%) |
| $15,000 to $17,499 | 0 (0.0%) | 0 (0.0%) |
| $17,500 to $19,999 | 0 (0.0%) | 0 (0.0%) |
| $20,000 to $22,499 | 0 (0.0%) | 0 (0.0%) |
| $22,500 to $24,999 | 0 (0.0%) | 0 (0.0%) |
| $25,000 to $29,999 | 0 (0.0%) | 0 (0.0%) |
| $30,000 to $34,999 | 0 (0.0%) | 0 (0.0%) |
| $35,000 to $39,999 | 0 (0.0%) | 0 (0.0%) |
| $40,000 to $44,999 | 3 (17.6%) | 6 (66.7%) |
| $45,000 to $49,999 | 14 (82.4%) | 0 (0.0%) |
| $50,000 to $54,999 | 0 (0.0%) | 0 (0.0%) |
| $55,000 to $64,999 | 0 (0.0%) | 0 (0.0%) |
| $65,000 to $74,999 | 0 (0.0%) | 0 (0.0%) |
| $75,000 to $99,999 | 0 (0.0%) | 0 (0.0%) |
| $100,000+ | 0 (0.0%) | 0 (0.0%) |
| Total | 17 (100.0%) | 9 (100.0%) |
Earnings by Sex by Educational Attainment in Annapolis
| Educational Attainment | Male Income | Female Income |
| Less than High School | - | - |
| High School Diploma | - | - |
| College or Associate's Degree | - | - |
| Bachelor's Degree | - | - |
| Graduate Degree | - | - |
| Total | - | - |
Family Income in Annapolis
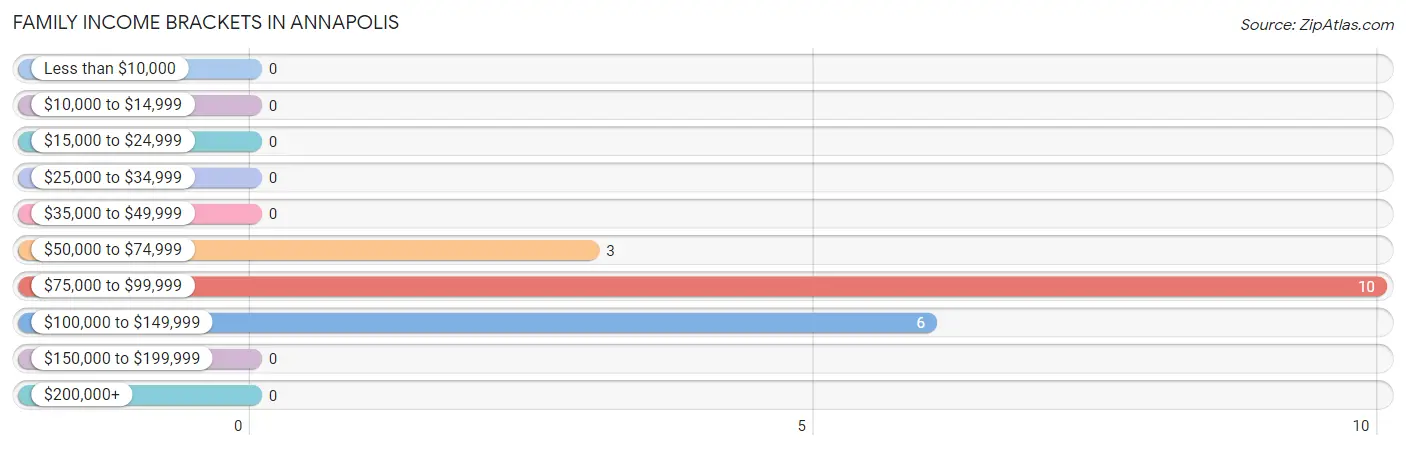
Family Income Brackets in Annapolis
According to the Annapolis family income data, there are 10 families falling into the $75,000 to $99,999 income range, which is the most common income bracket and makes up 52.6% of all families.
| Income Bracket | # Families | % Families |
| Less than $10,000 | 0 | 0.0% |
| $10,000 to $14,999 | 0 | 0.0% |
| $15,000 to $24,999 | 0 | 0.0% |
| $25,000 to $34,999 | 0 | 0.0% |
| $35,000 to $49,999 | 0 | 0.0% |
| $50,000 to $74,999 | 3 | 15.8% |
| $75,000 to $99,999 | 10 | 52.6% |
| $100,000 to $149,999 | 6 | 31.6% |
| $150,000 to $199,999 | 0 | 0.0% |
| $200,000+ | 0 | 0.0% |
Family Income by Famaliy Size in Annapolis
| Income Bracket | # Families | Median Income |
| 2-Person Families | 6 (31.6%) | $0 |
| 3-Person Families | 13 (68.4%) | $0 |
| 4-Person Families | 0 (0.0%) | $0 |
| 5-Person Families | 0 (0.0%) | $0 |
| 6-Person Families | 0 (0.0%) | $0 |
| 7+ Person Families | 0 (0.0%) | $0 |
| Total | 19 (100.0%) | $81,625 |
Family Income by Number of Earners in Annapolis
| Number of Earners | # Families | Median Income |
| No Earners | 6 (31.6%) | $0 |
| 1 Earner | 10 (52.6%) | $0 |
| 2 Earners | 3 (15.8%) | $0 |
| 3+ Earners | 0 (0.0%) | $0 |
| Total | 19 (100.0%) | $81,625 |
Household Income in Annapolis
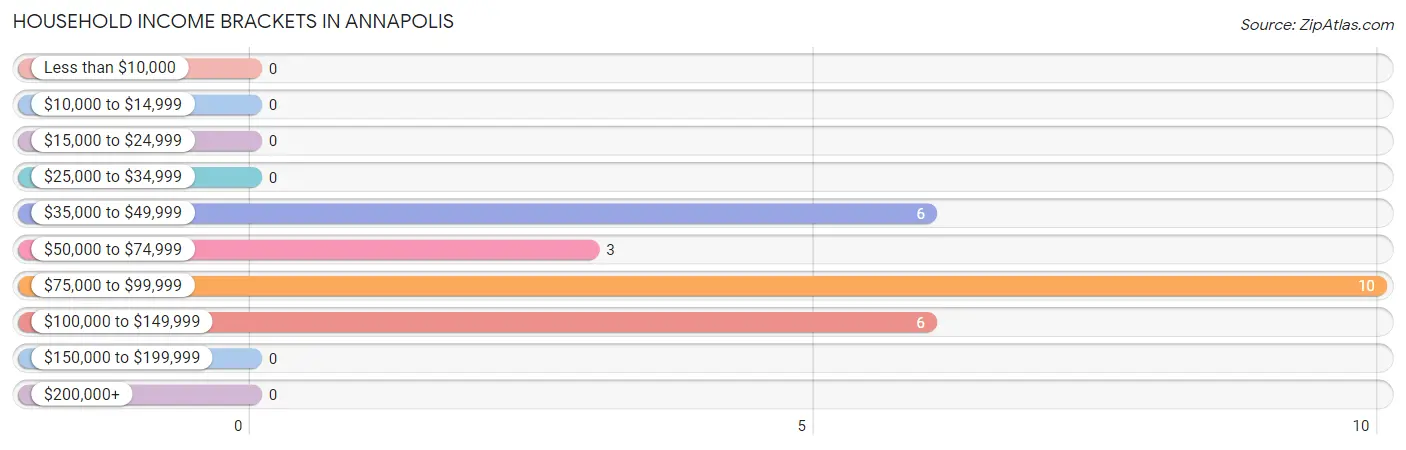
Household Income Brackets in Annapolis
With 10 households falling in the category, the $75,000 to $99,999 income range is the most frequent in Annapolis, accounting for 40.0% of all households.
| Income Bracket | # Households | % Households |
| Less than $10,000 | 0 | 0.0% |
| $10,000 to $14,999 | 0 | 0.0% |
| $15,000 to $24,999 | 0 | 0.0% |
| $25,000 to $34,999 | 0 | 0.0% |
| $35,000 to $49,999 | 6 | 24.0% |
| $50,000 to $74,999 | 3 | 12.0% |
| $75,000 to $99,999 | 10 | 40.0% |
| $100,000 to $149,999 | 6 | 24.0% |
| $150,000 to $199,999 | 0 | 0.0% |
| $200,000+ | 0 | 0.0% |
Household Income by Householder Age in Annapolis
| Income Bracket | # Households | Median Income |
| 15 to 24 Years | 0 (0.0%) | $0 |
| 25 to 44 Years | 0 (0.0%) | $0 |
| 45 to 64 Years | 9 (36.0%) | $0 |
| 65+ Years | 16 (64.0%) | $0 |
| Total | 25 (100.0%) | $80,875 |
Poverty in Annapolis
Income Below Poverty by Sex and Age in Annapolis
| Age Bracket | Male | Female |
| Under 5 Years | 0 (0.0%) | 0 (0.0%) |
| 5 Years | 0 (0.0%) | 0 (0.0%) |
| 6 to 11 Years | 0 (0.0%) | 0 (0.0%) |
| 12 to 14 Years | 0 (0.0%) | 0 (0.0%) |
| 15 Years | 0 (0.0%) | 0 (0.0%) |
| 16 and 17 Years | 0 (0.0%) | 0 (0.0%) |
| 18 to 24 Years | 0 (0.0%) | 0 (0.0%) |
| 25 to 34 Years | 0 (0.0%) | 0 (0.0%) |
| 35 to 44 Years | 0 (0.0%) | 0 (0.0%) |
| 45 to 54 Years | 0 (0.0%) | 0 (0.0%) |
| 55 to 64 Years | 0 (0.0%) | 0 (0.0%) |
| 65 to 74 Years | 0 (0.0%) | 0 (0.0%) |
| 75 Years and over | 0 (0.0%) | 0 (0.0%) |
| Total | 0 (0.0%) | 0 (0.0%) |
Income Above Poverty by Sex and Age in Annapolis
According to the poverty statistics in Annapolis, males aged 45 to 54 years and females aged 16 and 17 years are the age groups that are most secure financially, with 100.0% of males and 100.0% of females in these age groups living above the poverty line.
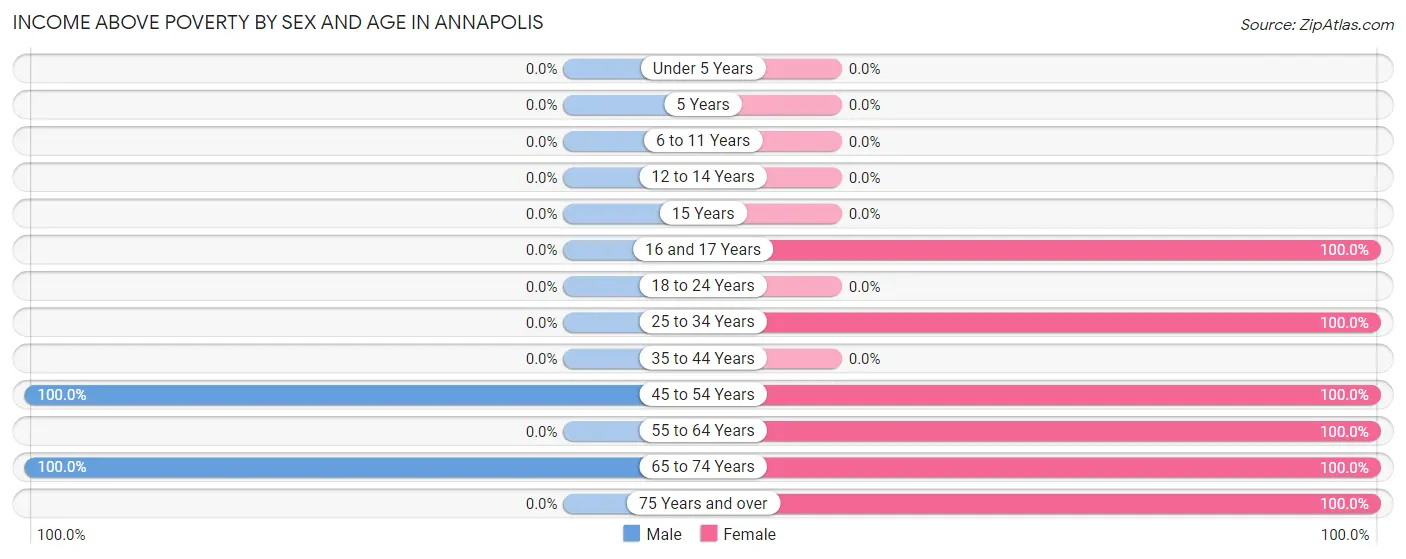
| Age Bracket | Male | Female |
| Under 5 Years | 0 (0.0%) | 0 (0.0%) |
| 5 Years | 0 (0.0%) | 0 (0.0%) |
| 6 to 11 Years | 0 (0.0%) | 0 (0.0%) |
| 12 to 14 Years | 0 (0.0%) | 0 (0.0%) |
| 15 Years | 0 (0.0%) | 0 (0.0%) |
| 16 and 17 Years | 0 (0.0%) | 3 (100.0%) |
| 18 to 24 Years | 0 (0.0%) | 0 (0.0%) |
| 25 to 34 Years | 0 (0.0%) | 8 (100.0%) |
| 35 to 44 Years | 0 (0.0%) | 0 (0.0%) |
| 45 to 54 Years | 3 (100.0%) | 3 (100.0%) |
| 55 to 64 Years | 0 (0.0%) | 6 (100.0%) |
| 65 to 74 Years | 20 (100.0%) | 10 (100.0%) |
| 75 Years and over | 0 (0.0%) | 4 (100.0%) |
| Total | 23 (100.0%) | 34 (100.0%) |
Income Below Poverty Among Married-Couple Families in Annapolis
| Children | Above Poverty | Below Poverty |
| No Children | 16 (100.0%) | 0 (0.0%) |
| 1 or 2 Children | 3 (100.0%) | 0 (0.0%) |
| 3 or 4 Children | 0 (0.0%) | 0 (0.0%) |
| 5 or more Children | 0 (0.0%) | 0 (0.0%) |
| Total | 19 (100.0%) | 0 (0.0%) |
Income Below Poverty Among Single-Parent Households in Annapolis
| Children | Single Father | Single Mother |
| No Children | 0 (0.0%) | 0 (0.0%) |
| 1 or 2 Children | 0 (0.0%) | 0 (0.0%) |
| 3 or 4 Children | 0 (0.0%) | 0 (0.0%) |
| 5 or more Children | 0 (0.0%) | 0 (0.0%) |
| Total | 0 (0.0%) | 0 (0.0%) |
Income Below Poverty Among Married-Couple vs Single-Parent Households in Annapolis
| Children | Married-Couple Families | Single-Parent Households |
| No Children | 0 (0.0%) | 0 (0.0%) |
| 1 or 2 Children | 0 (0.0%) | 0 (0.0%) |
| 3 or 4 Children | 0 (0.0%) | 0 (0.0%) |
| 5 or more Children | 0 (0.0%) | 0 (0.0%) |
| Total | 0 (0.0%) | 0 (0.0%) |
Race in Annapolis
The most populous races in Annapolis are , and White / Caucasian (57 | 100.0%).
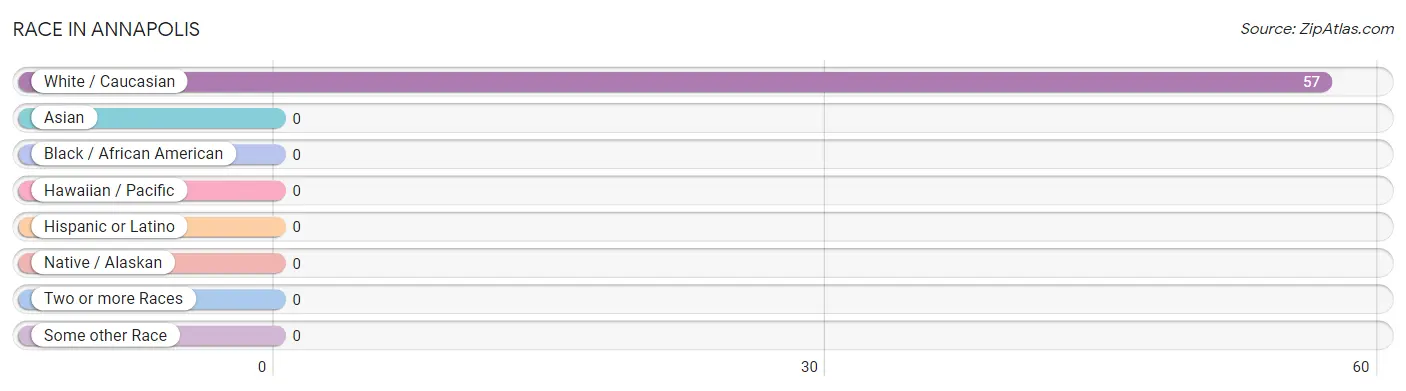
| Race | # Population | % Population |
| Asian | 0 | 0.0% |
| Black / African American | 0 | 0.0% |
| Hawaiian / Pacific | 0 | 0.0% |
| Hispanic or Latino | 0 | 0.0% |
| Native / Alaskan | 0 | 0.0% |
| White / Caucasian | 57 | 100.0% |
| Two or more Races | 0 | 0.0% |
| Some other Race | 0 | 0.0% |
| Total | 57 | 100.0% |
Ancestry in Annapolis
The most populous ancestries reported in Annapolis are , and American (9 | 15.8%), together accounting for 15.8% of all Annapolis residents.

| Ancestry | # Population | % Population |
| American | 9 | 15.8% | View All 1 Rows |
Immigrants in Annapolis

| Immigration Origin | # Population | % Population | View All 0 Rows |
Sex and Age in Annapolis
Sex and Age in Annapolis
The most populous age groups in Annapolis are 70 to 74 Years (20 | 87.0%) for men and 70 to 74 Years (10 | 29.4%) for women.
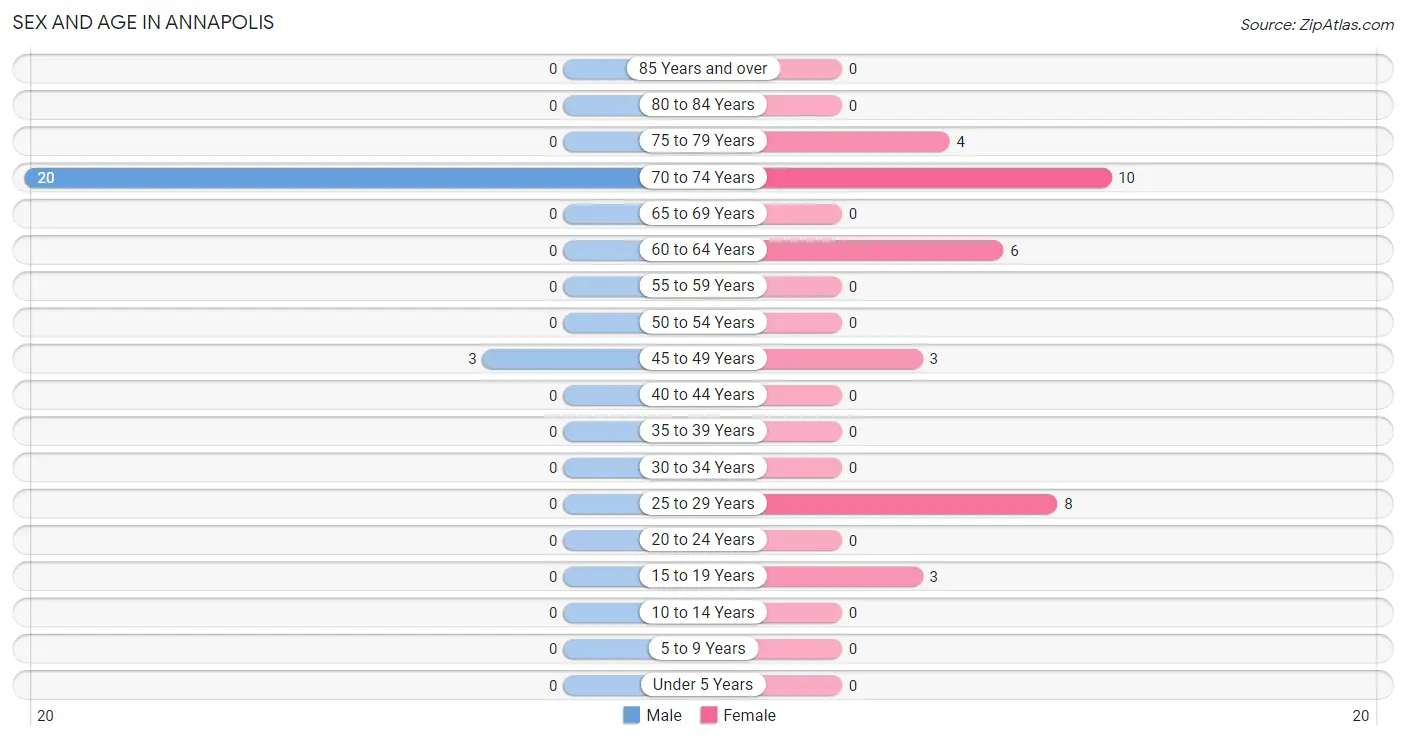
| Age Bracket | Male | Female |
| Under 5 Years | 0 (0.0%) | 0 (0.0%) |
| 5 to 9 Years | 0 (0.0%) | 0 (0.0%) |
| 10 to 14 Years | 0 (0.0%) | 0 (0.0%) |
| 15 to 19 Years | 0 (0.0%) | 3 (8.8%) |
| 20 to 24 Years | 0 (0.0%) | 0 (0.0%) |
| 25 to 29 Years | 0 (0.0%) | 8 (23.5%) |
| 30 to 34 Years | 0 (0.0%) | 0 (0.0%) |
| 35 to 39 Years | 0 (0.0%) | 0 (0.0%) |
| 40 to 44 Years | 0 (0.0%) | 0 (0.0%) |
| 45 to 49 Years | 3 (13.0%) | 3 (8.8%) |
| 50 to 54 Years | 0 (0.0%) | 0 (0.0%) |
| 55 to 59 Years | 0 (0.0%) | 0 (0.0%) |
| 60 to 64 Years | 0 (0.0%) | 6 (17.6%) |
| 65 to 69 Years | 0 (0.0%) | 0 (0.0%) |
| 70 to 74 Years | 20 (87.0%) | 10 (29.4%) |
| 75 to 79 Years | 0 (0.0%) | 4 (11.8%) |
| 80 to 84 Years | 0 (0.0%) | 0 (0.0%) |
| 85 Years and over | 0 (0.0%) | 0 (0.0%) |
| Total | 23 (100.0%) | 34 (100.0%) |
Families and Households in Annapolis
Median Family Size in Annapolis
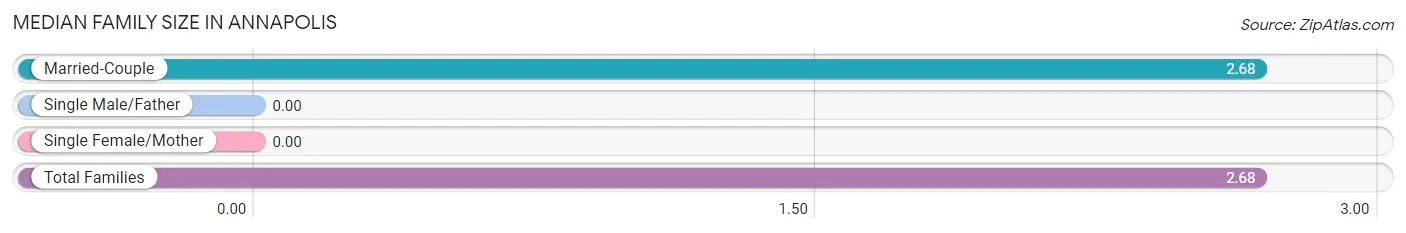
| Family Type | # Families | Family Size |
| Married-Couple | 19 (100.0%) | 2.68 |
| Single Male/Father | 0 (0.0%) | - |
| Single Female/Mother | 0 (0.0%) | - |
| Total Families | 19 (100.0%) | 2.68 |
Median Household Size in Annapolis
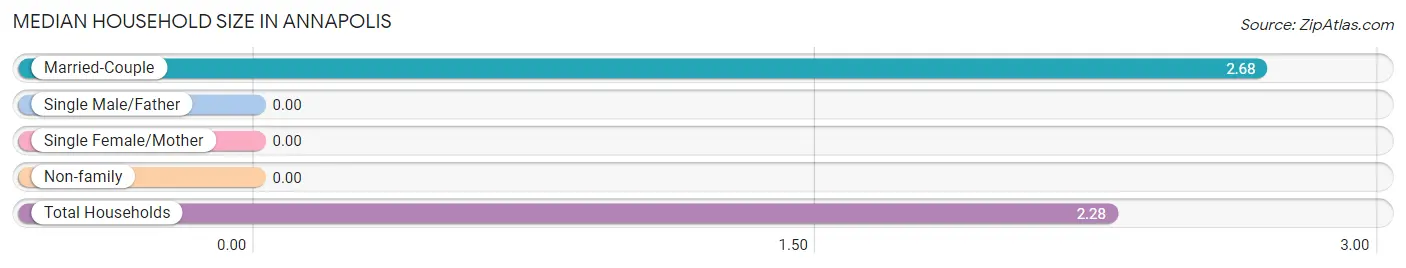
| Household Type | # Households | Household Size |
| Married-Couple | 19 (76.0%) | 2.68 |
| Single Male/Father | 0 (0.0%) | - |
| Single Female/Mother | 0 (0.0%) | - |
| Non-family | 6 (24.0%) | - |
| Total Households | 25 (100.0%) | 2.28 |
Household Size by Marriage Status in Annapolis
Out of a total of 25 households in Annapolis, 19 (76.0%) are family households, while 6 (24.0%) are nonfamily households. The most numerous type of family households are 3-person households, comprising 13, and the most common type of nonfamily households are 1-person households, comprising 6.
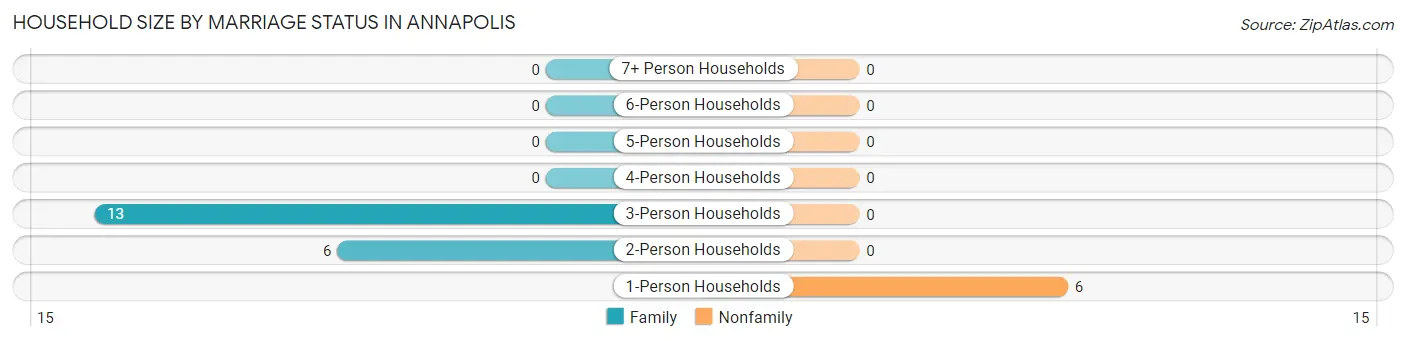
| Household Size | Family Households | Nonfamily Households |
| 1-Person Households | - | 6 (24.0%) |
| 2-Person Households | 6 (24.0%) | 0 (0.0%) |
| 3-Person Households | 13 (52.0%) | 0 (0.0%) |
| 4-Person Households | 0 (0.0%) | 0 (0.0%) |
| 5-Person Households | 0 (0.0%) | 0 (0.0%) |
| 6-Person Households | 0 (0.0%) | 0 (0.0%) |
| 7+ Person Households | 0 (0.0%) | 0 (0.0%) |
| Total | 19 (76.0%) | 6 (24.0%) |
Female Fertility in Annapolis
Fertility by Age in Annapolis
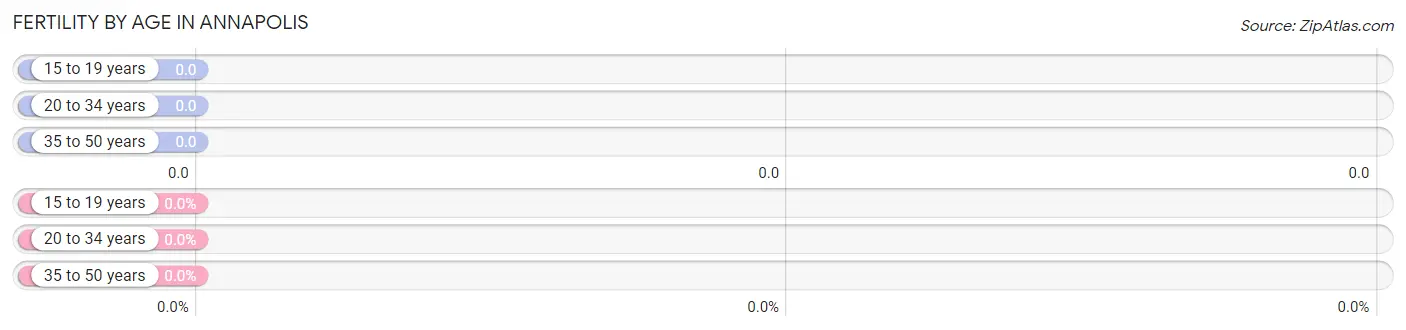
| Age Bracket | Women with Births | Births / 1,000 Women |
| 15 to 19 years | 0 (0.0%) | 0.0 |
| 20 to 34 years | 0 (0.0%) | 0.0 |
| 35 to 50 years | 0 (0.0%) | 0.0 |
| Total | 0 (0.0%) | 0.0 |
Fertility by Age by Marriage Status in Annapolis
| Age Bracket | Married | Unmarried |
| 15 to 19 years | 0 (0.0%) | 0 (0.0%) |
| 20 to 34 years | 0 (0.0%) | 0 (0.0%) |
| 35 to 50 years | 0 (0.0%) | 0 (0.0%) |
| Total | 0 (0.0%) | 0 (0.0%) |
Fertility by Education in Annapolis
| Educational Attainment | Women with Births | Births / 1,000 Women |
| Less than High School | 0 (0.0%) | 0.0 |
| High School Diploma | 0 (0.0%) | 0.0 |
| College or Associate's Degree | 0 (0.0%) | 0.0 |
| Bachelor's Degree | 0 (0.0%) | 0.0 |
| Graduate Degree | 0 (0.0%) | 0.0 |
| Total | 0 (0.0%) | 0.0 |
Fertility by Education by Marriage Status in Annapolis
| Educational Attainment | Married | Unmarried |
| Less than High School | 0 (0.0%) | 0 (0.0%) |
| High School Diploma | 0 (0.0%) | 0 (0.0%) |
| College or Associate's Degree | 0 (0.0%) | 0 (0.0%) |
| Bachelor's Degree | 0 (0.0%) | 0 (0.0%) |
| Graduate Degree | 0 (0.0%) | 0 (0.0%) |
| Total | 0 (0.0%) | 0 (0.0%) |
Employment Characteristics in Annapolis
Employment by Class of Employer in Annapolis
Among the 20 employed individuals in Annapolis, , and private company employees (20 | 100.0%) make up the most common classes of employment.
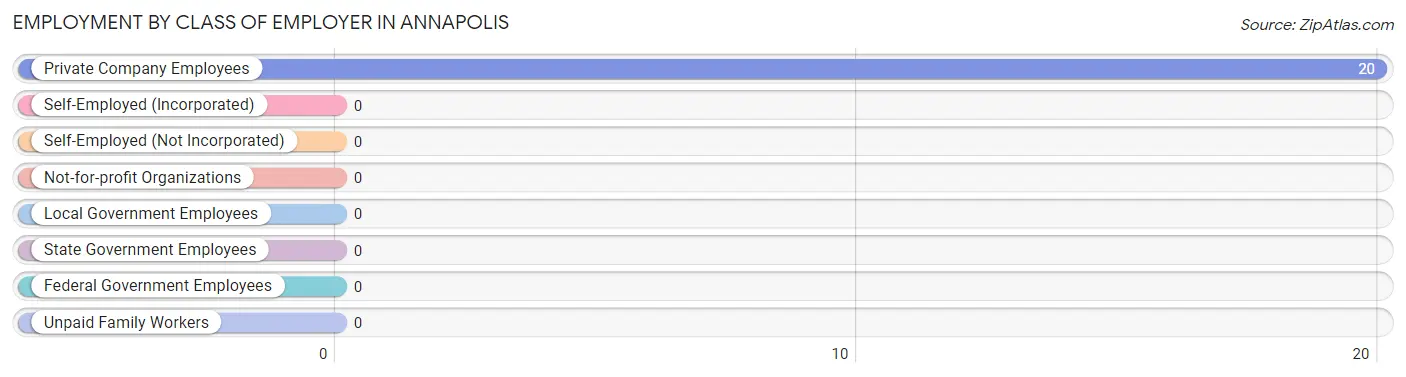
| Employer Class | # Employees | % Employees |
| Private Company Employees | 20 | 100.0% |
| Self-Employed (Incorporated) | 0 | 0.0% |
| Self-Employed (Not Incorporated) | 0 | 0.0% |
| Not-for-profit Organizations | 0 | 0.0% |
| Local Government Employees | 0 | 0.0% |
| State Government Employees | 0 | 0.0% |
| Federal Government Employees | 0 | 0.0% |
| Unpaid Family Workers | 0 | 0.0% |
| Total | 20 | 100.0% |
Employment Status by Age in Annapolis
According to the labor force statistics for Annapolis, out of the total population over 16 years of age (57), 45.6% or 26 individuals are in the labor force, with 23.1% or 6 of them unemployed. The age group with the highest labor force participation rate is 16 to 19 years, with 100.0% or 3 individuals in the labor force. Within the labor force, the 60 to 64 years age range has the highest percentage of unemployed individuals, with 100.0% or 6 of them being unemployed.
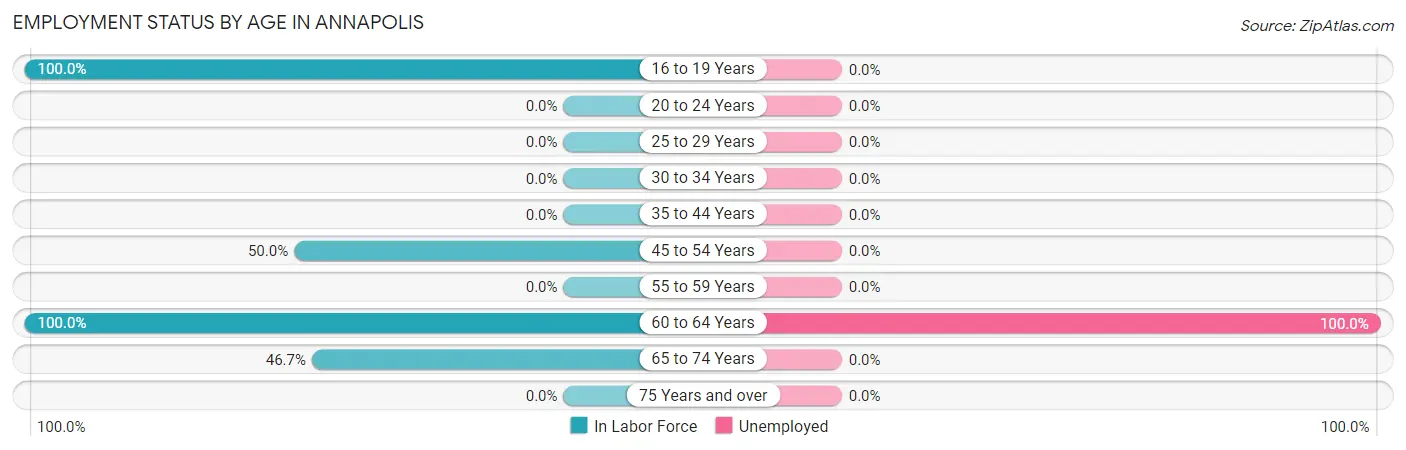
| Age Bracket | In Labor Force | Unemployed |
| 16 to 19 Years | 3 (100.0%) | 0 (0.0%) |
| 20 to 24 Years | 0 (0.0%) | 0 (0.0%) |
| 25 to 29 Years | 0 (0.0%) | 0 (0.0%) |
| 30 to 34 Years | 0 (0.0%) | 0 (0.0%) |
| 35 to 44 Years | 0 (0.0%) | 0 (0.0%) |
| 45 to 54 Years | 3 (50.0%) | 0 (0.0%) |
| 55 to 59 Years | 0 (0.0%) | 0 (0.0%) |
| 60 to 64 Years | 6 (100.0%) | 6 (100.0%) |
| 65 to 74 Years | 14 (46.7%) | 0 (0.0%) |
| 75 Years and over | 0 (0.0%) | 0 (0.0%) |
| Total | 26 (45.6%) | 6 (23.1%) |
Employment Status by Educational Attainment in Annapolis
According to labor force statistics for Annapolis, 45.0% of individuals (9) out of the total population between 25 and 64 years of age (20) are in the labor force, with 66.7% or 6 of them being unemployed. The group with the highest labor force participation rate are those with the educational attainment of high school diploma, with 100.0% or 9 individuals in the labor force. Within the labor force, individuals with high school diploma education have the highest percentage of unemployment, with 66.7% or 6 of them being unemployed.
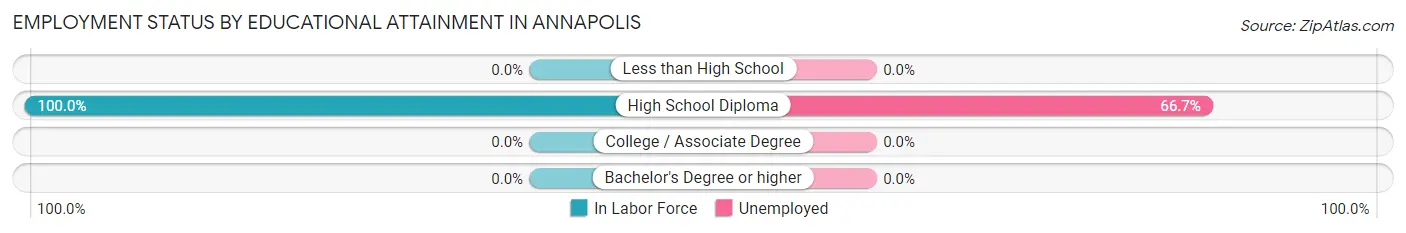
| Educational Attainment | In Labor Force | Unemployed |
| Less than High School | 0 (0.0%) | 0 (0.0%) |
| High School Diploma | 9 (100.0%) | 6 (66.7%) |
| College / Associate Degree | 0 (0.0%) | 0 (0.0%) |
| Bachelor's Degree or higher | 0 (0.0%) | 0 (0.0%) |
| Total | 9 (45.0%) | 13 (66.7%) |
Employment Occupations by Sex in Annapolis
Management, Business, Science and Arts Occupations
Management, Business, Science and Arts Occupations by Sex
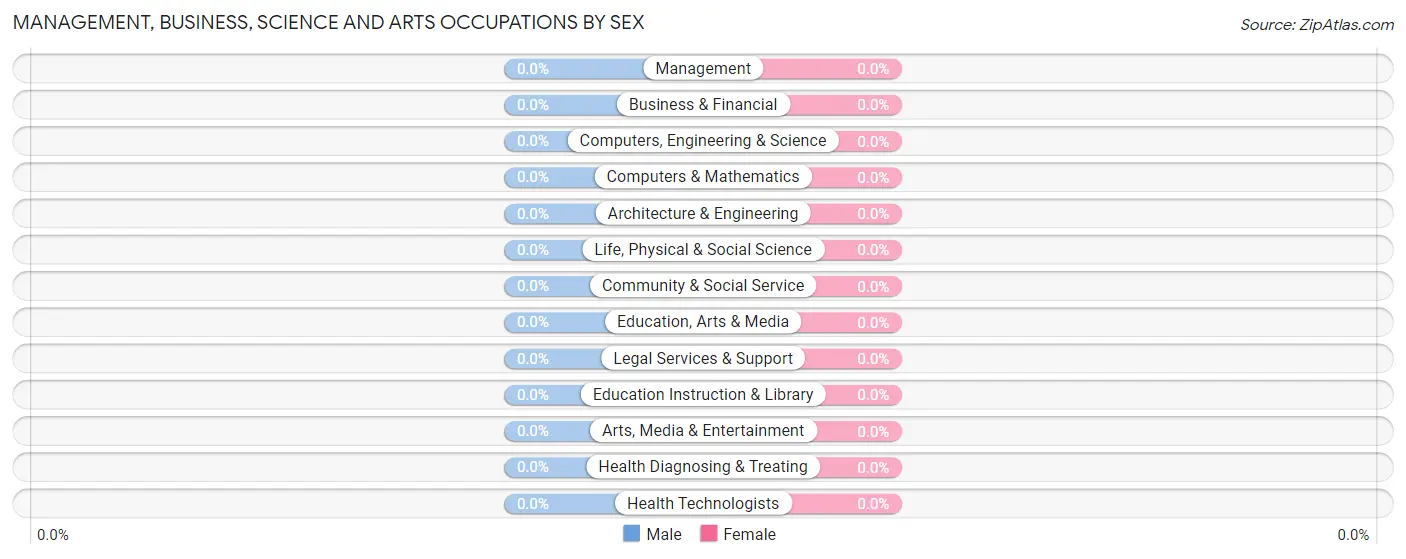
| Occupation | Male | Female |
| Management | 0 (0.0%) | 0 (0.0%) |
| Business & Financial | 0 (0.0%) | 0 (0.0%) |
| Computers, Engineering & Science | 0 (0.0%) | 0 (0.0%) |
| Computers & Mathematics | 0 (0.0%) | 0 (0.0%) |
| Architecture & Engineering | 0 (0.0%) | 0 (0.0%) |
| Life, Physical & Social Science | 0 (0.0%) | 0 (0.0%) |
| Community & Social Service | 0 (0.0%) | 0 (0.0%) |
| Education, Arts & Media | 0 (0.0%) | 0 (0.0%) |
| Legal Services & Support | 0 (0.0%) | 0 (0.0%) |
| Education Instruction & Library | 0 (0.0%) | 0 (0.0%) |
| Arts, Media & Entertainment | 0 (0.0%) | 0 (0.0%) |
| Health Diagnosing & Treating | 0 (0.0%) | 0 (0.0%) |
| Health Technologists | 0 (0.0%) | 0 (0.0%) |
| Total (Category) | 0 (0.0%) | 0 (0.0%) |
| Total (Overall) | 17 (85.0%) | 3 (15.0%) |
Services Occupations
The most common Services occupations in Annapolis are , and Food Preparation & Serving (3 | 15.0%).
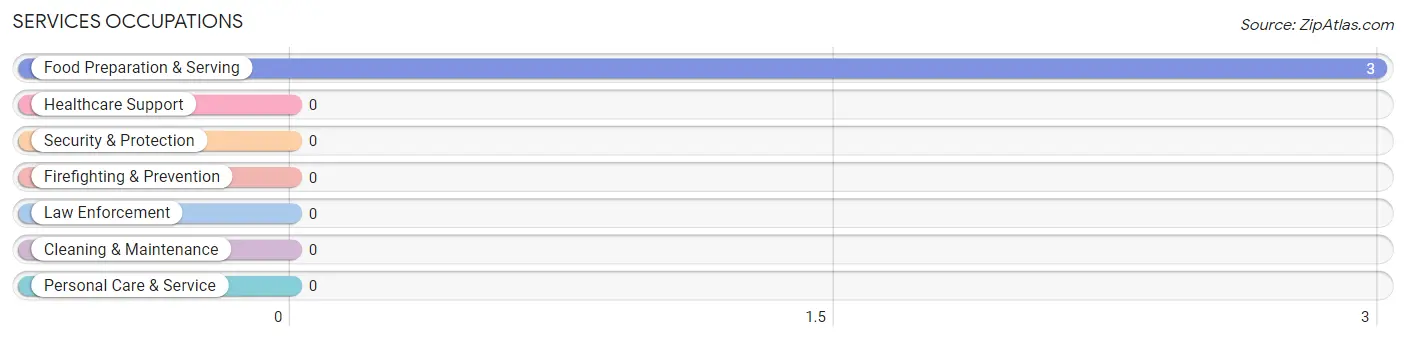
Services Occupations by Sex
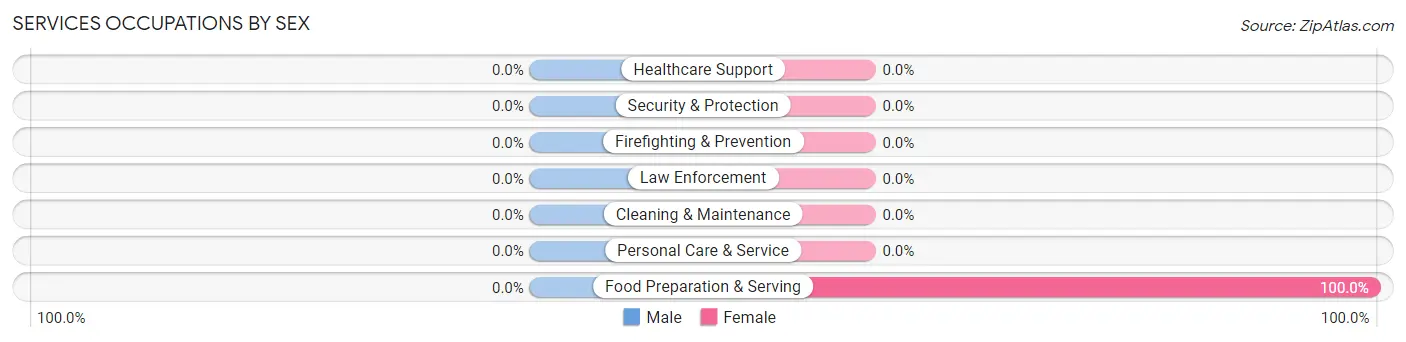
| Occupation | Male | Female |
| Healthcare Support | 0 (0.0%) | 0 (0.0%) |
| Security & Protection | 0 (0.0%) | 0 (0.0%) |
| Firefighting & Prevention | 0 (0.0%) | 0 (0.0%) |
| Law Enforcement | 0 (0.0%) | 0 (0.0%) |
| Food Preparation & Serving | 0 (0.0%) | 3 (100.0%) |
| Cleaning & Maintenance | 0 (0.0%) | 0 (0.0%) |
| Personal Care & Service | 0 (0.0%) | 0 (0.0%) |
| Total (Category) | 0 (0.0%) | 3 (100.0%) |
| Total (Overall) | 17 (85.0%) | 3 (15.0%) |
Sales and Office Occupations
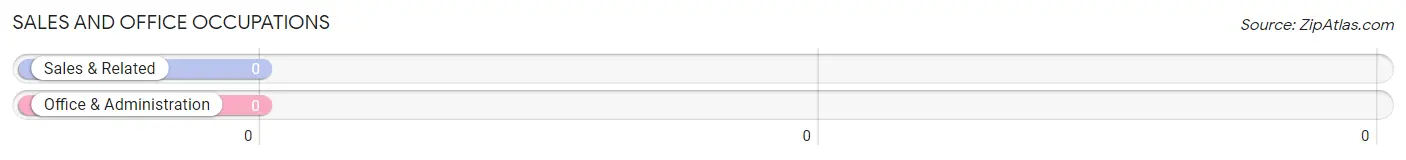
Sales and Office Occupations by Sex
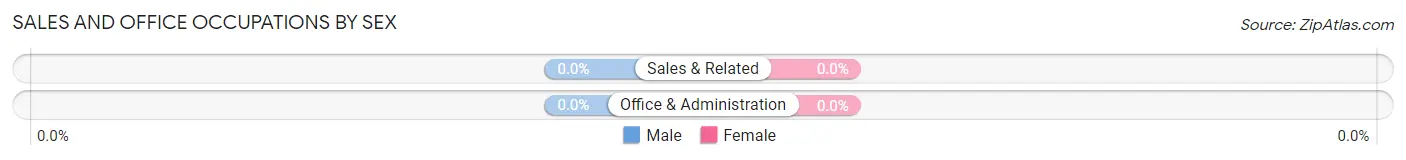
| Occupation | Male | Female |
| Sales & Related | 0 (0.0%) | 0 (0.0%) |
| Office & Administration | 0 (0.0%) | 0 (0.0%) |
| Total (Category) | 0 (0.0%) | 0 (0.0%) |
| Total (Overall) | 17 (85.0%) | 3 (15.0%) |
Natural Resources, Construction and Maintenance Occupations
Natural Resources, Construction and Maintenance Occupations by Sex
| Occupation | Male | Female |
| Farming, Fishing & Forestry | 0 (0.0%) | 0 (0.0%) |
| Construction & Extraction | 0 (0.0%) | 0 (0.0%) |
| Installation, Maintenance & Repair | 0 (0.0%) | 0 (0.0%) |
| Total (Category) | 0 (0.0%) | 0 (0.0%) |
| Total (Overall) | 17 (85.0%) | 3 (15.0%) |
Production, Transportation and Moving Occupations
The most common Production, Transportation and Moving occupations in Annapolis are Material Moving (14 | 70.0%), and Transportation (3 | 15.0%).
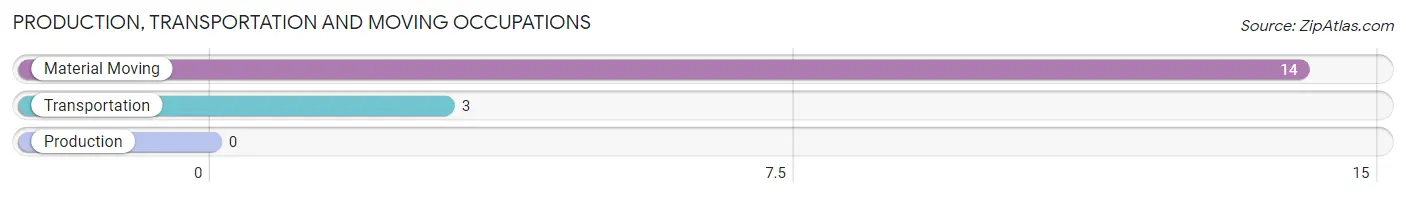
Production, Transportation and Moving Occupations by Sex
| Occupation | Male | Female |
| Production | 0 (0.0%) | 0 (0.0%) |
| Transportation | 3 (100.0%) | 0 (0.0%) |
| Material Moving | 14 (100.0%) | 0 (0.0%) |
| Total (Category) | 17 (100.0%) | 0 (0.0%) |
| Total (Overall) | 17 (85.0%) | 3 (15.0%) |
Employment Industries by Sex in Annapolis
Employment Industries in Annapolis
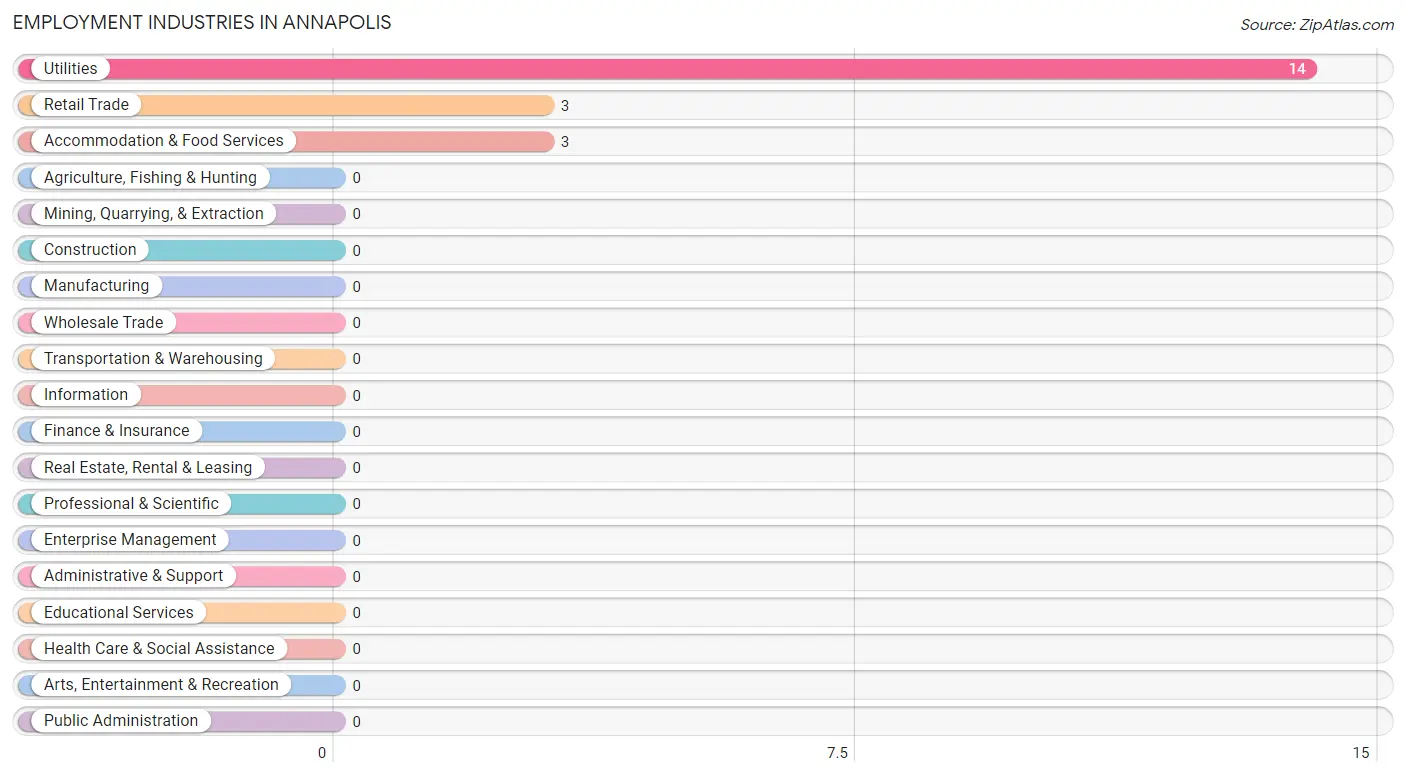
The major employment industries in Annapolis include Utilities (14 | 70.0%), Retail Trade (3 | 15.0%), and Accommodation & Food Services (3 | 15.0%).
Employment Industries by Sex in Annapolis
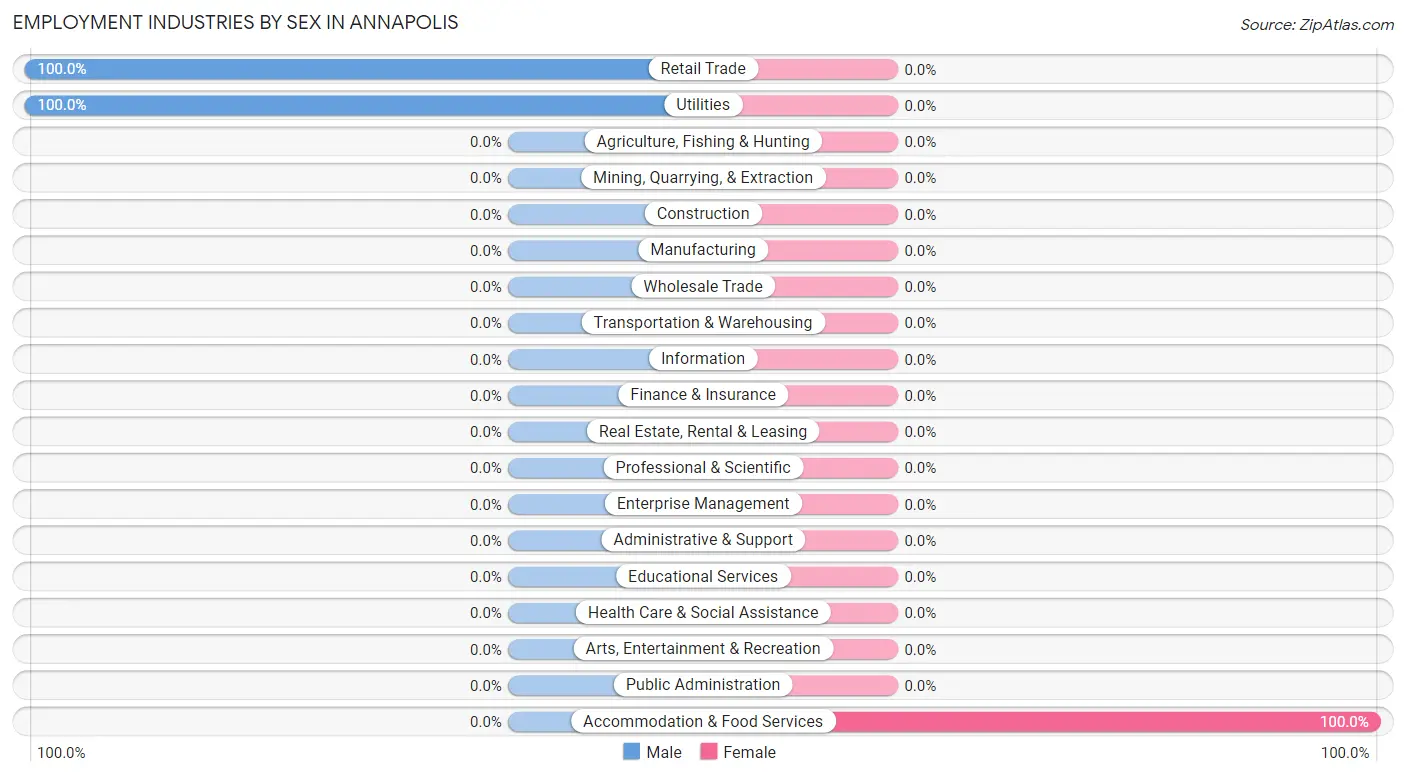
| Industry | Male | Female |
| Agriculture, Fishing & Hunting | 0 (0.0%) | 0 (0.0%) |
| Mining, Quarrying, & Extraction | 0 (0.0%) | 0 (0.0%) |
| Construction | 0 (0.0%) | 0 (0.0%) |
| Manufacturing | 0 (0.0%) | 0 (0.0%) |
| Wholesale Trade | 0 (0.0%) | 0 (0.0%) |
| Retail Trade | 3 (100.0%) | 0 (0.0%) |
| Transportation & Warehousing | 0 (0.0%) | 0 (0.0%) |
| Utilities | 14 (100.0%) | 0 (0.0%) |
| Information | 0 (0.0%) | 0 (0.0%) |
| Finance & Insurance | 0 (0.0%) | 0 (0.0%) |
| Real Estate, Rental & Leasing | 0 (0.0%) | 0 (0.0%) |
| Professional & Scientific | 0 (0.0%) | 0 (0.0%) |
| Enterprise Management | 0 (0.0%) | 0 (0.0%) |
| Administrative & Support | 0 (0.0%) | 0 (0.0%) |
| Educational Services | 0 (0.0%) | 0 (0.0%) |
| Health Care & Social Assistance | 0 (0.0%) | 0 (0.0%) |
| Arts, Entertainment & Recreation | 0 (0.0%) | 0 (0.0%) |
| Accommodation & Food Services | 0 (0.0%) | 3 (100.0%) |
| Public Administration | 0 (0.0%) | 0 (0.0%) |
| Total | 17 (85.0%) | 3 (15.0%) |
Education in Annapolis
School Enrollment in Annapolis
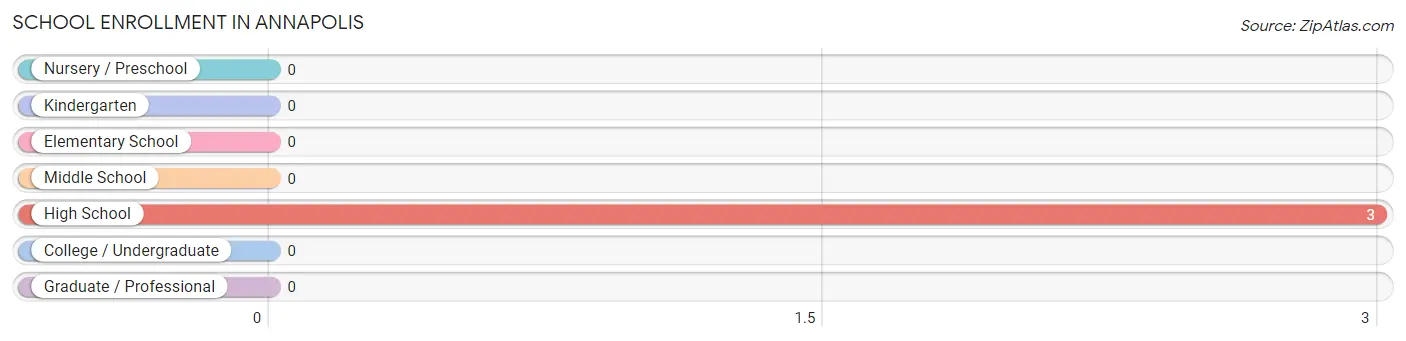
| School Level | # Students | % Students |
| Nursery / Preschool | 0 | 0.0% |
| Kindergarten | 0 | 0.0% |
| Elementary School | 0 | 0.0% |
| Middle School | 0 | 0.0% |
| High School | 3 | 100.0% |
| College / Undergraduate | 0 | 0.0% |
| Graduate / Professional | 0 | 0.0% |
| Total | 3 | 100.0% |
School Enrollment by Age by Funding Source in Annapolis
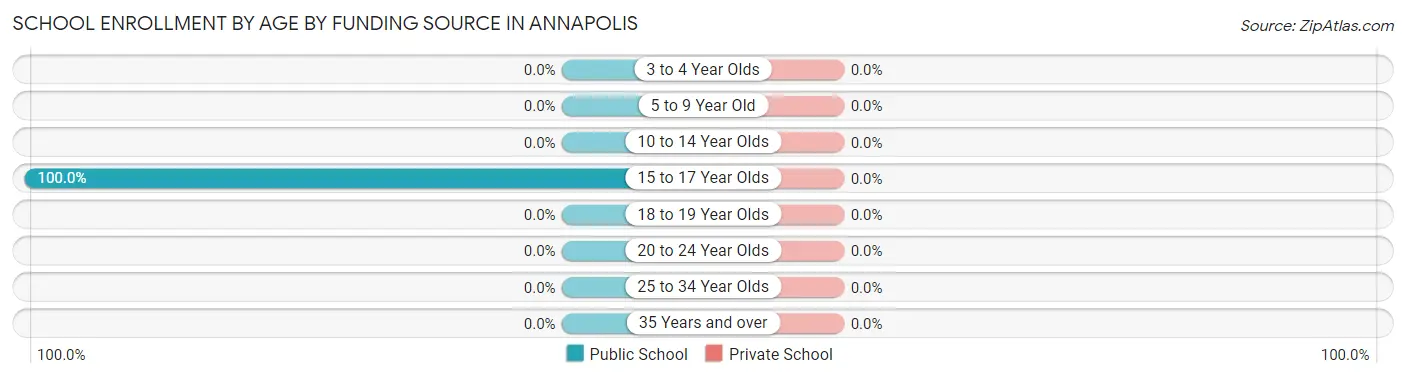
| Age Bracket | Public School | Private School |
| 3 to 4 Year Olds | 0 (0.0%) | 0 (0.0%) |
| 5 to 9 Year Old | 0 (0.0%) | 0 (0.0%) |
| 10 to 14 Year Olds | 0 (0.0%) | 0 (0.0%) |
| 15 to 17 Year Olds | 3 (100.0%) | 0 (0.0%) |
| 18 to 19 Year Olds | 0 (0.0%) | 0 (0.0%) |
| 20 to 24 Year Olds | 0 (0.0%) | 0 (0.0%) |
| 25 to 34 Year Olds | 0 (0.0%) | 0 (0.0%) |
| 35 Years and over | 0 (0.0%) | 0 (0.0%) |
| Total | 3 (100.0%) | 0 (0.0%) |
Educational Attainment by Field of Study in Annapolis
| Field of Study | # Graduates | % Graduates |
| Computers & Mathematics | 0 | 0.0% |
| Bio, Nature & Agricultural | 0 | 0.0% |
| Physical & Health Sciences | 0 | 0.0% |
| Psychology | 0 | 0.0% |
| Social Sciences | 0 | 0.0% |
| Engineering | 0 | 0.0% |
| Multidisciplinary Studies | 0 | 0.0% |
| Science & Technology | 0 | 0.0% |
| Business | 0 | 0.0% |
| Education | 0 | 0.0% |
| Literature & Languages | 0 | 0.0% |
| Liberal Arts & History | 0 | 0.0% |
| Visual & Performing Arts | 0 | 0.0% |
| Communications | 0 | 0.0% |
| Arts & Humanities | 0 | 0.0% |
| Total | 0 | 0.0% |
Transportation & Commute in Annapolis
Vehicle Availability by Sex in Annapolis
The most prevalent vehicle ownership categories in Annapolis are males with 2 vehicles (14, accounting for 82.4%) and females with 2 vehicles (0, making up 466.7%).
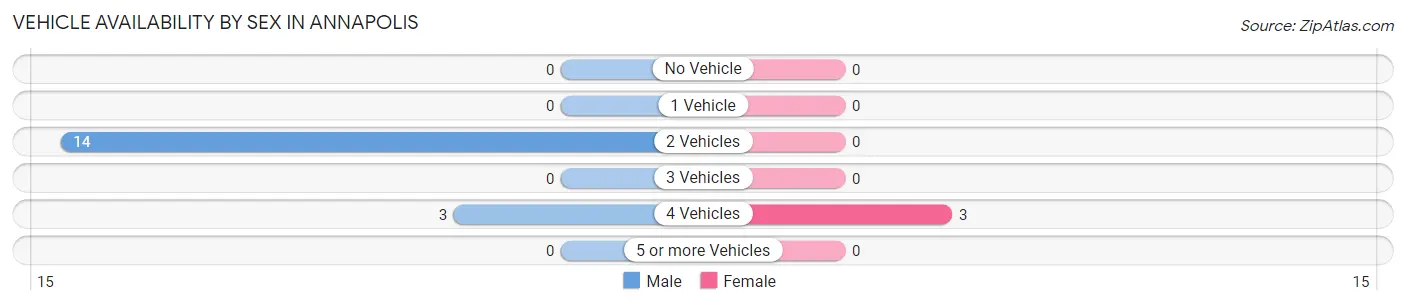
| Vehicles Available | Male | Female |
| No Vehicle | 0 (0.0%) | 0 (0.0%) |
| 1 Vehicle | 0 (0.0%) | 0 (0.0%) |
| 2 Vehicles | 14 (82.4%) | 0 (0.0%) |
| 3 Vehicles | 0 (0.0%) | 0 (0.0%) |
| 4 Vehicles | 3 (17.6%) | 3 (100.0%) |
| 5 or more Vehicles | 0 (0.0%) | 0 (0.0%) |
| Total | 17 (100.0%) | 3 (100.0%) |
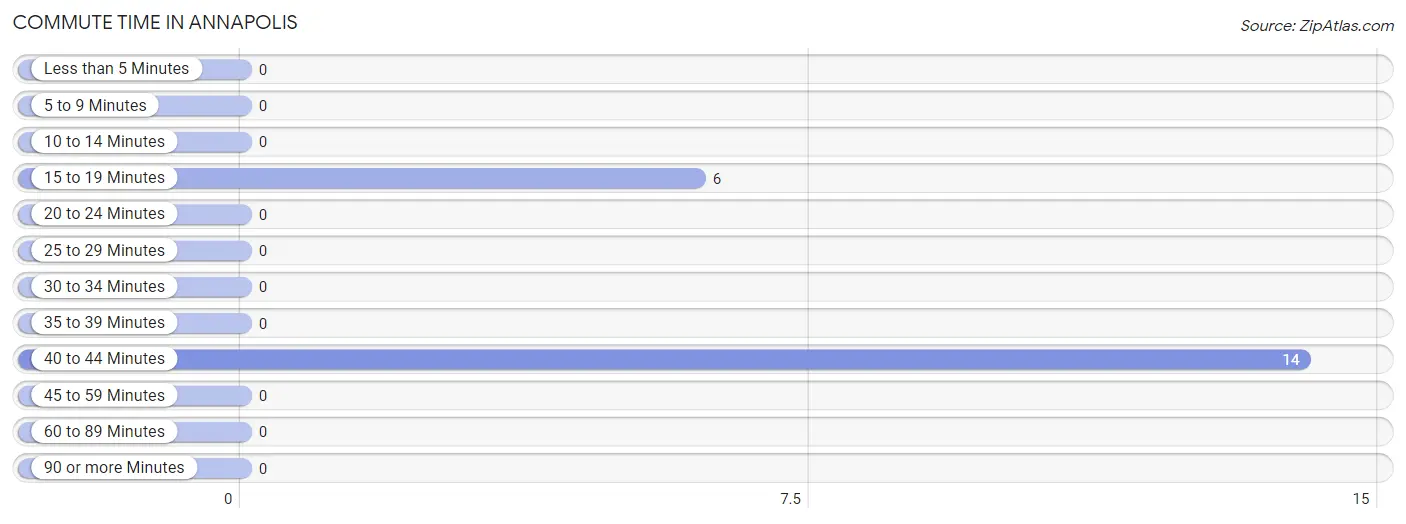
Commute Time in Annapolis
The most frequently occuring commute durations in Annapolis are 40 to 44 minutes (14 commuters, 70.0%), 15 to 19 minutes (6 commuters, 30.0%), and less than 5 minutes (0 commuters, 0.0%).
| Commute Time | # Commuters | % Commuters |
| Less than 5 Minutes | 0 | 0.0% |
| 5 to 9 Minutes | 0 | 0.0% |
| 10 to 14 Minutes | 0 | 0.0% |
| 15 to 19 Minutes | 6 | 30.0% |
| 20 to 24 Minutes | 0 | 0.0% |
| 25 to 29 Minutes | 0 | 0.0% |
| 30 to 34 Minutes | 0 | 0.0% |
| 35 to 39 Minutes | 0 | 0.0% |
| 40 to 44 Minutes | 14 | 70.0% |
| 45 to 59 Minutes | 0 | 0.0% |
| 60 to 89 Minutes | 0 | 0.0% |
| 90 or more Minutes | 0 | 0.0% |
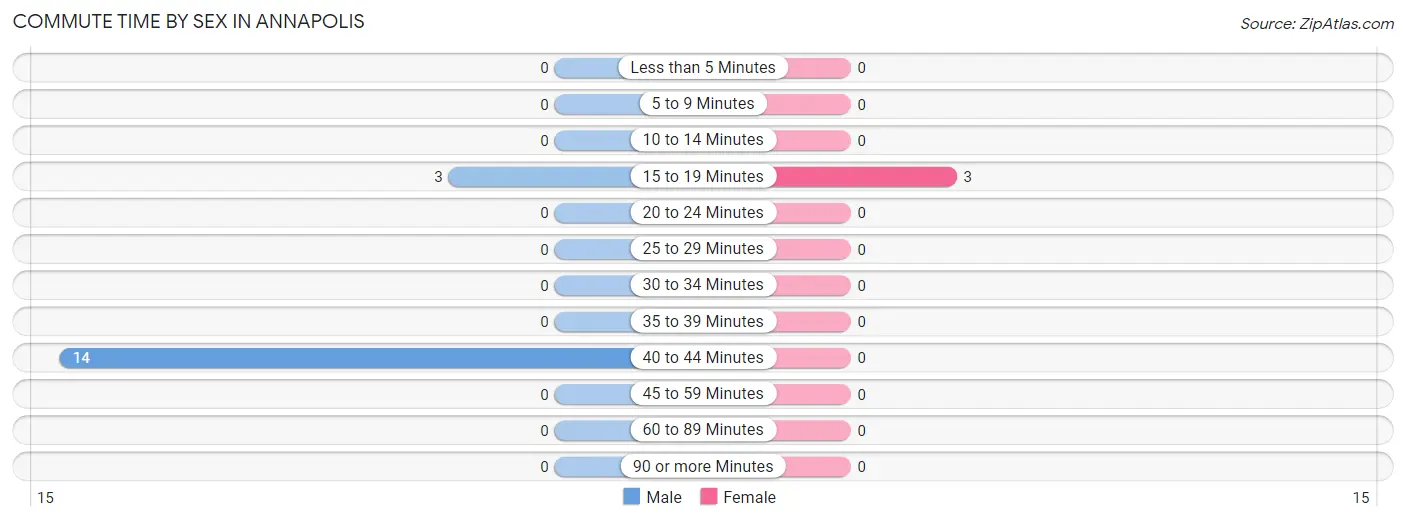
Commute Time by Sex in Annapolis
The most common commute times in Annapolis are 40 to 44 minutes (14 commuters, 82.4%) for males and 15 to 19 minutes (3 commuters, 100.0%) for females.
| Commute Time | Male | Female |
| Less than 5 Minutes | 0 (0.0%) | 0 (0.0%) |
| 5 to 9 Minutes | 0 (0.0%) | 0 (0.0%) |
| 10 to 14 Minutes | 0 (0.0%) | 0 (0.0%) |
| 15 to 19 Minutes | 3 (17.6%) | 3 (100.0%) |
| 20 to 24 Minutes | 0 (0.0%) | 0 (0.0%) |
| 25 to 29 Minutes | 0 (0.0%) | 0 (0.0%) |
| 30 to 34 Minutes | 0 (0.0%) | 0 (0.0%) |
| 35 to 39 Minutes | 0 (0.0%) | 0 (0.0%) |
| 40 to 44 Minutes | 14 (82.4%) | 0 (0.0%) |
| 45 to 59 Minutes | 0 (0.0%) | 0 (0.0%) |
| 60 to 89 Minutes | 0 (0.0%) | 0 (0.0%) |
| 90 or more Minutes | 0 (0.0%) | 0 (0.0%) |
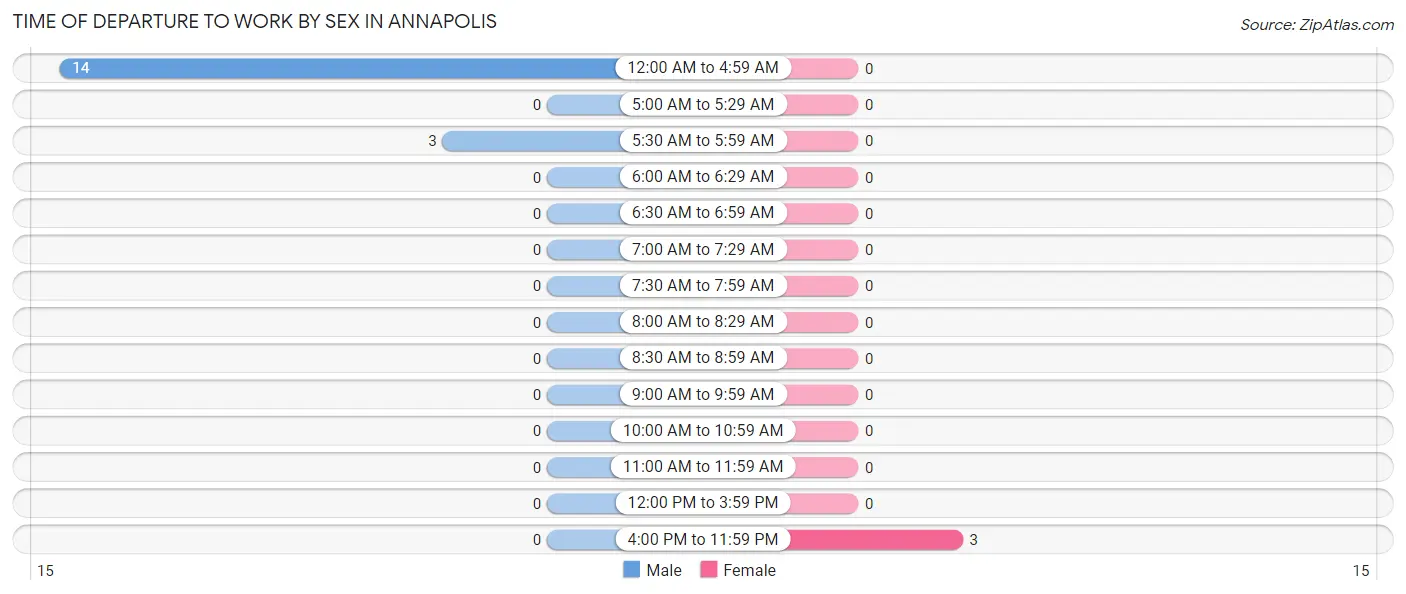
Time of Departure to Work by Sex in Annapolis
The most frequent times of departure to work in Annapolis are 12:00 AM to 4:59 AM (14, 82.4%) for males and 4:00 PM to 11:59 PM (3, 100.0%) for females.
| Time of Departure | Male | Female |
| 12:00 AM to 4:59 AM | 14 (82.4%) | 0 (0.0%) |
| 5:00 AM to 5:29 AM | 0 (0.0%) | 0 (0.0%) |
| 5:30 AM to 5:59 AM | 3 (17.6%) | 0 (0.0%) |
| 6:00 AM to 6:29 AM | 0 (0.0%) | 0 (0.0%) |
| 6:30 AM to 6:59 AM | 0 (0.0%) | 0 (0.0%) |
| 7:00 AM to 7:29 AM | 0 (0.0%) | 0 (0.0%) |
| 7:30 AM to 7:59 AM | 0 (0.0%) | 0 (0.0%) |
| 8:00 AM to 8:29 AM | 0 (0.0%) | 0 (0.0%) |
| 8:30 AM to 8:59 AM | 0 (0.0%) | 0 (0.0%) |
| 9:00 AM to 9:59 AM | 0 (0.0%) | 0 (0.0%) |
| 10:00 AM to 10:59 AM | 0 (0.0%) | 0 (0.0%) |
| 11:00 AM to 11:59 AM | 0 (0.0%) | 0 (0.0%) |
| 12:00 PM to 3:59 PM | 0 (0.0%) | 0 (0.0%) |
| 4:00 PM to 11:59 PM | 0 (0.0%) | 3 (100.0%) |
| Total | 17 (100.0%) | 3 (100.0%) |
Housing Occupancy in Annapolis
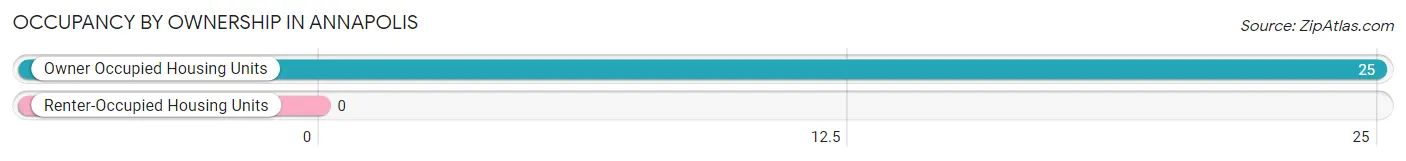
Occupancy by Ownership in Annapolis
Of the total 25 dwellings in Annapolis, owner-occupied units account for 25 (100.0%), while renter-occupied units make up 0 (0.0%).
| Occupancy | # Housing Units | % Housing Units |
| Owner Occupied Housing Units | 25 | 100.0% |
| Renter-Occupied Housing Units | 0 | 0.0% |
| Total Occupied Housing Units | 25 | 100.0% |
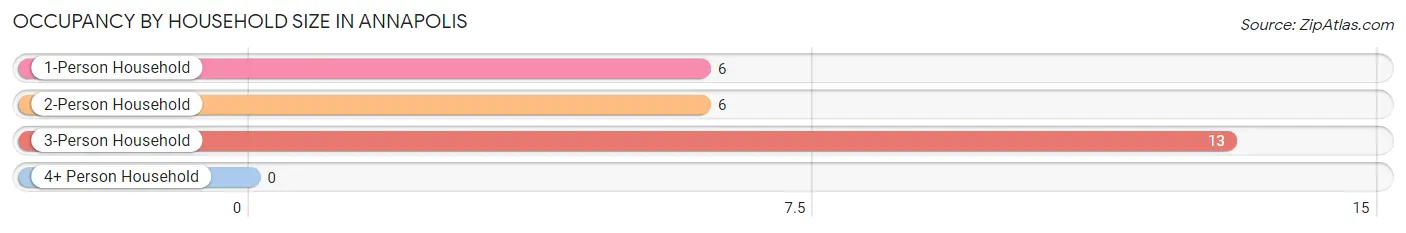
Occupancy by Household Size in Annapolis
| Household Size | # Housing Units | % Housing Units |
| 1-Person Household | 6 | 24.0% |
| 2-Person Household | 6 | 24.0% |
| 3-Person Household | 13 | 52.0% |
| 4+ Person Household | 0 | 0.0% |
| Total Housing Units | 25 | 100.0% |
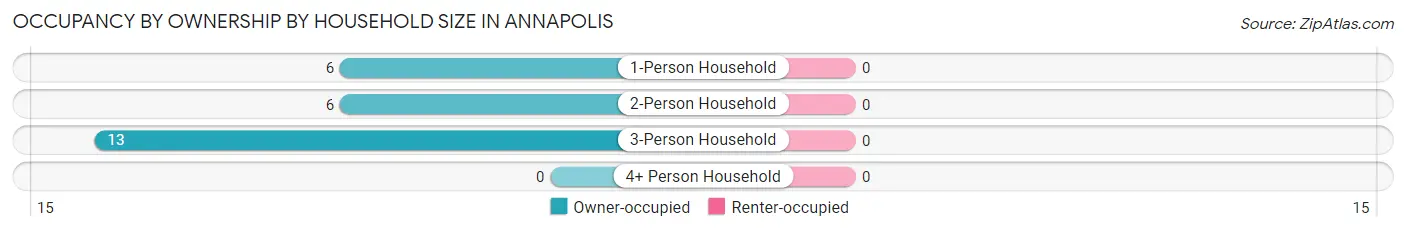
Occupancy by Ownership by Household Size in Annapolis
| Household Size | Owner-occupied | Renter-occupied |
| 1-Person Household | 6 (100.0%) | 0 (0.0%) |
| 2-Person Household | 6 (100.0%) | 0 (0.0%) |
| 3-Person Household | 13 (100.0%) | 0 (0.0%) |
| 4+ Person Household | 0 (0.0%) | 0 (0.0%) |
| Total Housing Units | 25 (100.0%) | 0 (0.0%) |
Occupancy by Educational Attainment in Annapolis
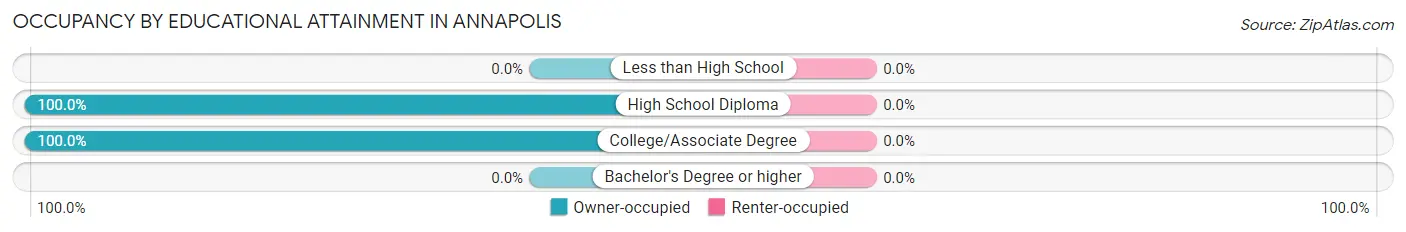
| Household Size | Owner-occupied | Renter-occupied |
| Less than High School | 0 (0.0%) | 0 (0.0%) |
| High School Diploma | 19 (100.0%) | 0 (0.0%) |
| College/Associate Degree | 6 (100.0%) | 0 (0.0%) |
| Bachelor's Degree or higher | 0 (0.0%) | 0 (0.0%) |
Occupancy by Age of Householder in Annapolis
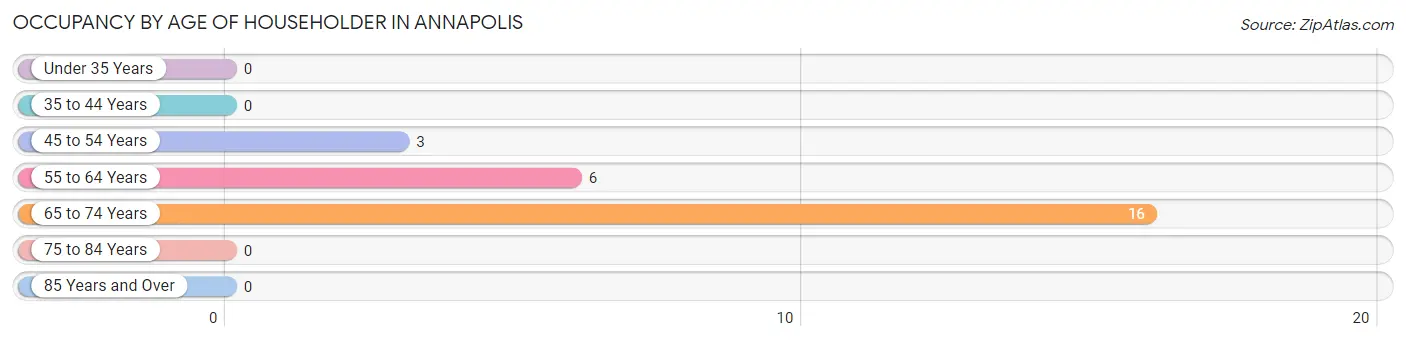
| Age Bracket | # Households | % Households |
| Under 35 Years | 0 | 0.0% |
| 35 to 44 Years | 0 | 0.0% |
| 45 to 54 Years | 3 | 12.0% |
| 55 to 64 Years | 6 | 24.0% |
| 65 to 74 Years | 16 | 64.0% |
| 75 to 84 Years | 0 | 0.0% |
| 85 Years and Over | 0 | 0.0% |
| Total | 25 | 100.0% |
Housing Finances in Annapolis
Median Income by Occupancy in Annapolis
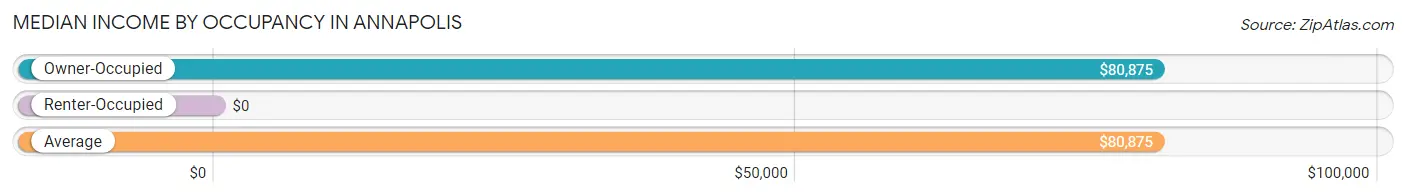
| Occupancy Type | # Households | Median Income |
| Owner-Occupied | 25 (100.0%) | $80,875 |
| Renter-Occupied | 0 (0.0%) | $0 |
| Average | 25 (100.0%) | $80,875 |
Occupancy by Householder Income Bracket in Annapolis
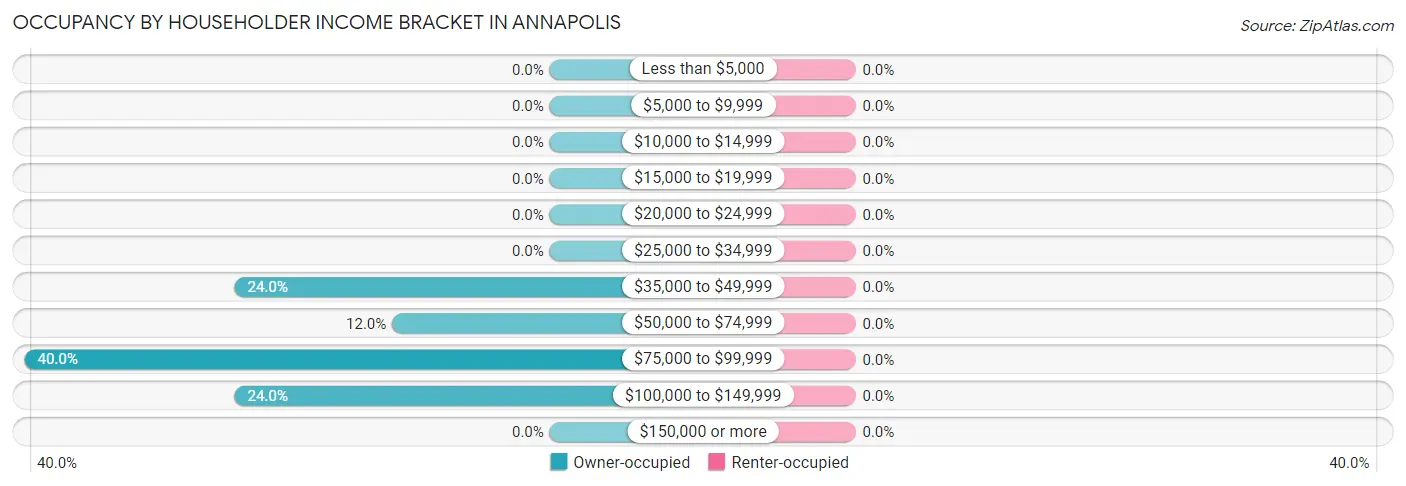
| Income Bracket | Owner-occupied | Renter-occupied |
| Less than $5,000 | 0 (0.0%) | 0 (0.0%) |
| $5,000 to $9,999 | 0 (0.0%) | 0 (0.0%) |
| $10,000 to $14,999 | 0 (0.0%) | 0 (0.0%) |
| $15,000 to $19,999 | 0 (0.0%) | 0 (0.0%) |
| $20,000 to $24,999 | 0 (0.0%) | 0 (0.0%) |
| $25,000 to $34,999 | 0 (0.0%) | 0 (0.0%) |
| $35,000 to $49,999 | 6 (24.0%) | 0 (0.0%) |
| $50,000 to $74,999 | 3 (12.0%) | 0 (0.0%) |
| $75,000 to $99,999 | 10 (40.0%) | 0 (0.0%) |
| $100,000 to $149,999 | 6 (24.0%) | 0 (0.0%) |
| $150,000 or more | 0 (0.0%) | 0 (0.0%) |
| Total | 25 (100.0%) | 0 (0.0%) |
Monthly Housing Cost Tiers in Annapolis
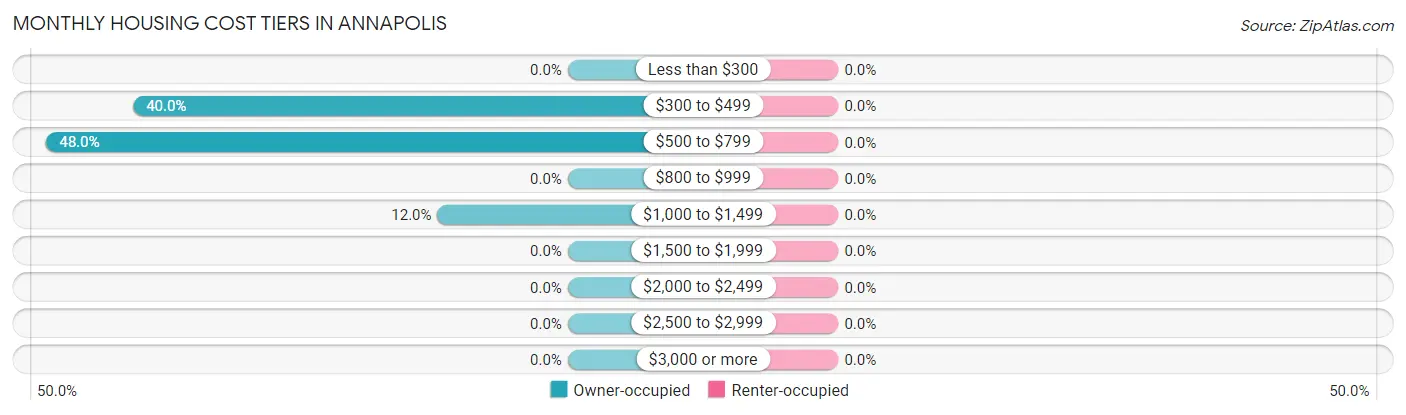
| Monthly Cost | Owner-occupied | Renter-occupied |
| Less than $300 | 0 (0.0%) | 0 (0.0%) |
| $300 to $499 | 10 (40.0%) | 0 (0.0%) |
| $500 to $799 | 12 (48.0%) | 0 (0.0%) |
| $800 to $999 | 0 (0.0%) | 0 (0.0%) |
| $1,000 to $1,499 | 3 (12.0%) | 0 (0.0%) |
| $1,500 to $1,999 | 0 (0.0%) | 0 (0.0%) |
| $2,000 to $2,499 | 0 (0.0%) | 0 (0.0%) |
| $2,500 to $2,999 | 0 (0.0%) | 0 (0.0%) |
| $3,000 or more | 0 (0.0%) | 0 (0.0%) |
| Total | 25 (100.0%) | 0 (0.0%) |
Physical Housing Characteristics in Annapolis
Housing Structures in Annapolis
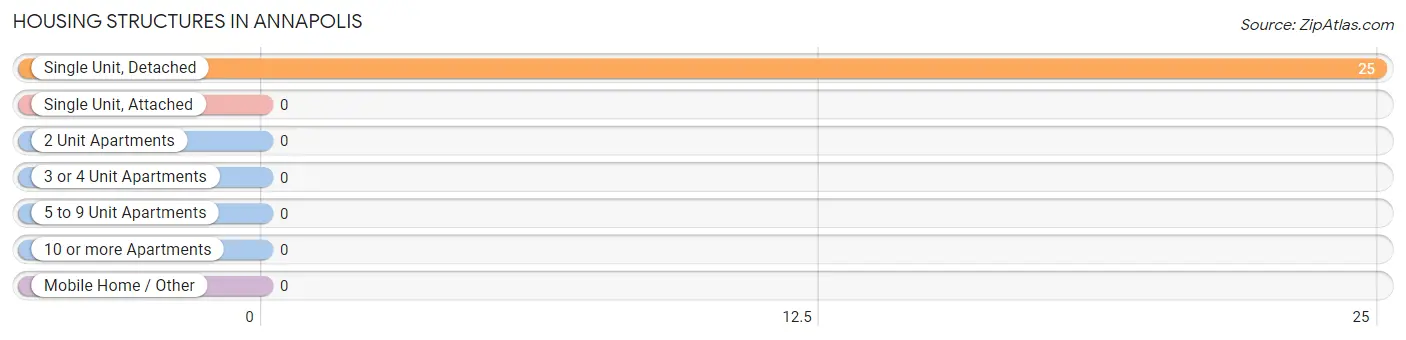
| Structure Type | # Housing Units | % Housing Units |
| Single Unit, Detached | 25 | 100.0% |
| Single Unit, Attached | 0 | 0.0% |
| 2 Unit Apartments | 0 | 0.0% |
| 3 or 4 Unit Apartments | 0 | 0.0% |
| 5 to 9 Unit Apartments | 0 | 0.0% |
| 10 or more Apartments | 0 | 0.0% |
| Mobile Home / Other | 0 | 0.0% |
| Total | 25 | 100.0% |
Housing Structures by Occupancy in Annapolis
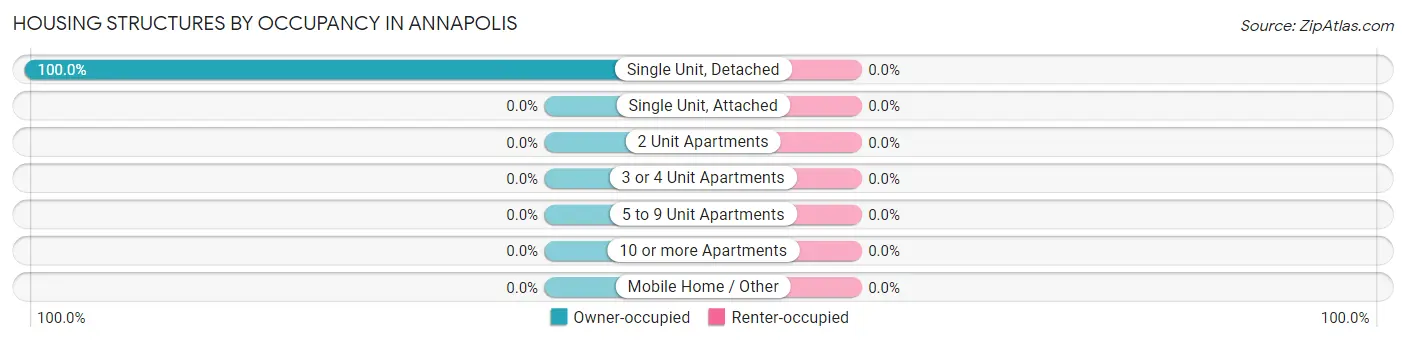
| Structure Type | Owner-occupied | Renter-occupied |
| Single Unit, Detached | 25 (100.0%) | 0 (0.0%) |
| Single Unit, Attached | 0 (0.0%) | 0 (0.0%) |
| 2 Unit Apartments | 0 (0.0%) | 0 (0.0%) |
| 3 or 4 Unit Apartments | 0 (0.0%) | 0 (0.0%) |
| 5 to 9 Unit Apartments | 0 (0.0%) | 0 (0.0%) |
| 10 or more Apartments | 0 (0.0%) | 0 (0.0%) |
| Mobile Home / Other | 0 (0.0%) | 0 (0.0%) |
| Total | 25 (100.0%) | 0 (0.0%) |
Housing Structures by Number of Rooms in Annapolis
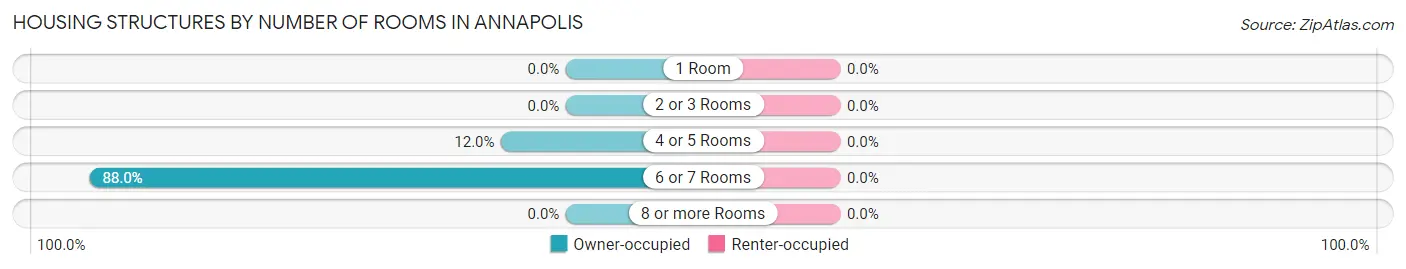
| Number of Rooms | Owner-occupied | Renter-occupied |
| 1 Room | 0 (0.0%) | 0 (0.0%) |
| 2 or 3 Rooms | 0 (0.0%) | 0 (0.0%) |
| 4 or 5 Rooms | 3 (12.0%) | 0 (0.0%) |
| 6 or 7 Rooms | 22 (88.0%) | 0 (0.0%) |
| 8 or more Rooms | 0 (0.0%) | 0 (0.0%) |
| Total | 25 (100.0%) | 0 (0.0%) |
Housing Structure by Heating Type in Annapolis
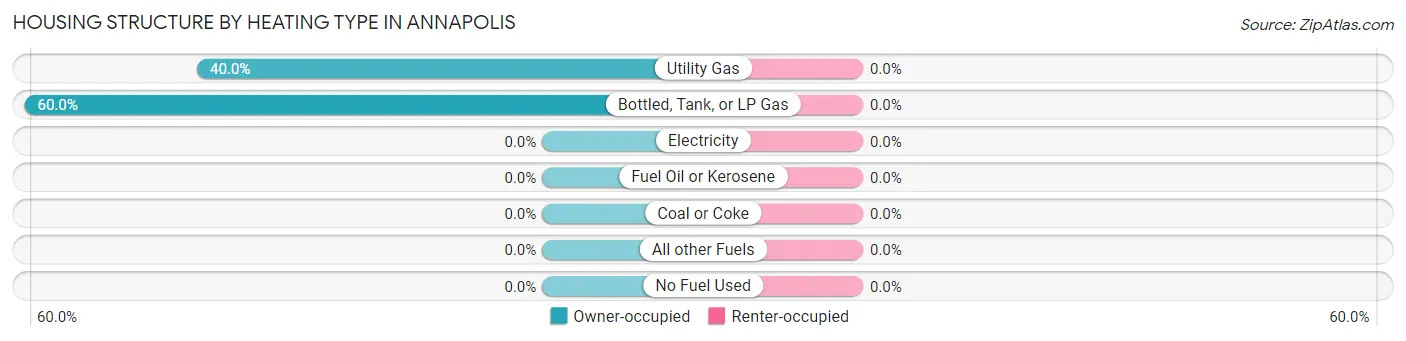
| Heating Type | Owner-occupied | Renter-occupied |
| Utility Gas | 10 (40.0%) | 0 (0.0%) |
| Bottled, Tank, or LP Gas | 15 (60.0%) | 0 (0.0%) |
| Electricity | 0 (0.0%) | 0 (0.0%) |
| Fuel Oil or Kerosene | 0 (0.0%) | 0 (0.0%) |
| Coal or Coke | 0 (0.0%) | 0 (0.0%) |
| All other Fuels | 0 (0.0%) | 0 (0.0%) |
| No Fuel Used | 0 (0.0%) | 0 (0.0%) |
| Total | 25 (100.0%) | 0 (0.0%) |
Household Vehicle Usage in Annapolis
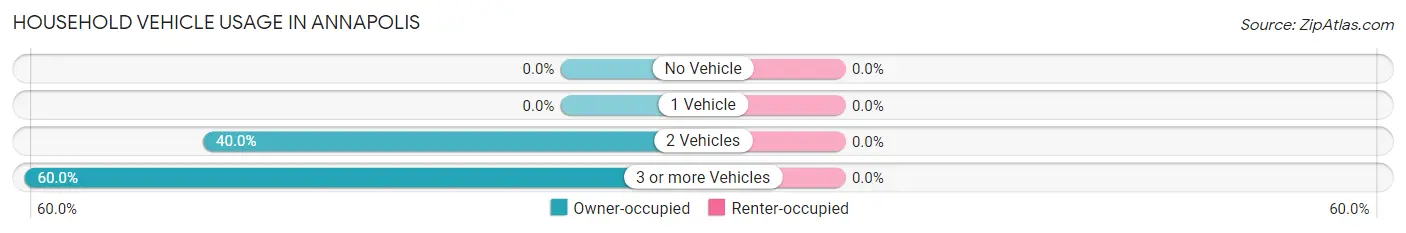
| Vehicles per Household | Owner-occupied | Renter-occupied |
| No Vehicle | 0 (0.0%) | 0 (0.0%) |
| 1 Vehicle | 0 (0.0%) | 0 (0.0%) |
| 2 Vehicles | 10 (40.0%) | 0 (0.0%) |
| 3 or more Vehicles | 15 (60.0%) | 0 (0.0%) |
| Total | 25 (100.0%) | 0 (0.0%) |
Real Estate & Mortgages in Annapolis
Real Estate and Mortgage Overview in Annapolis
| Characteristic | Without Mortgage | With Mortgage |
| Housing Units | 22 | 3 |
| Median Property Value | $187,500 | $0 |
| Median Household Income | $81,250 | $0 |
| Monthly Housing Costs | $508 | $0 |
| Real Estate Taxes | - | - |
Property Value by Mortgage Status in Annapolis
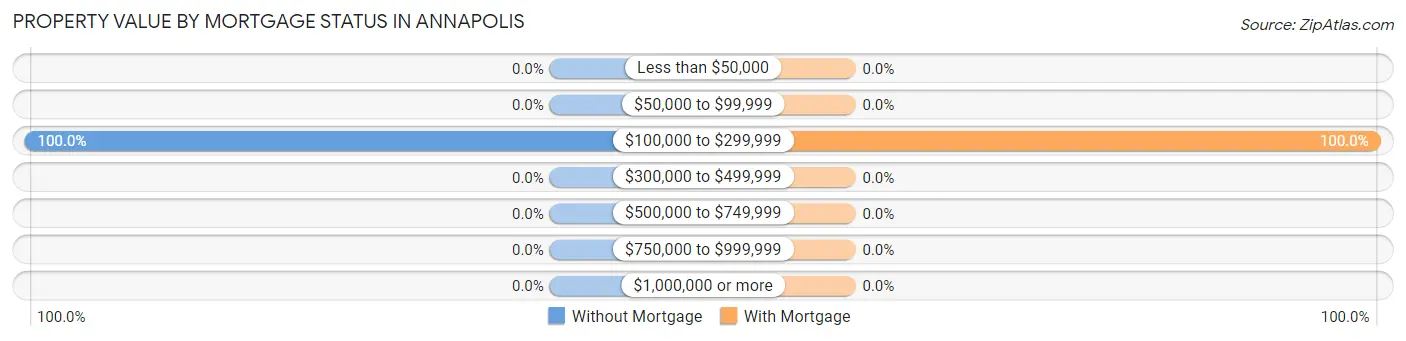
| Property Value | Without Mortgage | With Mortgage |
| Less than $50,000 | 0 (0.0%) | 0 (0.0%) |
| $50,000 to $99,999 | 0 (0.0%) | 0 (0.0%) |
| $100,000 to $299,999 | 22 (100.0%) | 3 (100.0%) |
| $300,000 to $499,999 | 0 (0.0%) | 0 (0.0%) |
| $500,000 to $749,999 | 0 (0.0%) | 0 (0.0%) |
| $750,000 to $999,999 | 0 (0.0%) | 0 (0.0%) |
| $1,000,000 or more | 0 (0.0%) | 0 (0.0%) |
| Total | 22 (100.0%) | 3 (100.0%) |
Household Income by Mortgage Status in Annapolis
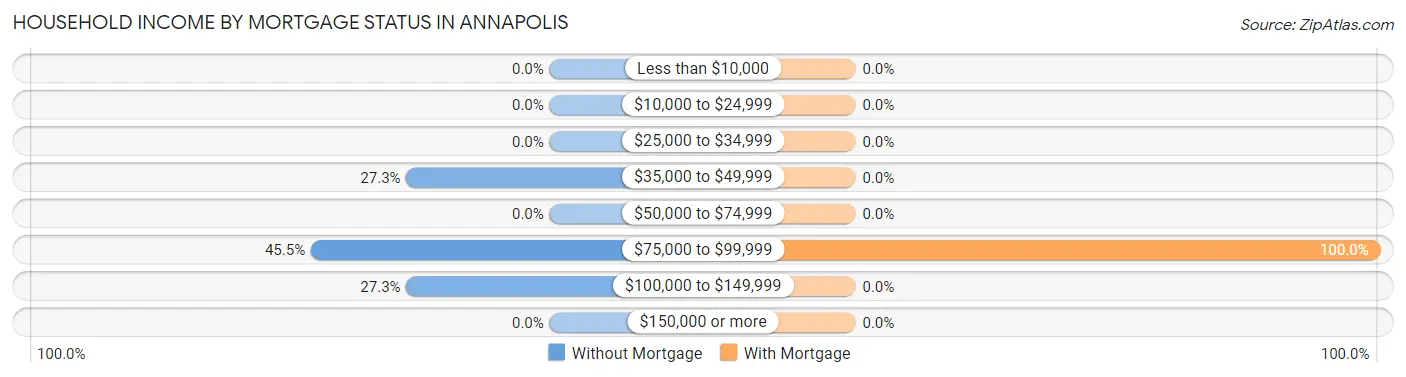
| Household Income | Without Mortgage | With Mortgage |
| Less than $10,000 | 0 (0.0%) | 0 (0.0%) |
| $10,000 to $24,999 | 0 (0.0%) | 0 (0.0%) |
| $25,000 to $34,999 | 0 (0.0%) | 0 (0.0%) |
| $35,000 to $49,999 | 6 (27.3%) | 0 (0.0%) |
| $50,000 to $74,999 | 0 (0.0%) | 0 (0.0%) |
| $75,000 to $99,999 | 10 (45.5%) | 3 (100.0%) |
| $100,000 to $149,999 | 6 (27.3%) | 0 (0.0%) |
| $150,000 or more | 0 (0.0%) | 0 (0.0%) |
| Total | 22 (100.0%) | 3 (100.0%) |
Property Value to Household Income Ratio in Annapolis
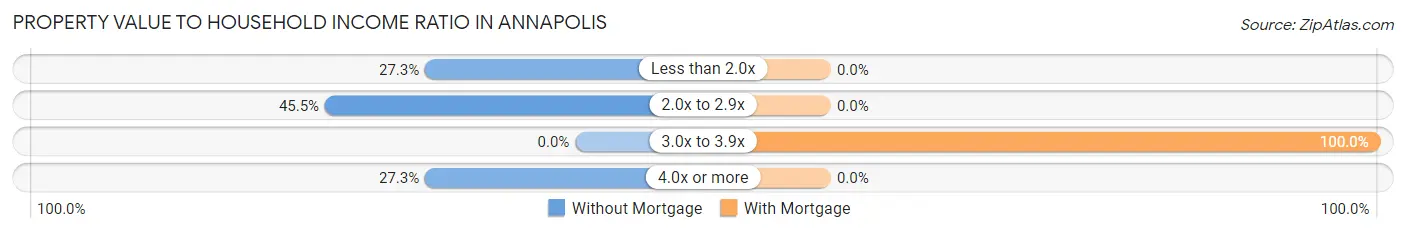
| Value-to-Income Ratio | Without Mortgage | With Mortgage |
| Less than 2.0x | 6 (27.3%) | 0 (0.0%) |
| 2.0x to 2.9x | 10 (45.5%) | 0 (0.0%) |
| 3.0x to 3.9x | 0 (0.0%) | 3 (100.0%) |
| 4.0x or more | 6 (27.3%) | 0 (0.0%) |
| Total | 22 (100.0%) | 3 (100.0%) |
Real Estate Taxes by Mortgage Status in Annapolis
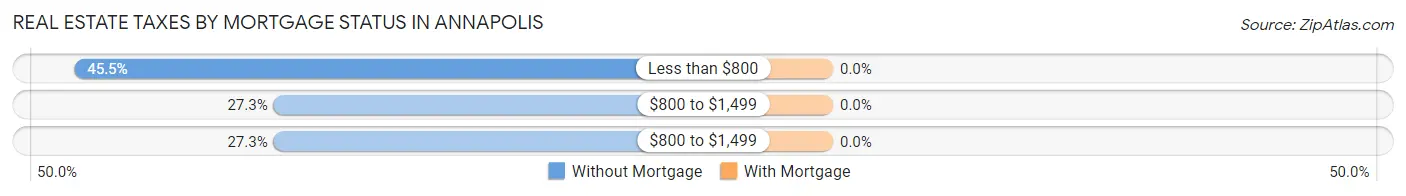
| Property Taxes | Without Mortgage | With Mortgage |
| Less than $800 | 10 (45.5%) | 0 (0.0%) |
| $800 to $1,499 | 6 (27.3%) | 0 (0.0%) |
| $800 to $1,499 | 6 (27.3%) | 0 (0.0%) |
| Total | 22 (100.0%) | 3 (100.0%) |
Health & Disability in Annapolis
Health Insurance Coverage by Age in Annapolis
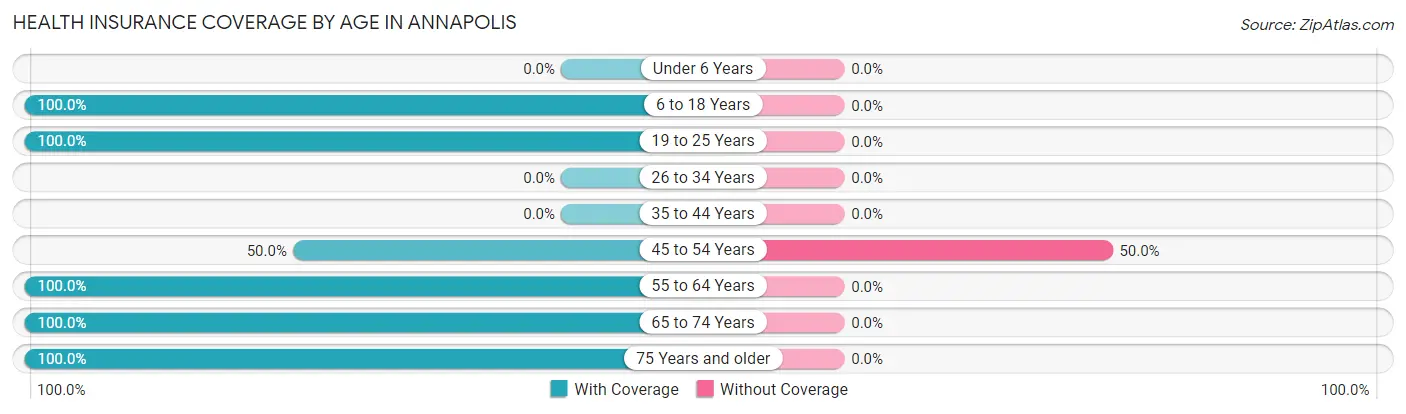
| Age Bracket | With Coverage | Without Coverage |
| Under 6 Years | 0 (0.0%) | 0 (0.0%) |
| 6 to 18 Years | 3 (100.0%) | 0 (0.0%) |
| 19 to 25 Years | 8 (100.0%) | 0 (0.0%) |
| 26 to 34 Years | 0 (0.0%) | 0 (0.0%) |
| 35 to 44 Years | 0 (0.0%) | 0 (0.0%) |
| 45 to 54 Years | 3 (50.0%) | 3 (50.0%) |
| 55 to 64 Years | 6 (100.0%) | 0 (0.0%) |
| 65 to 74 Years | 30 (100.0%) | 0 (0.0%) |
| 75 Years and older | 4 (100.0%) | 0 (0.0%) |
| Total | 54 (94.7%) | 3 (5.3%) |
Health Insurance Coverage by Citizenship Status in Annapolis
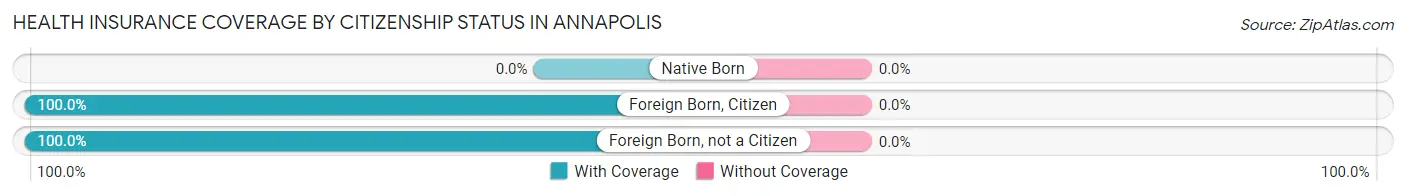
| Citizenship Status | With Coverage | Without Coverage |
| Native Born | 0 (0.0%) | 0 (0.0%) |
| Foreign Born, Citizen | 3 (100.0%) | 0 (0.0%) |
| Foreign Born, not a Citizen | 8 (100.0%) | 0 (0.0%) |
Health Insurance Coverage by Household Income in Annapolis
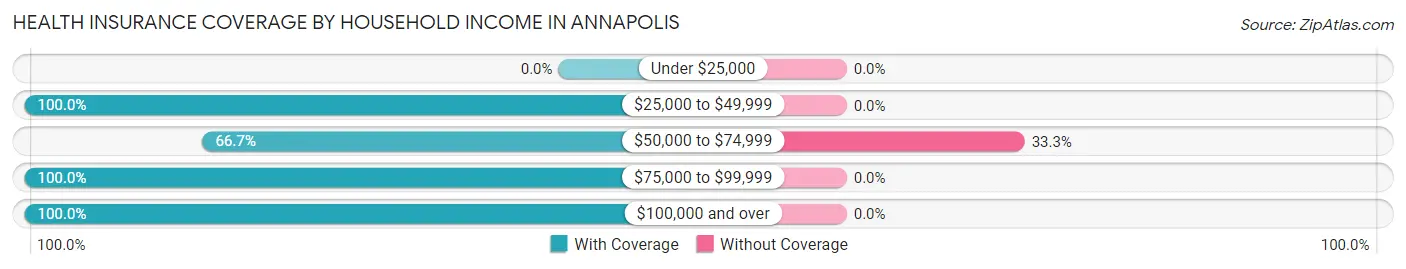
| Household Income | With Coverage | Without Coverage |
| Under $25,000 | 0 (0.0%) | 0 (0.0%) |
| $25,000 to $49,999 | 6 (100.0%) | 0 (0.0%) |
| $50,000 to $74,999 | 6 (66.7%) | 3 (33.3%) |
| $75,000 to $99,999 | 32 (100.0%) | 0 (0.0%) |
| $100,000 and over | 10 (100.0%) | 0 (0.0%) |
Public vs Private Health Insurance Coverage by Age in Annapolis
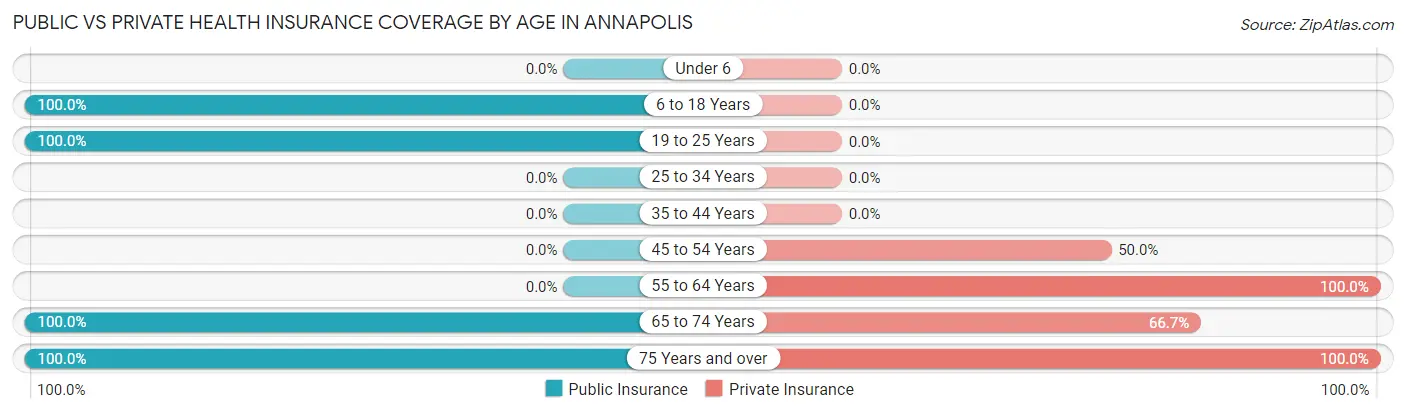
| Age Bracket | Public Insurance | Private Insurance |
| Under 6 | 0 (0.0%) | 0 (0.0%) |
| 6 to 18 Years | 3 (100.0%) | 0 (0.0%) |
| 19 to 25 Years | 8 (100.0%) | 0 (0.0%) |
| 25 to 34 Years | 0 (0.0%) | 0 (0.0%) |
| 35 to 44 Years | 0 (0.0%) | 0 (0.0%) |
| 45 to 54 Years | 0 (0.0%) | 3 (50.0%) |
| 55 to 64 Years | 0 (0.0%) | 6 (100.0%) |
| 65 to 74 Years | 30 (100.0%) | 20 (66.7%) |
| 75 Years and over | 4 (100.0%) | 4 (100.0%) |
| Total | 45 (78.9%) | 33 (57.9%) |
Disability Status by Sex by Age in Annapolis
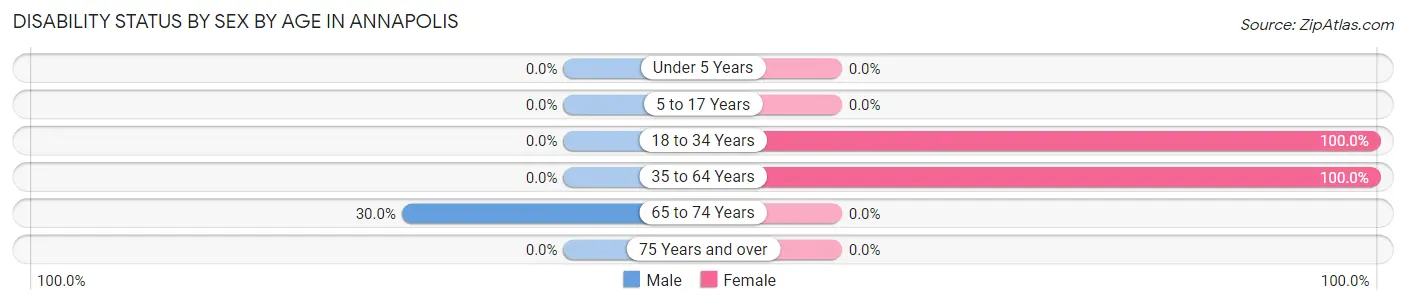
| Age Bracket | Male | Female |
| Under 5 Years | 0 (0.0%) | 0 (0.0%) |
| 5 to 17 Years | 0 (0.0%) | 0 (0.0%) |
| 18 to 34 Years | 0 (0.0%) | 8 (100.0%) |
| 35 to 64 Years | 0 (0.0%) | 9 (100.0%) |
| 65 to 74 Years | 6 (30.0%) | 0 (0.0%) |
| 75 Years and over | 0 (0.0%) | 0 (0.0%) |
Disability Class by Sex by Age in Annapolis
Disability Class: Hearing Difficulty
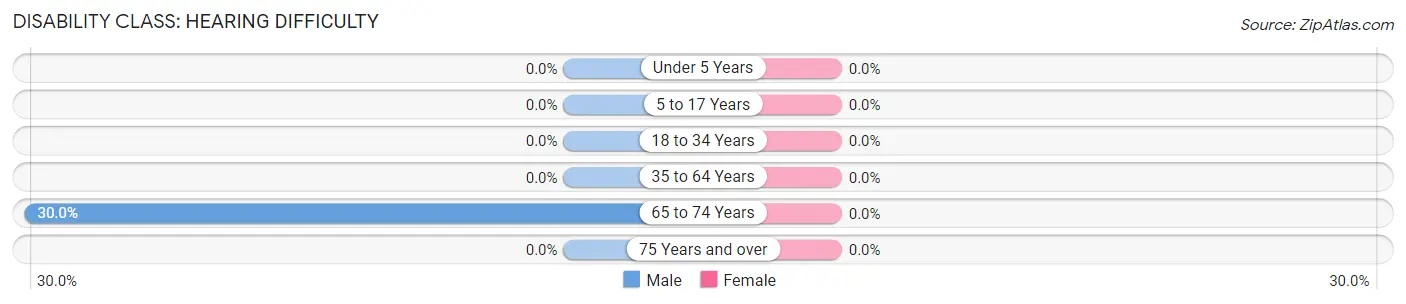
| Age Bracket | Male | Female |
| Under 5 Years | 0 (0.0%) | 0 (0.0%) |
| 5 to 17 Years | 0 (0.0%) | 0 (0.0%) |
| 18 to 34 Years | 0 (0.0%) | 0 (0.0%) |
| 35 to 64 Years | 0 (0.0%) | 0 (0.0%) |
| 65 to 74 Years | 6 (30.0%) | 0 (0.0%) |
| 75 Years and over | 0 (0.0%) | 0 (0.0%) |
Disability Class: Vision Difficulty
| Age Bracket | Male | Female |
| Under 5 Years | 0 (0.0%) | 0 (0.0%) |
| 5 to 17 Years | 0 (0.0%) | 0 (0.0%) |
| 18 to 34 Years | 0 (0.0%) | 0 (0.0%) |
| 35 to 64 Years | 0 (0.0%) | 0 (0.0%) |
| 65 to 74 Years | 0 (0.0%) | 0 (0.0%) |
| 75 Years and over | 0 (0.0%) | 0 (0.0%) |
Disability Class: Cognitive Difficulty
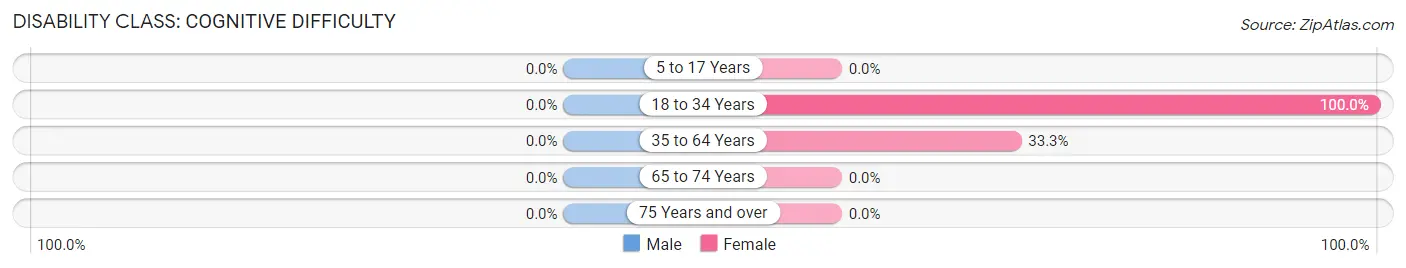
| Age Bracket | Male | Female |
| 5 to 17 Years | 0 (0.0%) | 0 (0.0%) |
| 18 to 34 Years | 0 (0.0%) | 8 (100.0%) |
| 35 to 64 Years | 0 (0.0%) | 3 (33.3%) |
| 65 to 74 Years | 0 (0.0%) | 0 (0.0%) |
| 75 Years and over | 0 (0.0%) | 0 (0.0%) |
Disability Class: Ambulatory Difficulty
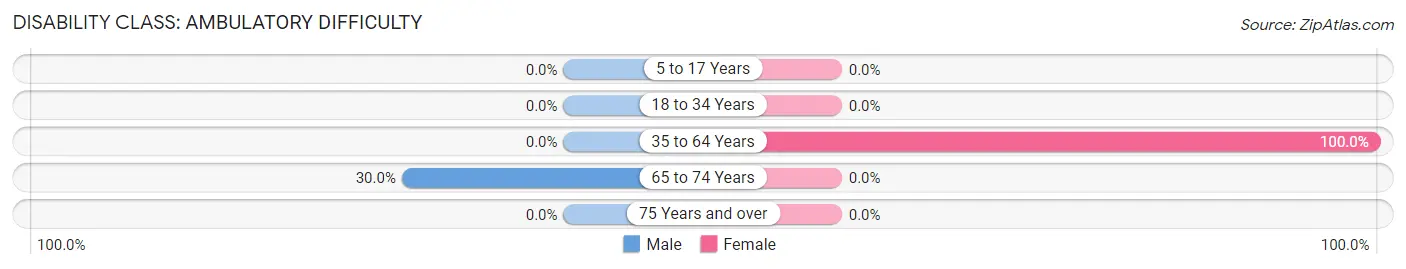
| Age Bracket | Male | Female |
| 5 to 17 Years | 0 (0.0%) | 0 (0.0%) |
| 18 to 34 Years | 0 (0.0%) | 0 (0.0%) |
| 35 to 64 Years | 0 (0.0%) | 9 (100.0%) |
| 65 to 74 Years | 6 (30.0%) | 0 (0.0%) |
| 75 Years and over | 0 (0.0%) | 0 (0.0%) |
Disability Class: Self-Care Difficulty
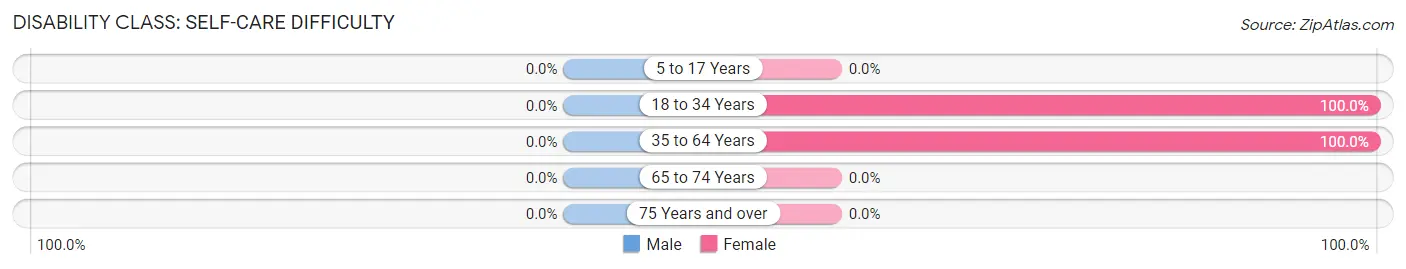
| Age Bracket | Male | Female |
| 5 to 17 Years | 0 (0.0%) | 0 (0.0%) |
| 18 to 34 Years | 0 (0.0%) | 8 (100.0%) |
| 35 to 64 Years | 0 (0.0%) | 9 (100.0%) |
| 65 to 74 Years | 0 (0.0%) | 0 (0.0%) |
| 75 Years and over | 0 (0.0%) | 0 (0.0%) |
Technology Access in Annapolis
Computing Device Access in Annapolis
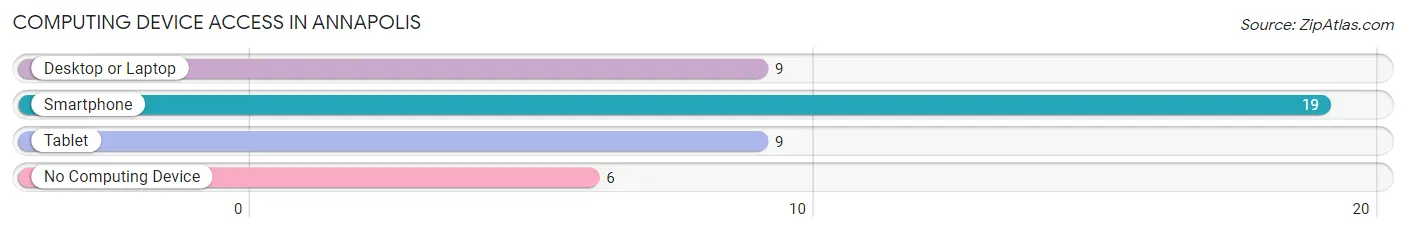
| Device Type | # Households | % Households |
| Desktop or Laptop | 9 | 36.0% |
| Smartphone | 19 | 76.0% |
| Tablet | 9 | 36.0% |
| No Computing Device | 6 | 24.0% |
| Total | 25 | 100.0% |
Internet Access in Annapolis
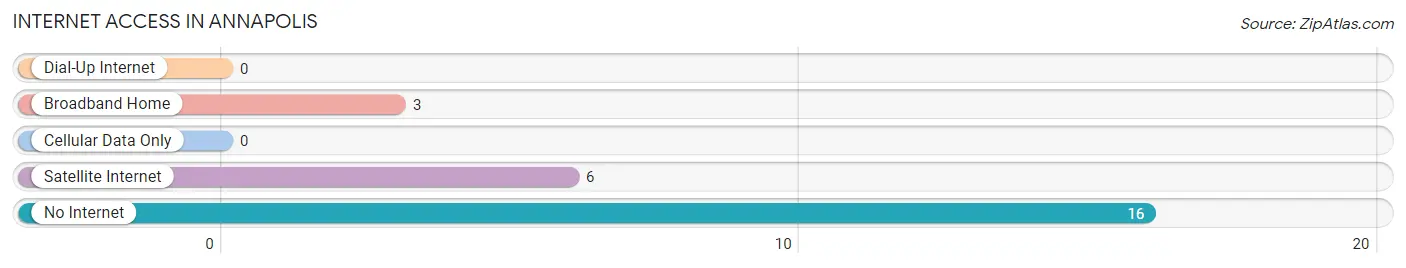
| Internet Type | # Households | % Households |
| Dial-Up Internet | 0 | 0.0% |
| Broadband Home | 3 | 12.0% |
| Cellular Data Only | 0 | 0.0% |
| Satellite Internet | 6 | 24.0% |
| No Internet | 16 | 64.0% |
| Total | 25 | 100.0% |
Annapolis Summary
Annapolis is a small village located in Wabash County, Illinois. It is situated in the southeastern part of the state, about 25 miles from the Indiana border. The village has a population of just over 500 people, and is part of the Mount Carmel Township. Annapolis is a rural community, with a strong agricultural base.
History
The area that is now Annapolis was first settled in the early 1800s by a group of settlers from Virginia. The village was originally known as “Virginia Settlement”, and was later renamed Annapolis in 1837. The name was chosen in honor of the city of Annapolis, Maryland, which was the capital of the United States at the time.
The village was officially incorporated in 1867, and the first mayor was elected in 1868. The village grew slowly over the years, and by the early 1900s had a population of around 500 people.
Geography
Annapolis is located in southeastern Illinois, about 25 miles from the Indiana border. The village is situated in the Wabash Valley, and is surrounded by rolling hills and farmland. The Wabash River runs through the village, and is a popular spot for fishing and boating.
The village is located in the Mount Carmel Township, and is part of the Mount Carmel-Annapolis-Wabash County Consolidated School District. The nearest major city is Mount Carmel, which is about 10 miles away.
Economy
The economy of Annapolis is largely based on agriculture. The village is home to several farms, which produce a variety of crops, including corn, soybeans, and wheat. The village also has a few small businesses, including a grocery store, a hardware store, and a few restaurants.
Demographics
As of the 2010 census, the population of Annapolis was 514 people. The racial makeup of the village was 97.3% White, 0.6% African American, 0.2% Native American, 0.2% Asian, and 1.7% from other races. The median household income was $41,250, and the median family income was $45,000.
Conclusion
Annapolis is a small village located in Wabash County, Illinois. It is a rural community, with a strong agricultural base. The village has a population of just over 500 people, and is part of the Mount Carmel Township. The economy of Annapolis is largely based on agriculture, and the village is home to several farms. The racial makeup of the village is predominantly White, with a small percentage of African American, Native American, and Asian residents.
Common Questions
What is Per Capita Income in Annapolis?
Per Capita income in Annapolis is $36,509.
What is the Median Family Income in Annapolis?
Median Family Income in Annapolis is $81,625.
What is the Median Household income in Annapolis?
Median Household Income in Annapolis is $80,875.
What is Inequality or Gini Index in Annapolis?
Inequality or Gini Index in Annapolis is 0.18.
What is the Total Population of Annapolis?
Total Population of Annapolis is 57.
What is the Total Male Population of Annapolis?
Total Male Population of Annapolis is 23.
What is the Total Female Population of Annapolis?
Total Female Population of Annapolis is 34.
What is the Ratio of Males per 100 Females in Annapolis?
There are 67.65 Males per 100 Females in Annapolis.
What is the Ratio of Females per 100 Males in Annapolis?
There are 147.83 Females per 100 Males in Annapolis.
What is the Median Population Age in Annapolis?
Median Population Age in Annapolis is 70.3 Years.
What is the Average Family Size in Annapolis
Average Family Size in Annapolis is 2.7 People.
What is the Average Household Size in Annapolis
Average Household Size in Annapolis is 2.3 People.
How Large is the Labor Force in Annapolis?
There are 26 People in the Labor Forcein in Annapolis.
What is the Percentage of People in the Labor Force in Annapolis?
45.6% of People are in the Labor Force in Annapolis.
What is the Unemployment Rate in Annapolis?
Unemployment Rate in Annapolis is 23.1%.