Crab Orchard, IL Map & Demographics
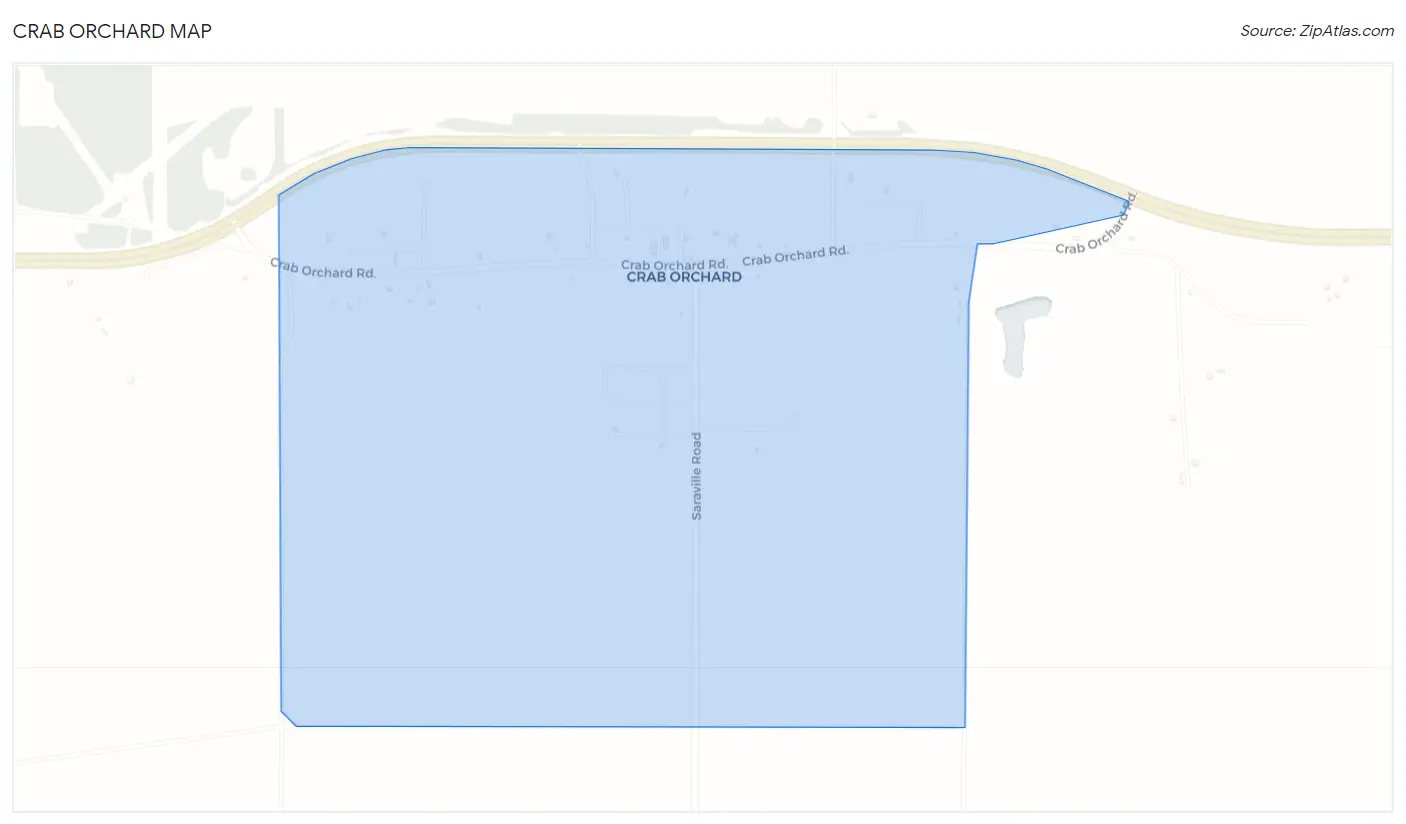
Crab Orchard Map
Crab Orchard Overview
$38,806
PER CAPITA INCOME
$138,750
AVG FAMILY INCOME
$100,625
AVG HOUSEHOLD INCOME
0.35
INEQUALITY / GINI INDEX
259
TOTAL POPULATION
136
MALE POPULATION
123
FEMALE POPULATION
110.57
MALES / 100 FEMALES
90.44
FEMALES / 100 MALES
46.1
MEDIAN AGE
2.9
AVG FAMILY SIZE
2.5
AVG HOUSEHOLD SIZE
159
LABOR FORCE [ PEOPLE ]
67.1%
PERCENT IN LABOR FORCE
Income in Crab Orchard
Income Overview in Crab Orchard
Per Capita Income in Crab Orchard is $38,806, while median incomes of families and households are $138,750 and $100,625 respectively.
| Characteristic | Number | Measure |
| Per Capita Income | 259 | $38,806 |
| Median Family Income | 68 | $138,750 |
| Mean Family Income | 68 | $109,600 |
| Median Household Income | 103 | $100,625 |
| Mean Household Income | 103 | $97,793 |
| Income Deficit | 68 | $0 |
| Wage / Income Gap (%) | 259 | 0.00% |
| Wage / Income Gap ($) | 259 | 100.00¢ per $1 |
| Gini / Inequality Index | 259 | 0.35 |
Earnings by Sex in Crab Orchard
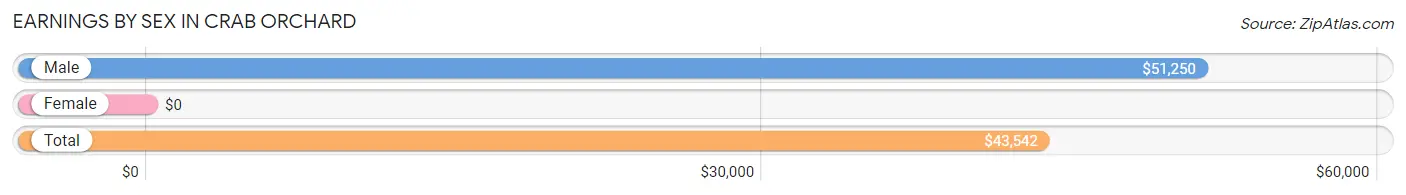
| Sex | Number | Average Earnings |
| Male | 79 (47.9%) | $51,250 |
| Female | 86 (52.1%) | $0 |
| Total | 165 (100.0%) | $43,542 |
Earnings by Sex by Income Bracket in Crab Orchard
The most common earnings brackets in Crab Orchard are $100,000+ for men (18 | 22.8%) and $12,500 to $14,999 for women (25 | 29.1%).
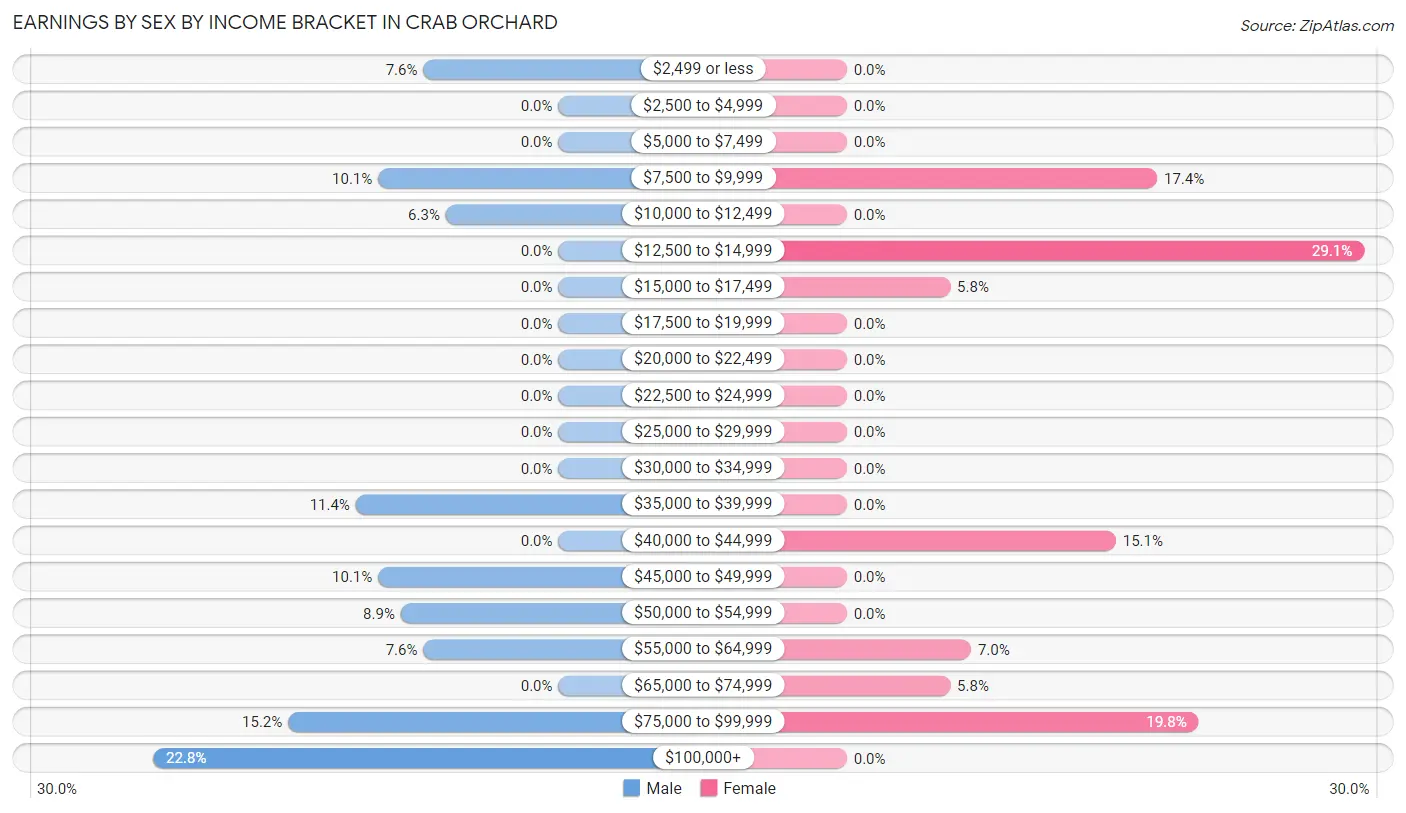
| Income | Male | Female |
| $2,499 or less | 6 (7.6%) | 0 (0.0%) |
| $2,500 to $4,999 | 0 (0.0%) | 0 (0.0%) |
| $5,000 to $7,499 | 0 (0.0%) | 0 (0.0%) |
| $7,500 to $9,999 | 8 (10.1%) | 15 (17.4%) |
| $10,000 to $12,499 | 5 (6.3%) | 0 (0.0%) |
| $12,500 to $14,999 | 0 (0.0%) | 25 (29.1%) |
| $15,000 to $17,499 | 0 (0.0%) | 5 (5.8%) |
| $17,500 to $19,999 | 0 (0.0%) | 0 (0.0%) |
| $20,000 to $22,499 | 0 (0.0%) | 0 (0.0%) |
| $22,500 to $24,999 | 0 (0.0%) | 0 (0.0%) |
| $25,000 to $29,999 | 0 (0.0%) | 0 (0.0%) |
| $30,000 to $34,999 | 0 (0.0%) | 0 (0.0%) |
| $35,000 to $39,999 | 9 (11.4%) | 0 (0.0%) |
| $40,000 to $44,999 | 0 (0.0%) | 13 (15.1%) |
| $45,000 to $49,999 | 8 (10.1%) | 0 (0.0%) |
| $50,000 to $54,999 | 7 (8.9%) | 0 (0.0%) |
| $55,000 to $64,999 | 6 (7.6%) | 6 (7.0%) |
| $65,000 to $74,999 | 0 (0.0%) | 5 (5.8%) |
| $75,000 to $99,999 | 12 (15.2%) | 17 (19.8%) |
| $100,000+ | 18 (22.8%) | 0 (0.0%) |
| Total | 79 (100.0%) | 86 (100.0%) |
Earnings by Sex by Educational Attainment in Crab Orchard
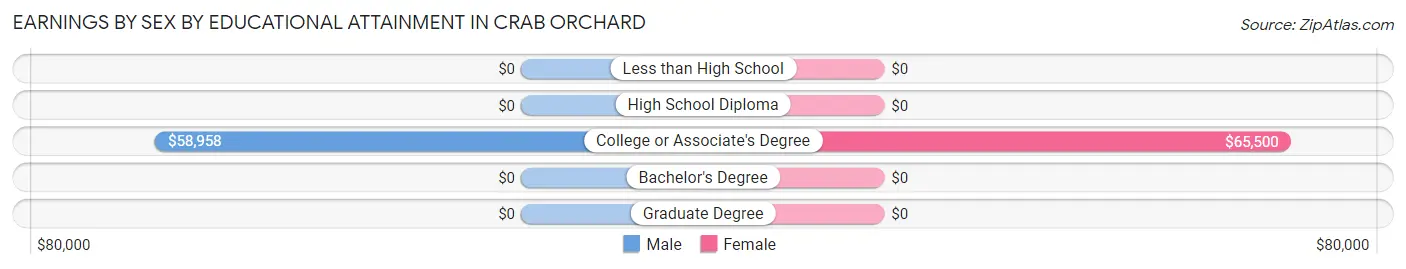
| Educational Attainment | Male Income | Female Income |
| Less than High School | - | - |
| High School Diploma | - | - |
| College or Associate's Degree | $58,958 | $65,500 |
| Bachelor's Degree | - | - |
| Graduate Degree | - | - |
| Total | $58,750 | $0 |
Family Income in Crab Orchard
Family Income Brackets in Crab Orchard
According to the Crab Orchard family income data, there are 31 families falling into the $150,000 to $199,999 income range, which is the most common income bracket and makes up 45.6% of all families.
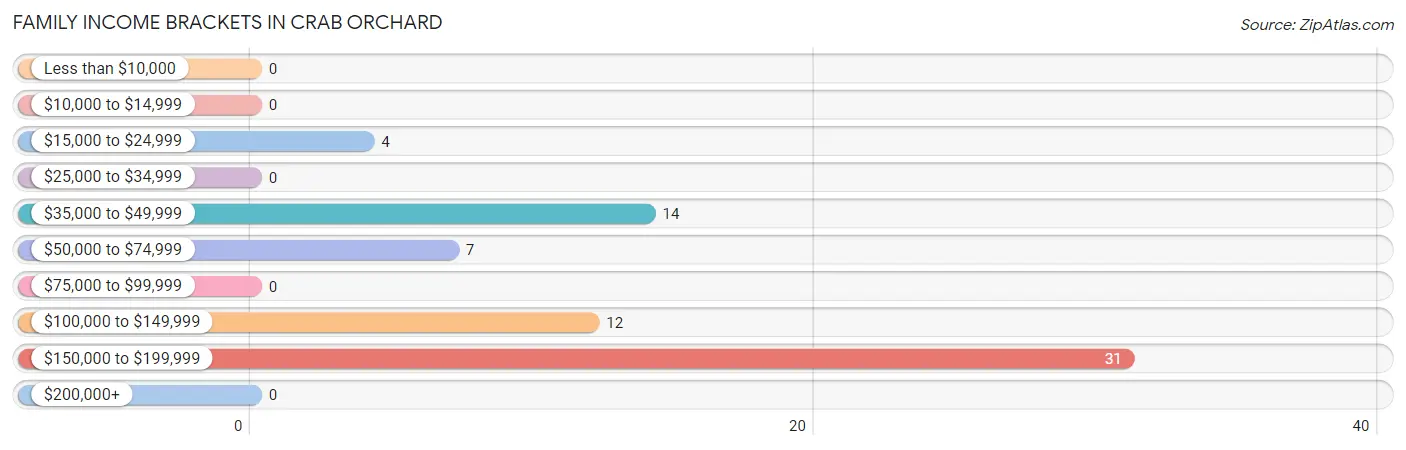
| Income Bracket | # Families | % Families |
| Less than $10,000 | 0 | 0.0% |
| $10,000 to $14,999 | 0 | 0.0% |
| $15,000 to $24,999 | 4 | 5.9% |
| $25,000 to $34,999 | 0 | 0.0% |
| $35,000 to $49,999 | 14 | 20.6% |
| $50,000 to $74,999 | 7 | 10.3% |
| $75,000 to $99,999 | 0 | 0.0% |
| $100,000 to $149,999 | 12 | 17.6% |
| $150,000 to $199,999 | 31 | 45.6% |
| $200,000+ | 0 | 0.0% |
Family Income by Famaliy Size in Crab Orchard
2-person families (41 | 60.3%) account for the highest median family income in Crab Orchard with $153,625 per family, while 2-person families (41 | 60.3%) have the highest median income of $76,812 per family member.
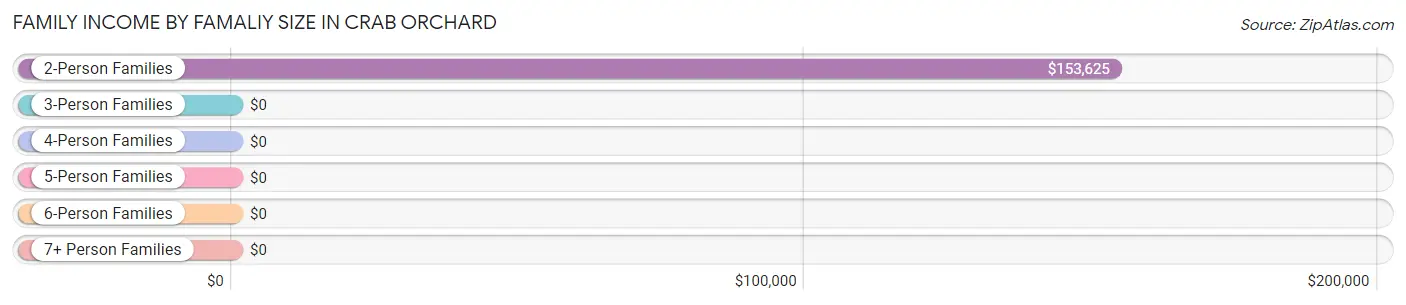
| Income Bracket | # Families | Median Income |
| 2-Person Families | 41 (60.3%) | $153,625 |
| 3-Person Families | 15 (22.1%) | $0 |
| 4-Person Families | 6 (8.8%) | $0 |
| 5-Person Families | 0 (0.0%) | $0 |
| 6-Person Families | 6 (8.8%) | $0 |
| 7+ Person Families | 0 (0.0%) | $0 |
| Total | 68 (100.0%) | $138,750 |
Family Income by Number of Earners in Crab Orchard
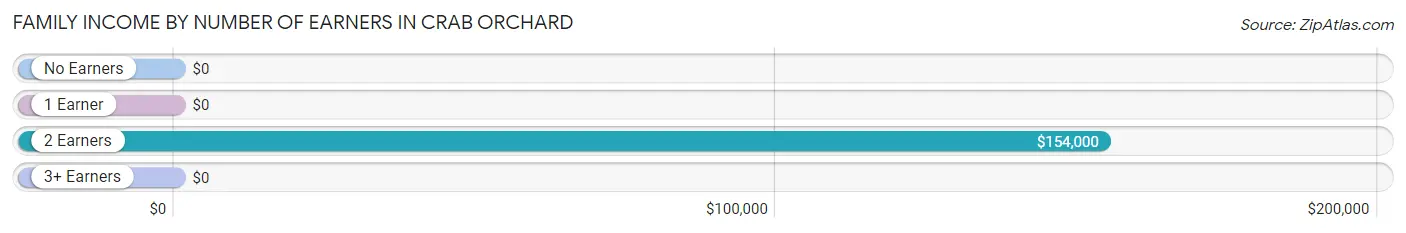
| Number of Earners | # Families | Median Income |
| No Earners | 9 (13.2%) | $0 |
| 1 Earner | 9 (13.2%) | $0 |
| 2 Earners | 38 (55.9%) | $154,000 |
| 3+ Earners | 12 (17.6%) | $0 |
| Total | 68 (100.0%) | $138,750 |
Household Income in Crab Orchard
Household Income Brackets in Crab Orchard
With 31 households falling in the category, the $150,000 to $199,999 income range is the most frequent in Crab Orchard, accounting for 30.1% of all households.
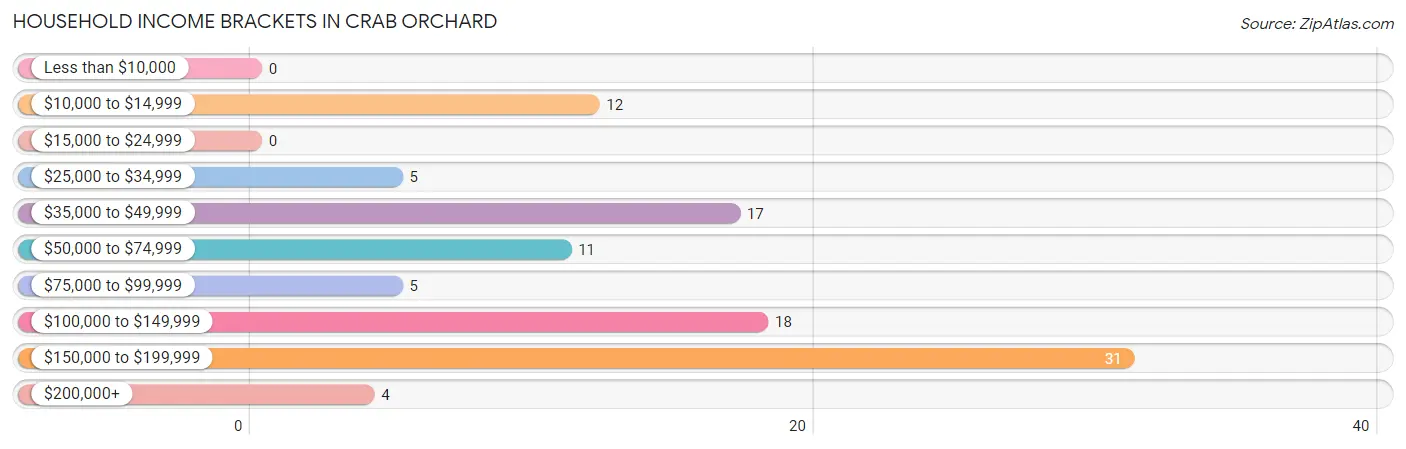
| Income Bracket | # Households | % Households |
| Less than $10,000 | 0 | 0.0% |
| $10,000 to $14,999 | 12 | 11.7% |
| $15,000 to $24,999 | 0 | 0.0% |
| $25,000 to $34,999 | 5 | 4.9% |
| $35,000 to $49,999 | 17 | 16.5% |
| $50,000 to $74,999 | 11 | 10.7% |
| $75,000 to $99,999 | 5 | 4.9% |
| $100,000 to $149,999 | 18 | 17.5% |
| $150,000 to $199,999 | 31 | 30.1% |
| $200,000+ | 4 | 3.9% |
Household Income by Householder Age in Crab Orchard
The median household income in Crab Orchard is $100,625, with the highest median household income of $153,875 found in the 45 to 64 years age bracket for the primary householder. A total of 47 households (45.6%) fall into this category. Meanwhile, the 15 to 24 years age bracket for the primary householder has the lowest median household income of $0, with 5 households (4.9%) in this group.
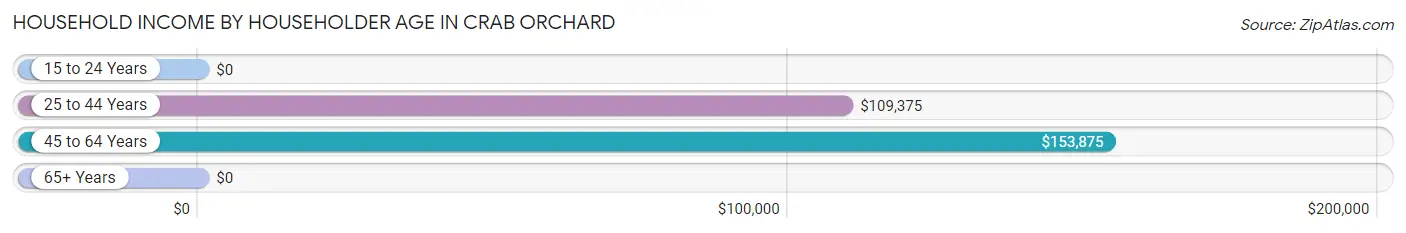
| Income Bracket | # Households | Median Income |
| 15 to 24 Years | 5 (4.9%) | $0 |
| 25 to 44 Years | 27 (26.2%) | $109,375 |
| 45 to 64 Years | 47 (45.6%) | $153,875 |
| 65+ Years | 24 (23.3%) | $0 |
| Total | 103 (100.0%) | $100,625 |
Poverty in Crab Orchard
Income Below Poverty by Sex and Age in Crab Orchard
With 17.6% poverty level for males and 9.8% for females among the residents of Crab Orchard, 18 to 24 year old males and 75 year old and over females are the most vulnerable to poverty, with 5 males (45.5%) and 12 females (100.0%) in their respective age groups living below the poverty level.
| Age Bracket | Male | Female |
| Under 5 Years | 0 (0.0%) | 0 (0.0%) |
| 5 Years | 0 (0.0%) | 0 (0.0%) |
| 6 to 11 Years | 0 (0.0%) | 0 (0.0%) |
| 12 to 14 Years | 4 (44.4%) | 0 (0.0%) |
| 15 Years | 0 (0.0%) | 0 (0.0%) |
| 16 and 17 Years | 0 (0.0%) | 0 (0.0%) |
| 18 to 24 Years | 5 (45.5%) | 0 (0.0%) |
| 25 to 34 Years | 0 (0.0%) | 0 (0.0%) |
| 35 to 44 Years | 0 (0.0%) | 0 (0.0%) |
| 45 to 54 Years | 11 (28.9%) | 0 (0.0%) |
| 55 to 64 Years | 0 (0.0%) | 0 (0.0%) |
| 65 to 74 Years | 0 (0.0%) | 0 (0.0%) |
| 75 Years and over | 4 (44.4%) | 12 (100.0%) |
| Total | 24 (17.6%) | 12 (9.8%) |
Income Above Poverty by Sex and Age in Crab Orchard
According to the poverty statistics in Crab Orchard, males aged 6 to 11 years and females aged 6 to 11 years are the age groups that are most secure financially, with 100.0% of males and 100.0% of females in these age groups living above the poverty line.
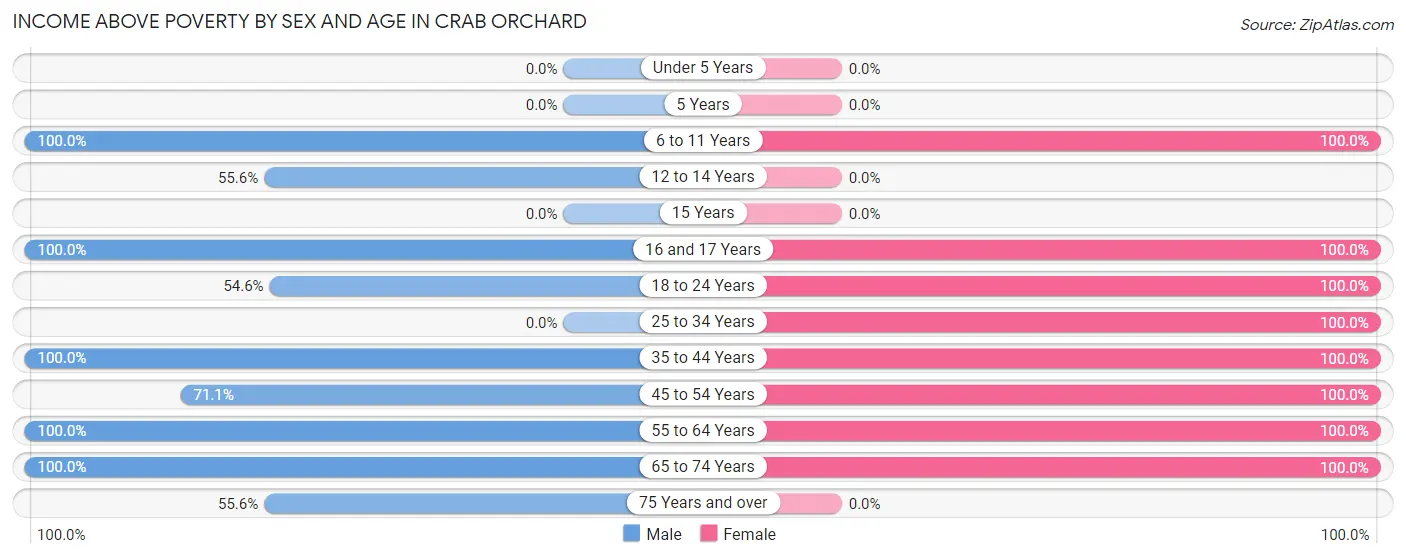
| Age Bracket | Male | Female |
| Under 5 Years | 0 (0.0%) | 0 (0.0%) |
| 5 Years | 0 (0.0%) | 0 (0.0%) |
| 6 to 11 Years | 6 (100.0%) | 7 (100.0%) |
| 12 to 14 Years | 5 (55.6%) | 0 (0.0%) |
| 15 Years | 0 (0.0%) | 0 (0.0%) |
| 16 and 17 Years | 8 (100.0%) | 8 (100.0%) |
| 18 to 24 Years | 6 (54.5%) | 15 (100.0%) |
| 25 to 34 Years | 0 (0.0%) | 11 (100.0%) |
| 35 to 44 Years | 21 (100.0%) | 19 (100.0%) |
| 45 to 54 Years | 27 (71.1%) | 32 (100.0%) |
| 55 to 64 Years | 24 (100.0%) | 12 (100.0%) |
| 65 to 74 Years | 10 (100.0%) | 7 (100.0%) |
| 75 Years and over | 5 (55.6%) | 0 (0.0%) |
| Total | 112 (82.4%) | 111 (90.2%) |
Income Below Poverty Among Married-Couple Families in Crab Orchard
| Children | Above Poverty | Below Poverty |
| No Children | 46 (100.0%) | 0 (0.0%) |
| 1 or 2 Children | 12 (100.0%) | 0 (0.0%) |
| 3 or 4 Children | 6 (100.0%) | 0 (0.0%) |
| 5 or more Children | 0 (0.0%) | 0 (0.0%) |
| Total | 64 (100.0%) | 0 (0.0%) |
Income Below Poverty Among Single-Parent Households in Crab Orchard
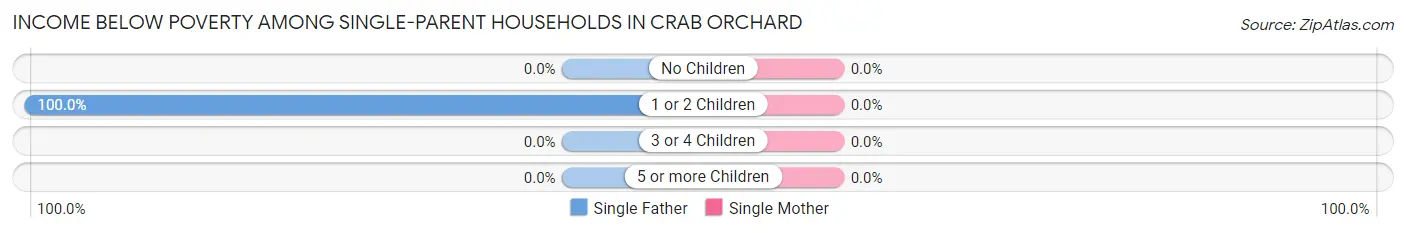
| Children | Single Father | Single Mother |
| No Children | 0 (0.0%) | 0 (0.0%) |
| 1 or 2 Children | 4 (100.0%) | 0 (0.0%) |
| 3 or 4 Children | 0 (0.0%) | 0 (0.0%) |
| 5 or more Children | 0 (0.0%) | 0 (0.0%) |
| Total | 4 (100.0%) | 0 (0.0%) |
Income Below Poverty Among Married-Couple vs Single-Parent Households in Crab Orchard
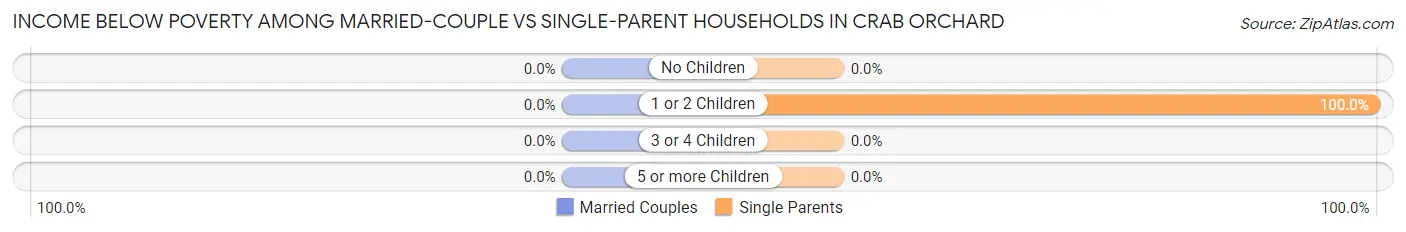
| Children | Married-Couple Families | Single-Parent Households |
| No Children | 0 (0.0%) | 0 (0.0%) |
| 1 or 2 Children | 0 (0.0%) | 4 (100.0%) |
| 3 or 4 Children | 0 (0.0%) | 0 (0.0%) |
| 5 or more Children | 0 (0.0%) | 0 (0.0%) |
| Total | 0 (0.0%) | 4 (100.0%) |
Race in Crab Orchard
The most populous races in Crab Orchard are White / Caucasian (256 | 98.8%), and Native / Alaskan (3 | 1.2%).
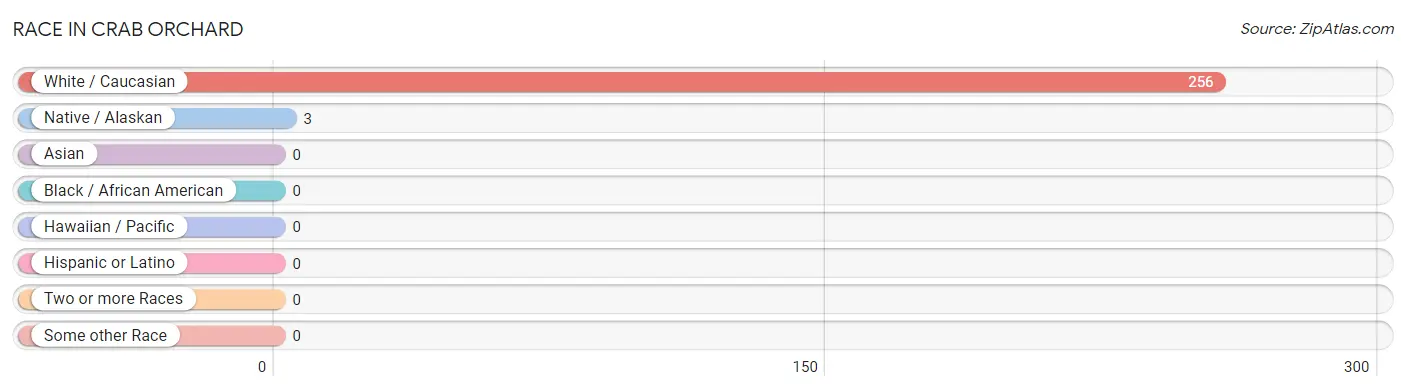
| Race | # Population | % Population |
| Asian | 0 | 0.0% |
| Black / African American | 0 | 0.0% |
| Hawaiian / Pacific | 0 | 0.0% |
| Hispanic or Latino | 0 | 0.0% |
| Native / Alaskan | 3 | 1.2% |
| White / Caucasian | 256 | 98.8% |
| Two or more Races | 0 | 0.0% |
| Some other Race | 0 | 0.0% |
| Total | 259 | 100.0% |
Ancestry in Crab Orchard
The most populous ancestries reported in Crab Orchard are German (42 | 16.2%), Italian (16 | 6.2%), American (15 | 5.8%), English (10 | 3.9%), and Irish (10 | 3.9%), together accounting for 35.9% of all Crab Orchard residents.
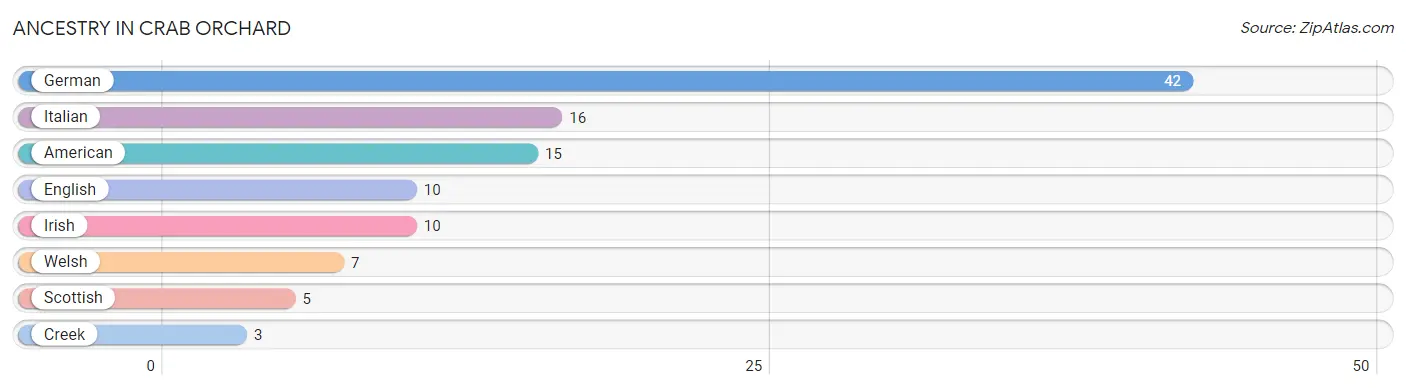
| Ancestry | # Population | % Population |
| American | 15 | 5.8% |
| Creek | 3 | 1.2% |
| English | 10 | 3.9% |
| German | 42 | 16.2% |
| Irish | 10 | 3.9% |
| Italian | 16 | 6.2% |
| Scottish | 5 | 1.9% |
| Welsh | 7 | 2.7% | View All 8 Rows |
Immigrants in Crab Orchard

| Immigration Origin | # Population | % Population | View All 0 Rows |
Sex and Age in Crab Orchard
Sex and Age in Crab Orchard
The most populous age groups in Crab Orchard are 45 to 49 Years (32 | 23.5%) for men and 50 to 54 Years (22 | 17.9%) for women.
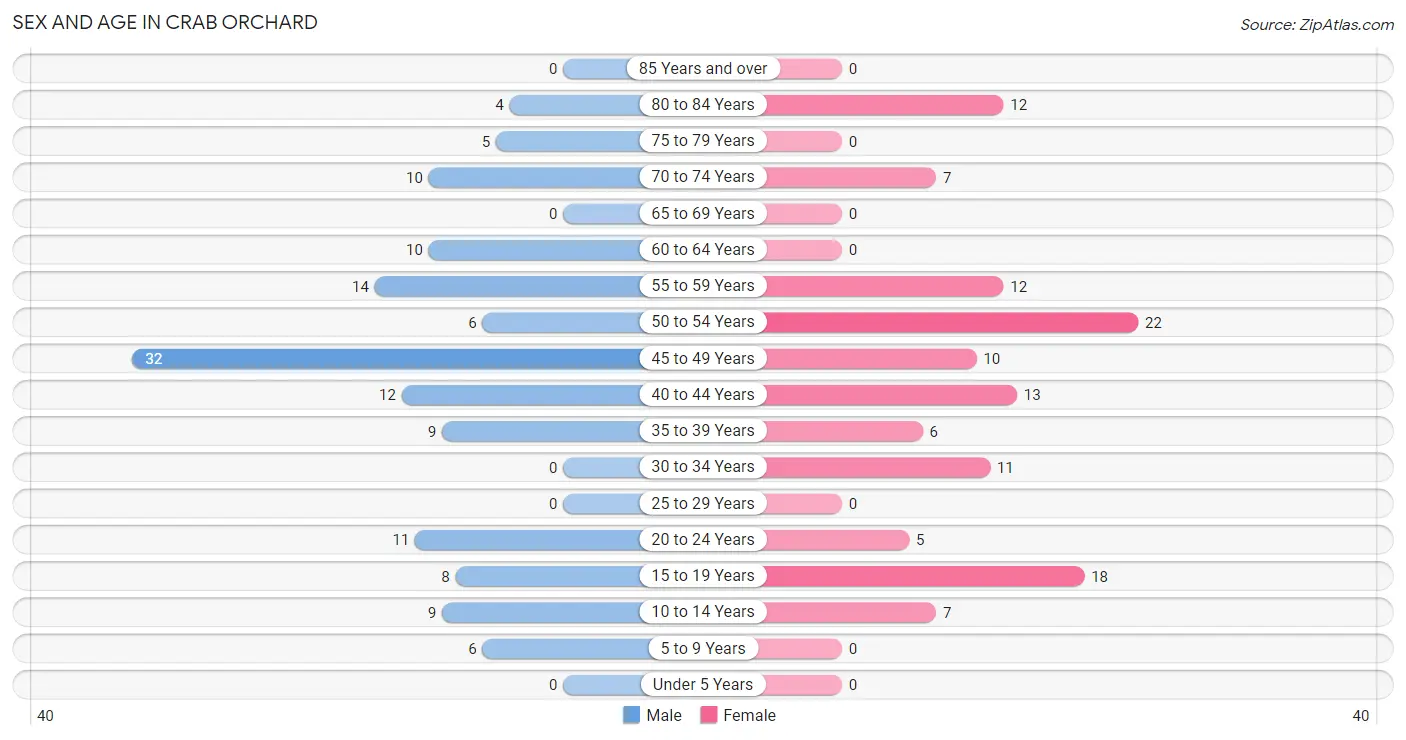
| Age Bracket | Male | Female |
| Under 5 Years | 0 (0.0%) | 0 (0.0%) |
| 5 to 9 Years | 6 (4.4%) | 0 (0.0%) |
| 10 to 14 Years | 9 (6.6%) | 7 (5.7%) |
| 15 to 19 Years | 8 (5.9%) | 18 (14.6%) |
| 20 to 24 Years | 11 (8.1%) | 5 (4.1%) |
| 25 to 29 Years | 0 (0.0%) | 0 (0.0%) |
| 30 to 34 Years | 0 (0.0%) | 11 (8.9%) |
| 35 to 39 Years | 9 (6.6%) | 6 (4.9%) |
| 40 to 44 Years | 12 (8.8%) | 13 (10.6%) |
| 45 to 49 Years | 32 (23.5%) | 10 (8.1%) |
| 50 to 54 Years | 6 (4.4%) | 22 (17.9%) |
| 55 to 59 Years | 14 (10.3%) | 12 (9.8%) |
| 60 to 64 Years | 10 (7.3%) | 0 (0.0%) |
| 65 to 69 Years | 0 (0.0%) | 0 (0.0%) |
| 70 to 74 Years | 10 (7.3%) | 7 (5.7%) |
| 75 to 79 Years | 5 (3.7%) | 0 (0.0%) |
| 80 to 84 Years | 4 (2.9%) | 12 (9.8%) |
| 85 Years and over | 0 (0.0%) | 0 (0.0%) |
| Total | 136 (100.0%) | 123 (100.0%) |
Families and Households in Crab Orchard
Median Family Size in Crab Orchard
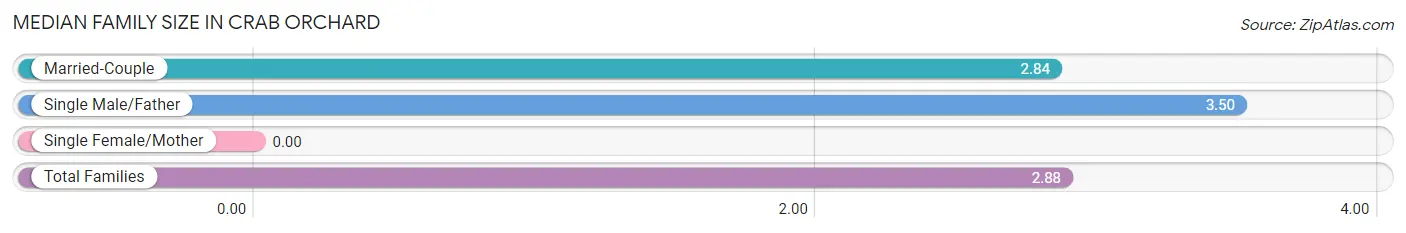
| Family Type | # Families | Family Size |
| Married-Couple | 64 (94.1%) | 2.84 |
| Single Male/Father | 4 (5.9%) | 3.50 |
| Single Female/Mother | 0 (0.0%) | - |
| Total Families | 68 (100.0%) | 2.88 |
Median Household Size in Crab Orchard
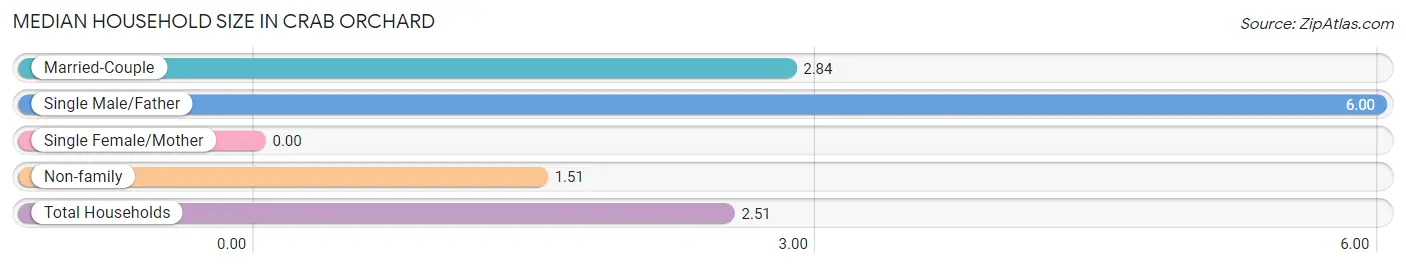
| Household Type | # Households | Household Size |
| Married-Couple | 64 (62.1%) | 2.84 |
| Single Male/Father | 4 (3.9%) | 6.00 |
| Single Female/Mother | 0 (0.0%) | - |
| Non-family | 35 (34.0%) | 1.51 |
| Total Households | 103 (100.0%) | 2.51 |
Household Size by Marriage Status in Crab Orchard
Out of a total of 103 households in Crab Orchard, 68 (66.0%) are family households, while 35 (34.0%) are nonfamily households. The most numerous type of family households are 2-person households, comprising 41, and the most common type of nonfamily households are 1-person households, comprising 20.
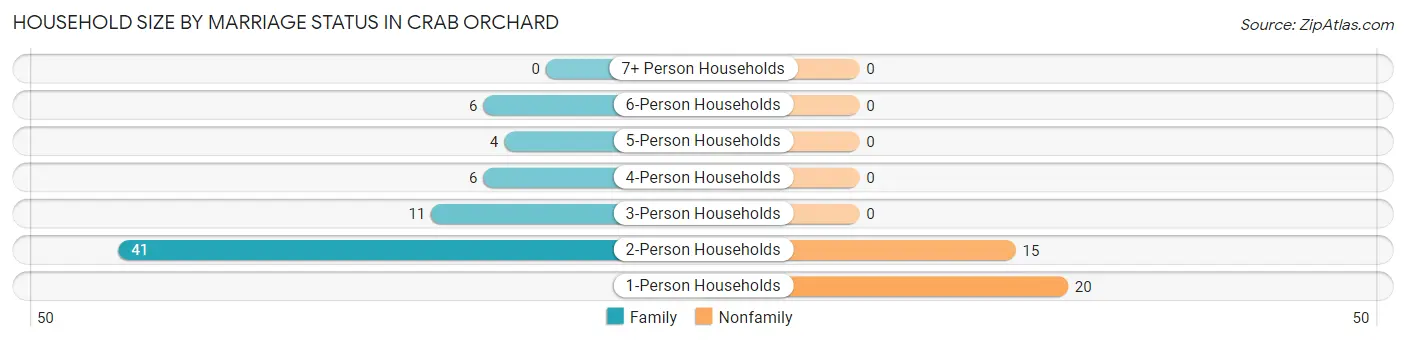
| Household Size | Family Households | Nonfamily Households |
| 1-Person Households | - | 20 (19.4%) |
| 2-Person Households | 41 (39.8%) | 15 (14.6%) |
| 3-Person Households | 11 (10.7%) | 0 (0.0%) |
| 4-Person Households | 6 (5.8%) | 0 (0.0%) |
| 5-Person Households | 4 (3.9%) | 0 (0.0%) |
| 6-Person Households | 6 (5.8%) | 0 (0.0%) |
| 7+ Person Households | 0 (0.0%) | 0 (0.0%) |
| Total | 68 (66.0%) | 35 (34.0%) |
Female Fertility in Crab Orchard
Fertility by Age in Crab Orchard
| Age Bracket | Women with Births | Births / 1,000 Women |
| 15 to 19 years | 0 (0.0%) | 0.0 |
| 20 to 34 years | 0 (0.0%) | 0.0 |
| 35 to 50 years | 0 (0.0%) | 0.0 |
| Total | 0 (0.0%) | 0.0 |
Fertility by Age by Marriage Status in Crab Orchard
| Age Bracket | Married | Unmarried |
| 15 to 19 years | 0 (0.0%) | 0 (0.0%) |
| 20 to 34 years | 0 (0.0%) | 0 (0.0%) |
| 35 to 50 years | 0 (0.0%) | 0 (0.0%) |
| Total | 0 (0.0%) | 0 (0.0%) |
Fertility by Education in Crab Orchard
| Educational Attainment | Women with Births | Births / 1,000 Women |
| Less than High School | 0 (0.0%) | 0.0 |
| High School Diploma | 0 (0.0%) | 0.0 |
| College or Associate's Degree | 0 (0.0%) | 0.0 |
| Bachelor's Degree | 0 (0.0%) | 0.0 |
| Graduate Degree | 0 (0.0%) | 0.0 |
| Total | 0 (0.0%) | 0.0 |
Fertility by Education by Marriage Status in Crab Orchard
| Educational Attainment | Married | Unmarried |
| Less than High School | 0 (0.0%) | 0 (0.0%) |
| High School Diploma | 0 (0.0%) | 0 (0.0%) |
| College or Associate's Degree | 0 (0.0%) | 0 (0.0%) |
| Bachelor's Degree | 0 (0.0%) | 0 (0.0%) |
| Graduate Degree | 0 (0.0%) | 0 (0.0%) |
| Total | 0 (0.0%) | 0 (0.0%) |
Employment Characteristics in Crab Orchard
Employment by Class of Employer in Crab Orchard
Among the 159 employed individuals in Crab Orchard, private company employees (73 | 45.9%), local government employees (55 | 34.6%), and self-employed (incorporated) (14 | 8.8%) make up the most common classes of employment.
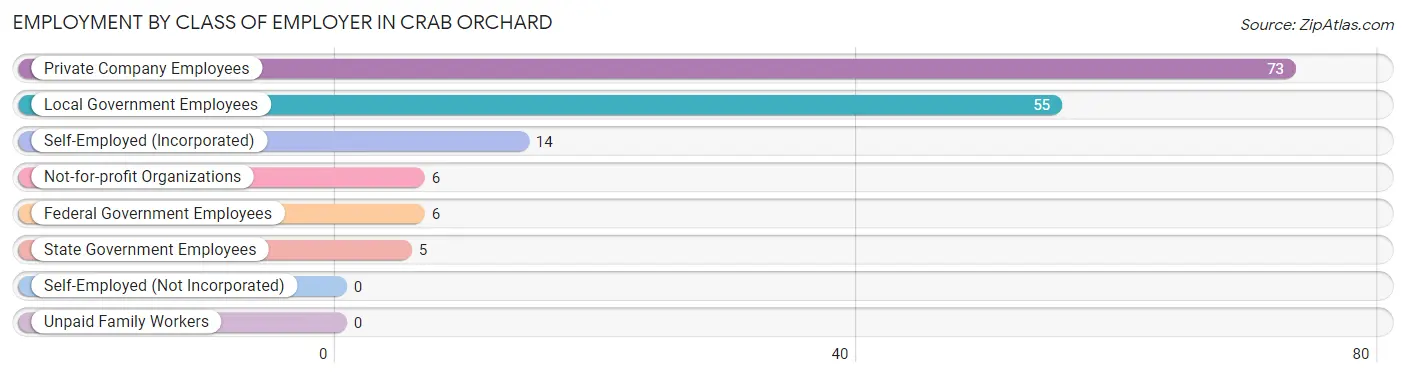
| Employer Class | # Employees | % Employees |
| Private Company Employees | 73 | 45.9% |
| Self-Employed (Incorporated) | 14 | 8.8% |
| Self-Employed (Not Incorporated) | 0 | 0.0% |
| Not-for-profit Organizations | 6 | 3.8% |
| Local Government Employees | 55 | 34.6% |
| State Government Employees | 5 | 3.1% |
| Federal Government Employees | 6 | 3.8% |
| Unpaid Family Workers | 0 | 0.0% |
| Total | 159 | 100.0% |
Employment Status by Age in Crab Orchard
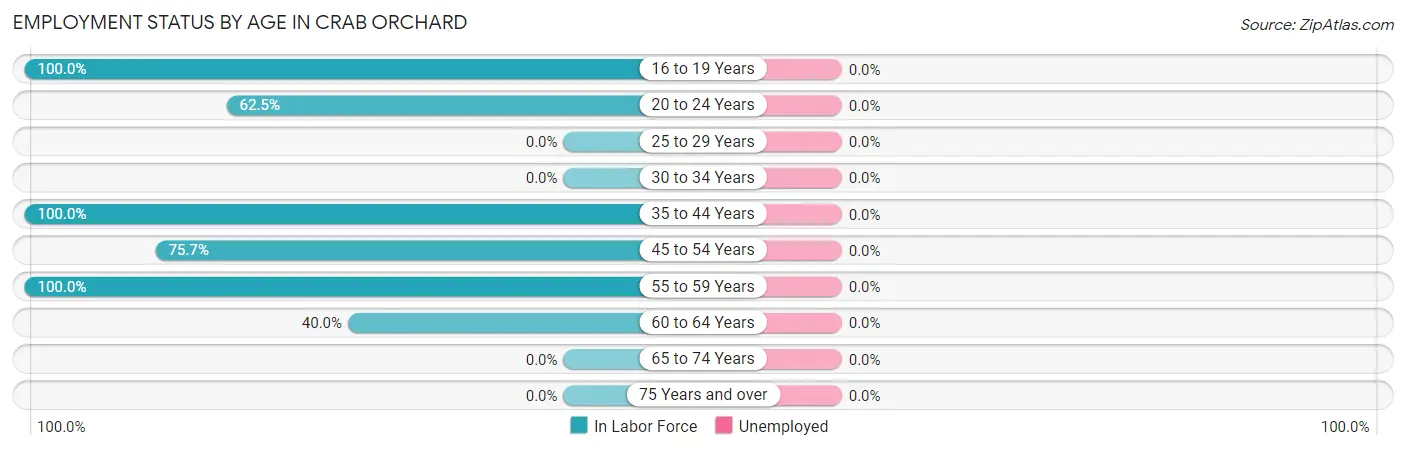
| Age Bracket | In Labor Force | Unemployed |
| 16 to 19 Years | 26 (100.0%) | 0 (0.0%) |
| 20 to 24 Years | 10 (62.5%) | 0 (0.0%) |
| 25 to 29 Years | 0 (0.0%) | 0 (0.0%) |
| 30 to 34 Years | 0 (0.0%) | 0 (0.0%) |
| 35 to 44 Years | 40 (100.0%) | 0 (0.0%) |
| 45 to 54 Years | 53 (75.7%) | 0 (0.0%) |
| 55 to 59 Years | 26 (100.0%) | 0 (0.0%) |
| 60 to 64 Years | 4 (40.0%) | 0 (0.0%) |
| 65 to 74 Years | 0 (0.0%) | 0 (0.0%) |
| 75 Years and over | 0 (0.0%) | 0 (0.0%) |
| Total | 159 (67.1%) | 0 (0.0%) |
Employment Status by Educational Attainment in Crab Orchard
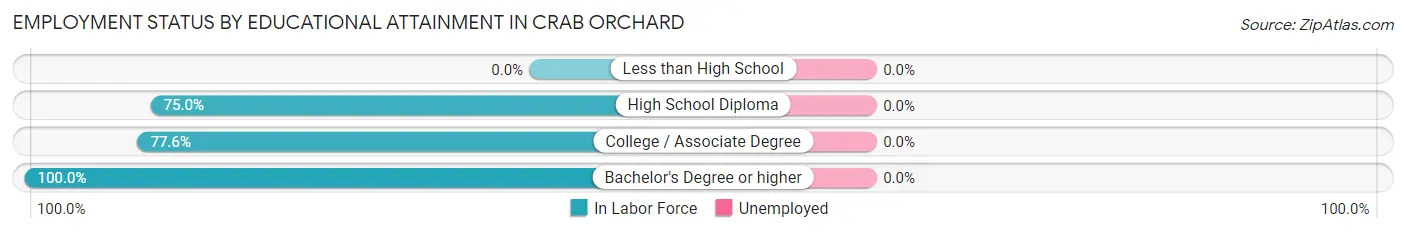
| Educational Attainment | In Labor Force | Unemployed |
| Less than High School | 0 (0.0%) | 0 (0.0%) |
| High School Diploma | 51 (75.0%) | 0 (0.0%) |
| College / Associate Degree | 59 (77.6%) | 0 (0.0%) |
| Bachelor's Degree or higher | 13 (100.0%) | 0 (0.0%) |
| Total | 123 (78.3%) | 0 (0.0%) |
Employment Occupations by Sex in Crab Orchard
Management, Business, Science and Arts Occupations
The most common Management, Business, Science and Arts occupations in Crab Orchard are Community & Social Service (30 | 19.6%), Education Instruction & Library (23 | 15.0%), Management (16 | 10.5%), Legal Services & Support (7 | 4.6%), and Computers, Engineering & Science (6 | 3.9%).
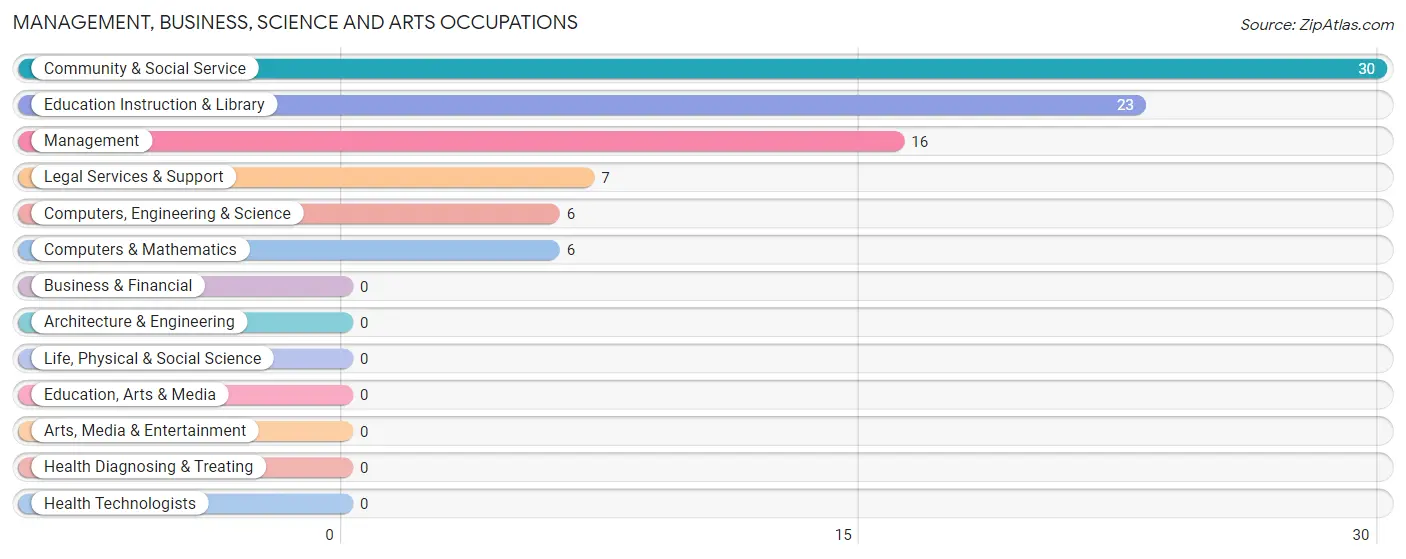
Management, Business, Science and Arts Occupations by Sex
Within the Management, Business, Science and Arts occupations in Crab Orchard, the most male-oriented occupations are Computers, Engineering & Science (100.0%), and Computers & Mathematics (100.0%), while the most female-oriented occupations are Management (100.0%), Community & Social Service (100.0%), and Legal Services & Support (100.0%).
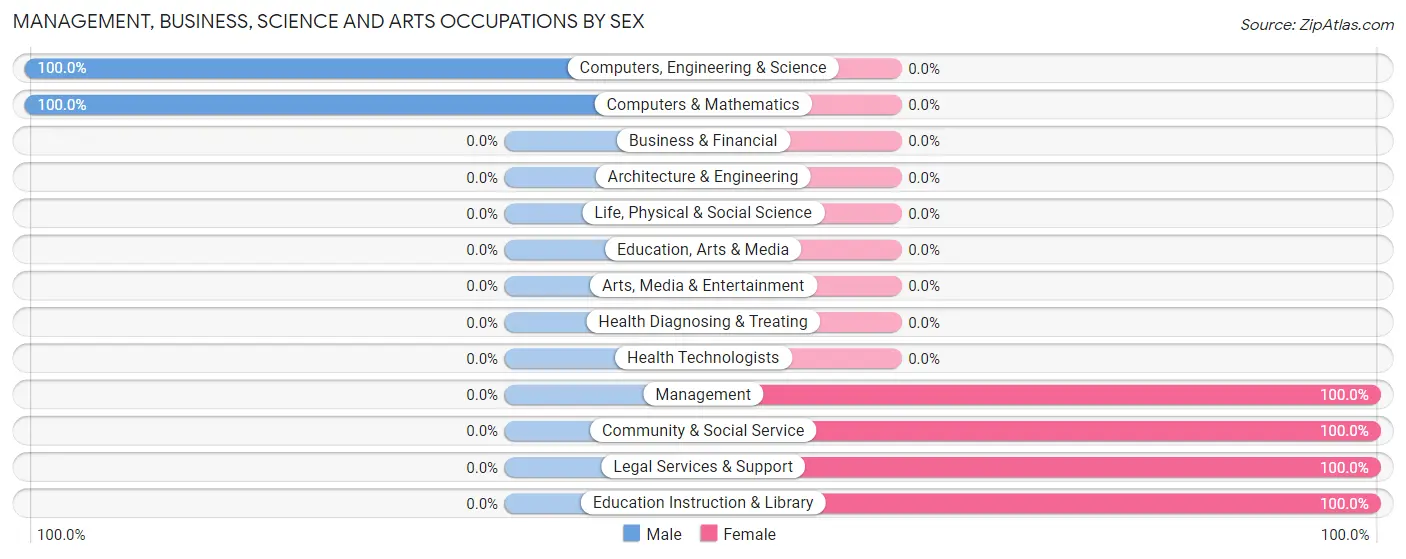
| Occupation | Male | Female |
| Management | 0 (0.0%) | 16 (100.0%) |
| Business & Financial | 0 (0.0%) | 0 (0.0%) |
| Computers, Engineering & Science | 6 (100.0%) | 0 (0.0%) |
| Computers & Mathematics | 6 (100.0%) | 0 (0.0%) |
| Architecture & Engineering | 0 (0.0%) | 0 (0.0%) |
| Life, Physical & Social Science | 0 (0.0%) | 0 (0.0%) |
| Community & Social Service | 0 (0.0%) | 30 (100.0%) |
| Education, Arts & Media | 0 (0.0%) | 0 (0.0%) |
| Legal Services & Support | 0 (0.0%) | 7 (100.0%) |
| Education Instruction & Library | 0 (0.0%) | 23 (100.0%) |
| Arts, Media & Entertainment | 0 (0.0%) | 0 (0.0%) |
| Health Diagnosing & Treating | 0 (0.0%) | 0 (0.0%) |
| Health Technologists | 0 (0.0%) | 0 (0.0%) |
| Total (Category) | 6 (11.5%) | 46 (88.5%) |
| Total (Overall) | 67 (43.8%) | 86 (56.2%) |
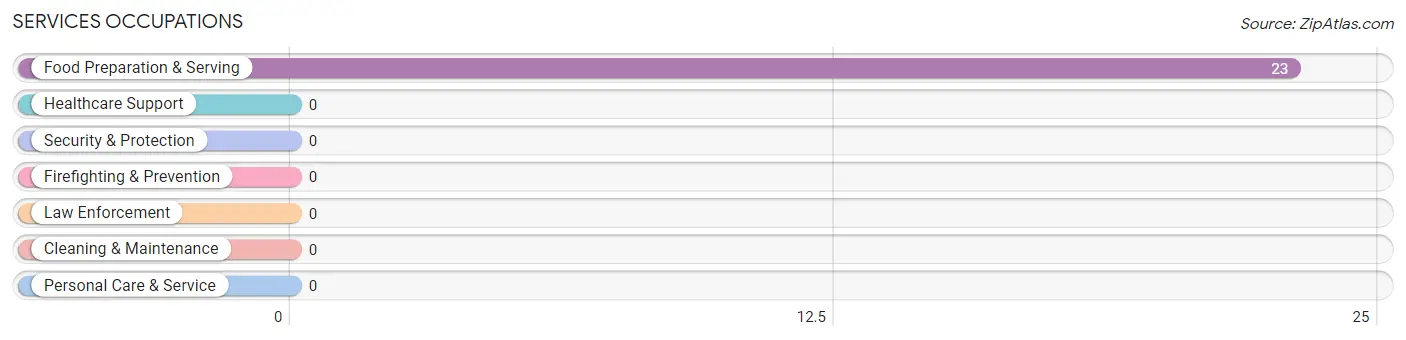
Services Occupations
The most common Services occupations in Crab Orchard are , and Food Preparation & Serving (23 | 15.0%).
Services Occupations by Sex
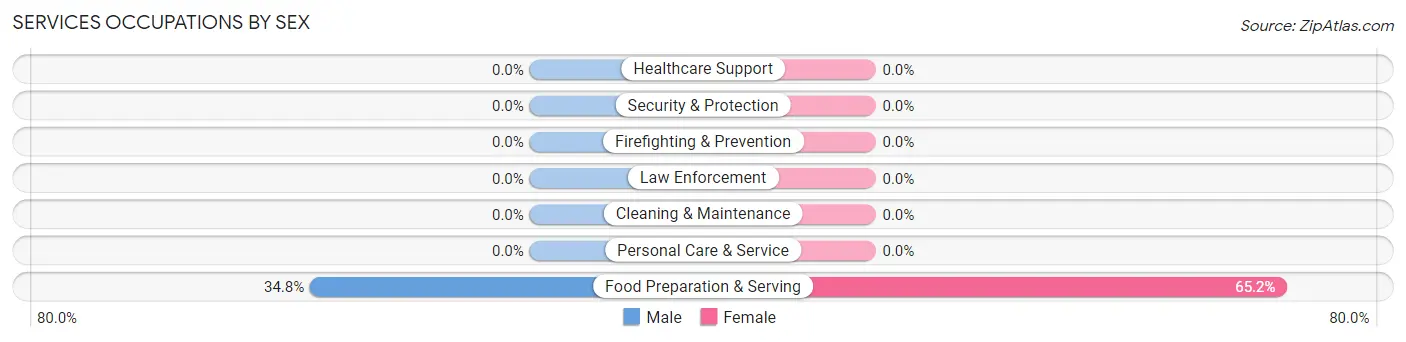
| Occupation | Male | Female |
| Healthcare Support | 0 (0.0%) | 0 (0.0%) |
| Security & Protection | 0 (0.0%) | 0 (0.0%) |
| Firefighting & Prevention | 0 (0.0%) | 0 (0.0%) |
| Law Enforcement | 0 (0.0%) | 0 (0.0%) |
| Food Preparation & Serving | 8 (34.8%) | 15 (65.2%) |
| Cleaning & Maintenance | 0 (0.0%) | 0 (0.0%) |
| Personal Care & Service | 0 (0.0%) | 0 (0.0%) |
| Total (Category) | 8 (34.8%) | 15 (65.2%) |
| Total (Overall) | 67 (43.8%) | 86 (56.2%) |
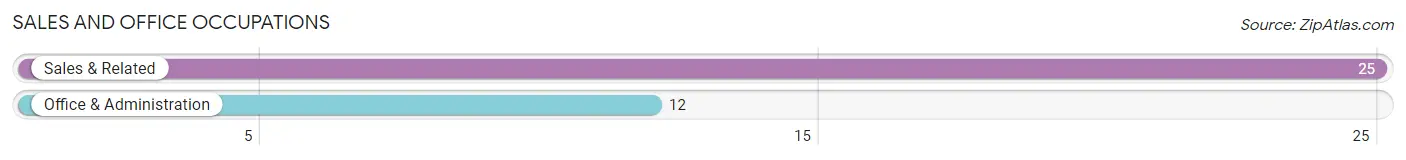
Sales and Office Occupations
The most common Sales and Office occupations in Crab Orchard are Sales & Related (25 | 16.3%), and Office & Administration (12 | 7.8%).
Sales and Office Occupations by Sex
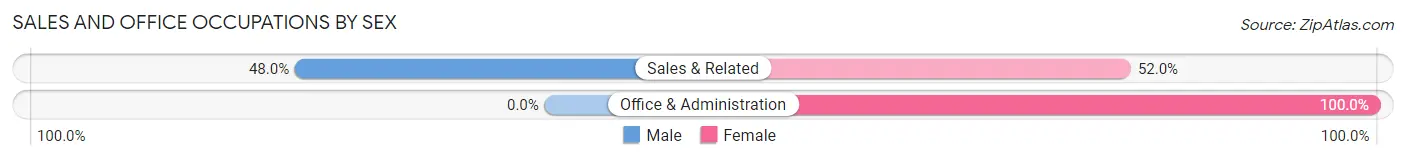
| Occupation | Male | Female |
| Sales & Related | 12 (48.0%) | 13 (52.0%) |
| Office & Administration | 0 (0.0%) | 12 (100.0%) |
| Total (Category) | 12 (32.4%) | 25 (67.6%) |
| Total (Overall) | 67 (43.8%) | 86 (56.2%) |
Natural Resources, Construction and Maintenance Occupations
The most common Natural Resources, Construction and Maintenance occupations in Crab Orchard are Construction & Extraction (19 | 12.4%), and Installation, Maintenance & Repair (6 | 3.9%).
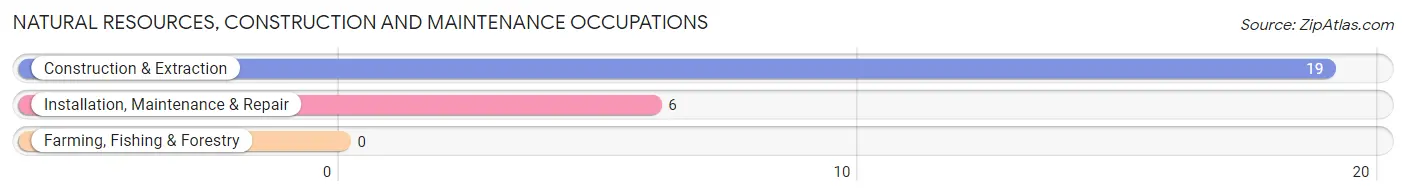
Natural Resources, Construction and Maintenance Occupations by Sex
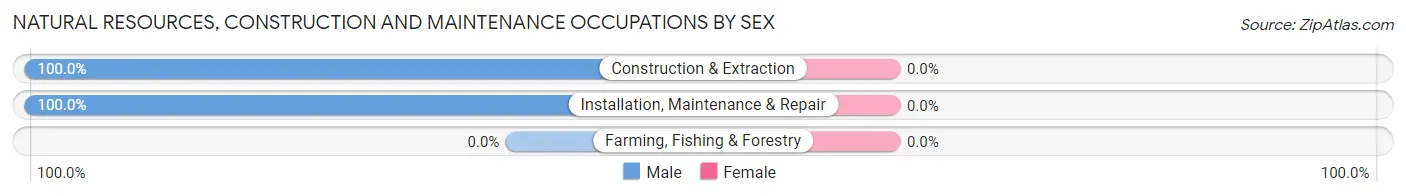
| Occupation | Male | Female |
| Farming, Fishing & Forestry | 0 (0.0%) | 0 (0.0%) |
| Construction & Extraction | 19 (100.0%) | 0 (0.0%) |
| Installation, Maintenance & Repair | 6 (100.0%) | 0 (0.0%) |
| Total (Category) | 25 (100.0%) | 0 (0.0%) |
| Total (Overall) | 67 (43.8%) | 86 (56.2%) |
Production, Transportation and Moving Occupations
The most common Production, Transportation and Moving occupations in Crab Orchard are Production (9 | 5.9%), and Transportation (7 | 4.6%).
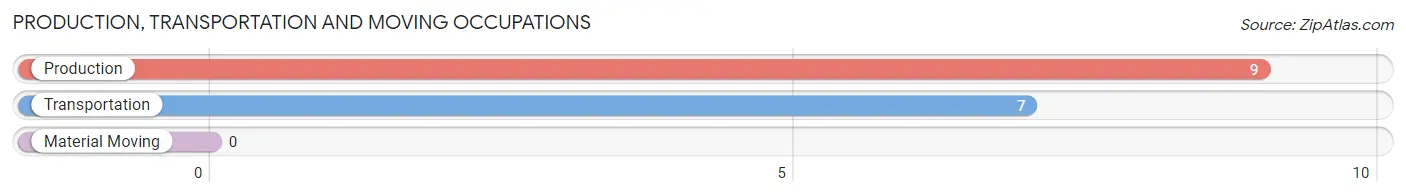
Production, Transportation and Moving Occupations by Sex
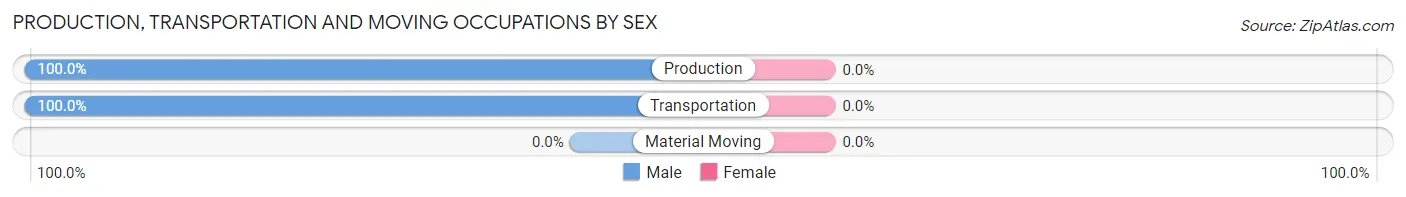
| Occupation | Male | Female |
| Production | 9 (100.0%) | 0 (0.0%) |
| Transportation | 7 (100.0%) | 0 (0.0%) |
| Material Moving | 0 (0.0%) | 0 (0.0%) |
| Total (Category) | 16 (100.0%) | 0 (0.0%) |
| Total (Overall) | 67 (43.8%) | 86 (56.2%) |
Employment Industries by Sex in Crab Orchard
Employment Industries in Crab Orchard
The major employment industries in Crab Orchard include Retail Trade (32 | 20.9%), Public Administration (22 | 14.4%), Educational Services (21 | 13.7%), Construction (19 | 12.4%), and Information (17 | 11.1%).
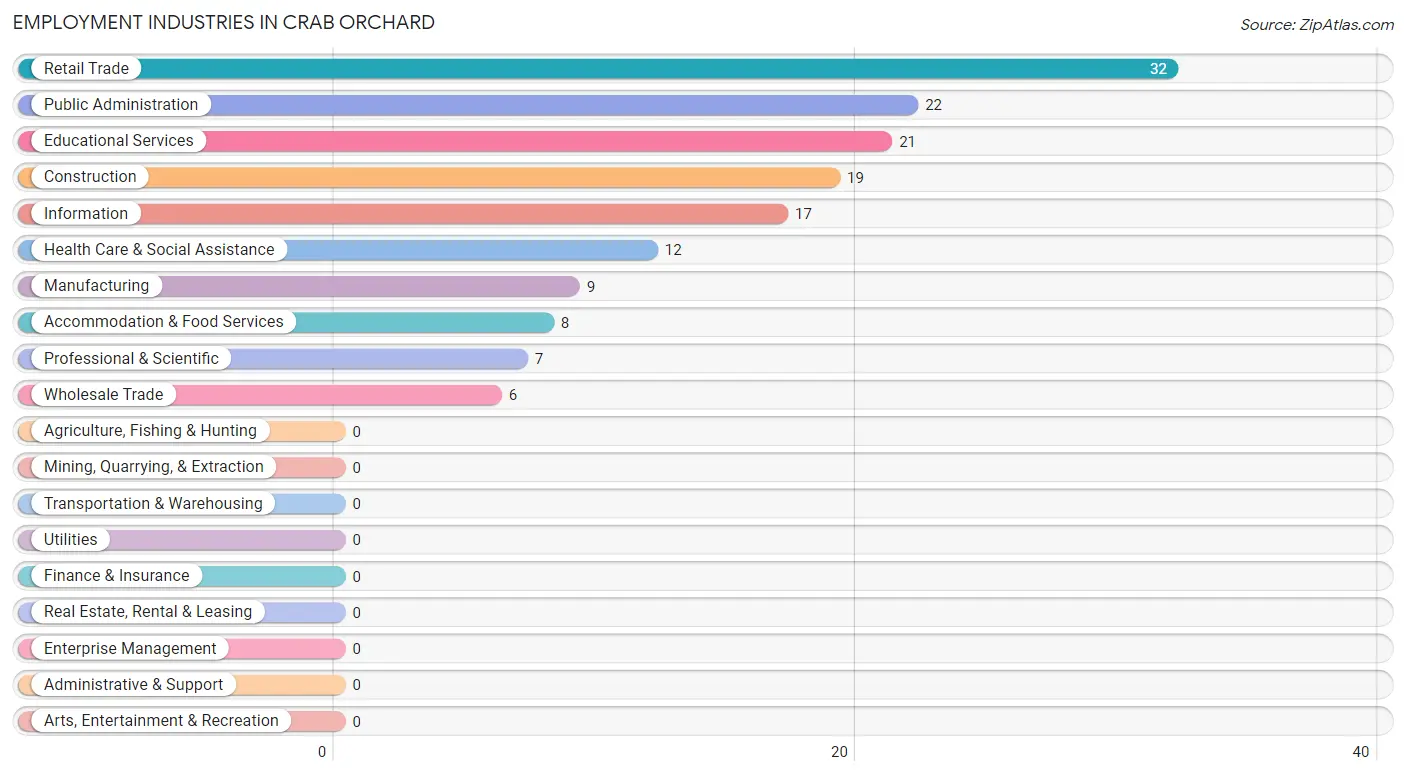
Employment Industries by Sex in Crab Orchard
The Crab Orchard industries that see more men than women are Construction (100.0%), Manufacturing (100.0%), and Wholesale Trade (100.0%), whereas the industries that tend to have a higher number of women are Information (100.0%), Professional & Scientific (100.0%), and Educational Services (100.0%).
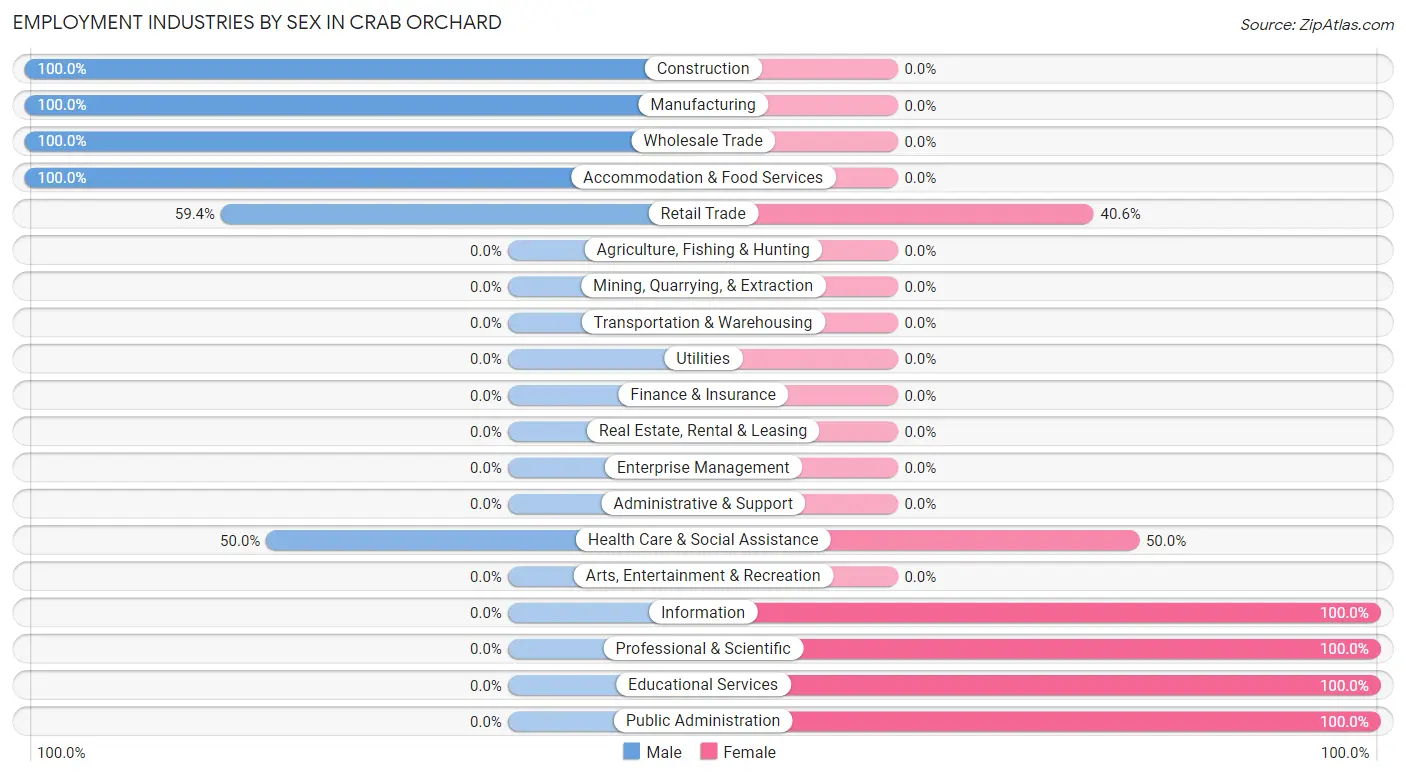
| Industry | Male | Female |
| Agriculture, Fishing & Hunting | 0 (0.0%) | 0 (0.0%) |
| Mining, Quarrying, & Extraction | 0 (0.0%) | 0 (0.0%) |
| Construction | 19 (100.0%) | 0 (0.0%) |
| Manufacturing | 9 (100.0%) | 0 (0.0%) |
| Wholesale Trade | 6 (100.0%) | 0 (0.0%) |
| Retail Trade | 19 (59.4%) | 13 (40.6%) |
| Transportation & Warehousing | 0 (0.0%) | 0 (0.0%) |
| Utilities | 0 (0.0%) | 0 (0.0%) |
| Information | 0 (0.0%) | 17 (100.0%) |
| Finance & Insurance | 0 (0.0%) | 0 (0.0%) |
| Real Estate, Rental & Leasing | 0 (0.0%) | 0 (0.0%) |
| Professional & Scientific | 0 (0.0%) | 7 (100.0%) |
| Enterprise Management | 0 (0.0%) | 0 (0.0%) |
| Administrative & Support | 0 (0.0%) | 0 (0.0%) |
| Educational Services | 0 (0.0%) | 21 (100.0%) |
| Health Care & Social Assistance | 6 (50.0%) | 6 (50.0%) |
| Arts, Entertainment & Recreation | 0 (0.0%) | 0 (0.0%) |
| Accommodation & Food Services | 8 (100.0%) | 0 (0.0%) |
| Public Administration | 0 (0.0%) | 22 (100.0%) |
| Total | 67 (43.8%) | 86 (56.2%) |
Education in Crab Orchard
School Enrollment in Crab Orchard
The most common levels of schooling among the 50 students in Crab Orchard are high school (16 | 32.0%), college / undergraduate (16 | 32.0%), and middle school (12 | 24.0%).
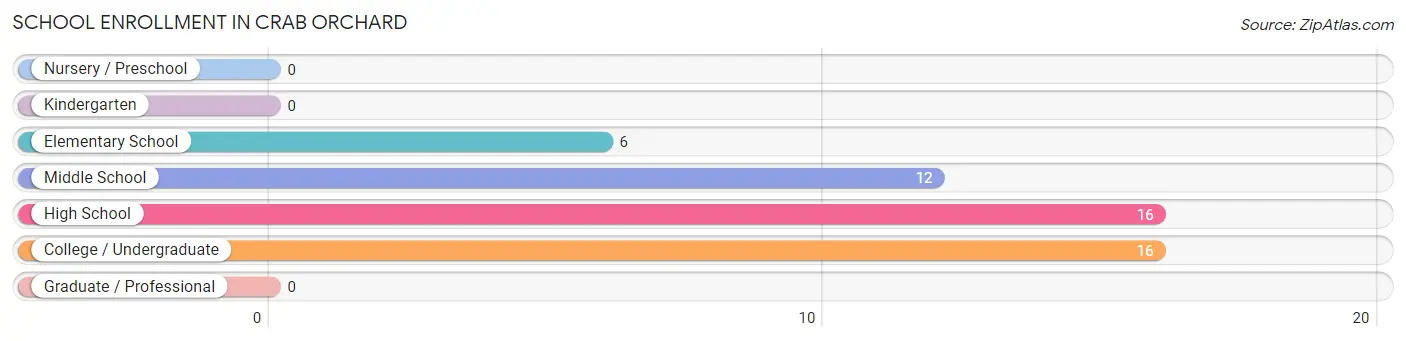
| School Level | # Students | % Students |
| Nursery / Preschool | 0 | 0.0% |
| Kindergarten | 0 | 0.0% |
| Elementary School | 6 | 12.0% |
| Middle School | 12 | 24.0% |
| High School | 16 | 32.0% |
| College / Undergraduate | 16 | 32.0% |
| Graduate / Professional | 0 | 0.0% |
| Total | 50 | 100.0% |
School Enrollment by Age by Funding Source in Crab Orchard
Out of a total of 50 students who are enrolled in schools in Crab Orchard, 8 (16.0%) attend a private institution, while the remaining 42 (84.0%) are enrolled in public schools. The age group of 15 to 17 year olds has the highest likelihood of being enrolled in private schools, with 8 (50.0% in the age bracket) enrolled. Conversely, the age group of 5 to 9 year old has the lowest likelihood of being enrolled in a private school, with 6 (100.0% in the age bracket) attending a public institution.
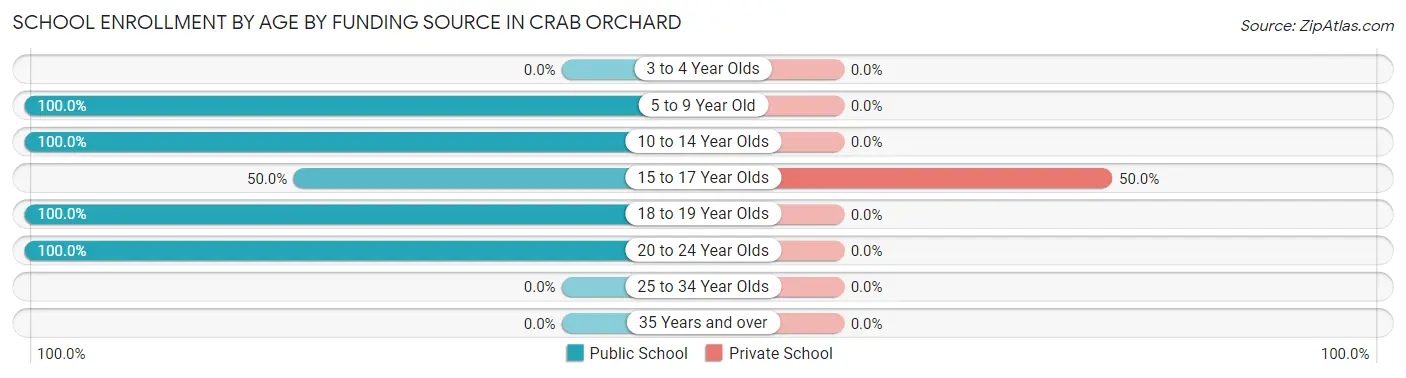
| Age Bracket | Public School | Private School |
| 3 to 4 Year Olds | 0 (0.0%) | 0 (0.0%) |
| 5 to 9 Year Old | 6 (100.0%) | 0 (0.0%) |
| 10 to 14 Year Olds | 12 (100.0%) | 0 (0.0%) |
| 15 to 17 Year Olds | 8 (50.0%) | 8 (50.0%) |
| 18 to 19 Year Olds | 10 (100.0%) | 0 (0.0%) |
| 20 to 24 Year Olds | 6 (100.0%) | 0 (0.0%) |
| 25 to 34 Year Olds | 0 (0.0%) | 0 (0.0%) |
| 35 Years and over | 0 (0.0%) | 0 (0.0%) |
| Total | 42 (84.0%) | 8 (16.0%) |
Educational Attainment by Field of Study in Crab Orchard
Business (7 | 53.8%), and education (6 | 46.2%) are the most common fields of study among 13 individuals in Crab Orchard who have obtained a bachelor's degree or higher.
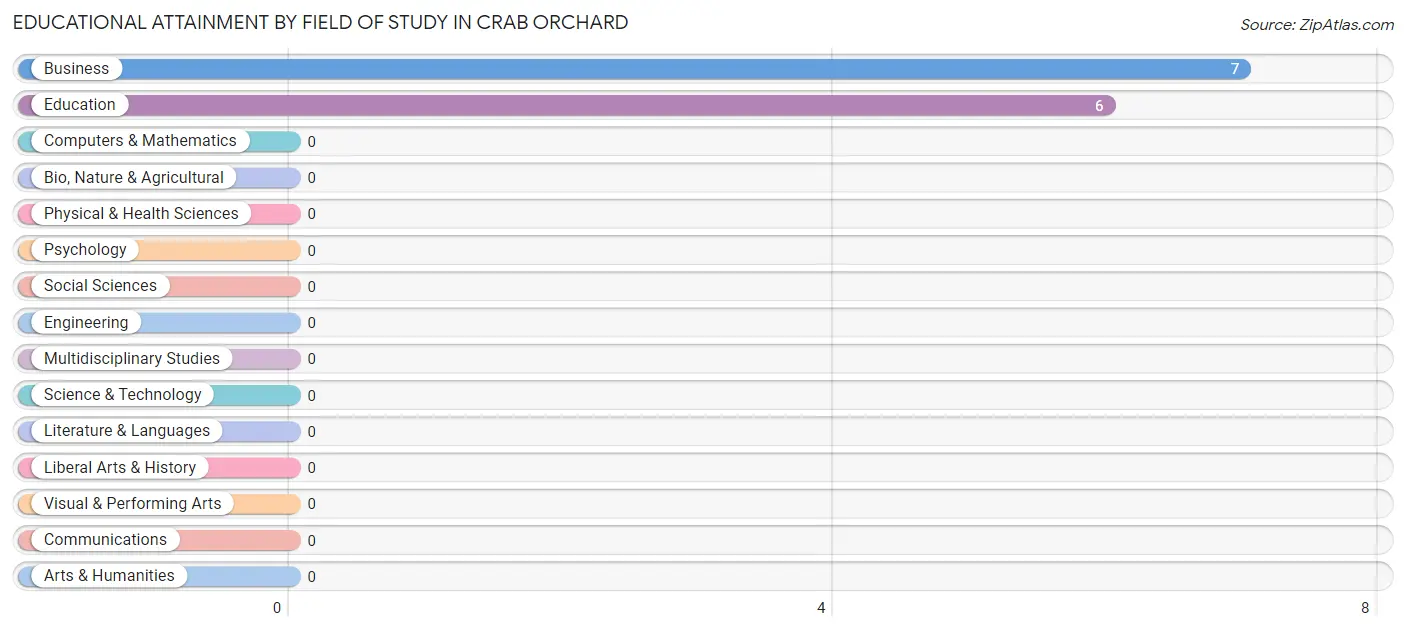
| Field of Study | # Graduates | % Graduates |
| Computers & Mathematics | 0 | 0.0% |
| Bio, Nature & Agricultural | 0 | 0.0% |
| Physical & Health Sciences | 0 | 0.0% |
| Psychology | 0 | 0.0% |
| Social Sciences | 0 | 0.0% |
| Engineering | 0 | 0.0% |
| Multidisciplinary Studies | 0 | 0.0% |
| Science & Technology | 0 | 0.0% |
| Business | 7 | 53.8% |
| Education | 6 | 46.2% |
| Literature & Languages | 0 | 0.0% |
| Liberal Arts & History | 0 | 0.0% |
| Visual & Performing Arts | 0 | 0.0% |
| Communications | 0 | 0.0% |
| Arts & Humanities | 0 | 0.0% |
| Total | 13 | 100.0% |
Transportation & Commute in Crab Orchard
Vehicle Availability by Sex in Crab Orchard
The most prevalent vehicle ownership categories in Crab Orchard are males with 2 vehicles (49, accounting for 67.1%) and females with 2 vehicles (55, making up 57.0%).
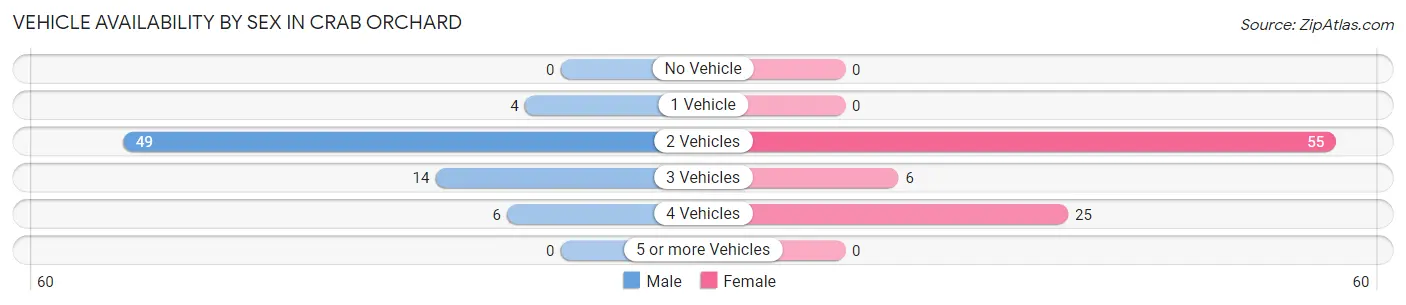
| Vehicles Available | Male | Female |
| No Vehicle | 0 (0.0%) | 0 (0.0%) |
| 1 Vehicle | 4 (5.5%) | 0 (0.0%) |
| 2 Vehicles | 49 (67.1%) | 55 (63.9%) |
| 3 Vehicles | 14 (19.2%) | 6 (7.0%) |
| 4 Vehicles | 6 (8.2%) | 25 (29.1%) |
| 5 or more Vehicles | 0 (0.0%) | 0 (0.0%) |
| Total | 73 (100.0%) | 86 (100.0%) |
Commute Time in Crab Orchard
The most frequently occuring commute durations in Crab Orchard are 15 to 19 minutes (37 commuters, 23.3%), 90 or more minutes (31 commuters, 19.5%), and less than 5 minutes (22 commuters, 13.8%).
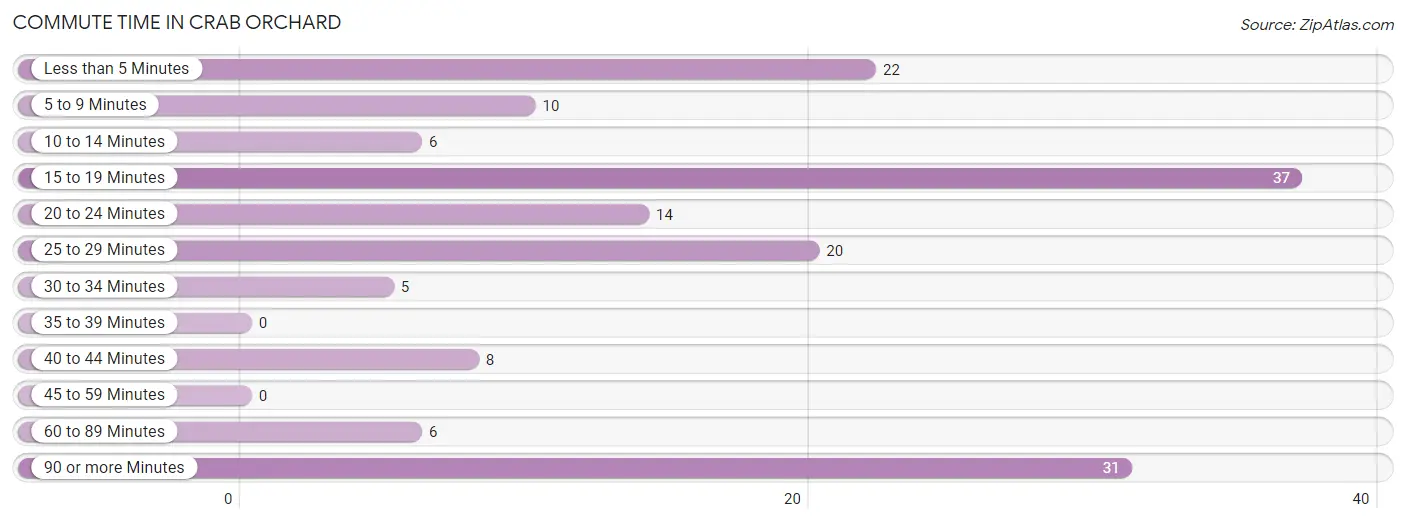
| Commute Time | # Commuters | % Commuters |
| Less than 5 Minutes | 22 | 13.8% |
| 5 to 9 Minutes | 10 | 6.3% |
| 10 to 14 Minutes | 6 | 3.8% |
| 15 to 19 Minutes | 37 | 23.3% |
| 20 to 24 Minutes | 14 | 8.8% |
| 25 to 29 Minutes | 20 | 12.6% |
| 30 to 34 Minutes | 5 | 3.1% |
| 35 to 39 Minutes | 0 | 0.0% |
| 40 to 44 Minutes | 8 | 5.0% |
| 45 to 59 Minutes | 0 | 0.0% |
| 60 to 89 Minutes | 6 | 3.8% |
| 90 or more Minutes | 31 | 19.5% |
Commute Time by Sex in Crab Orchard
The most common commute times in Crab Orchard are 90 or more minutes (31 commuters, 42.5%) for males and less than 5 minutes (22 commuters, 25.6%) for females.
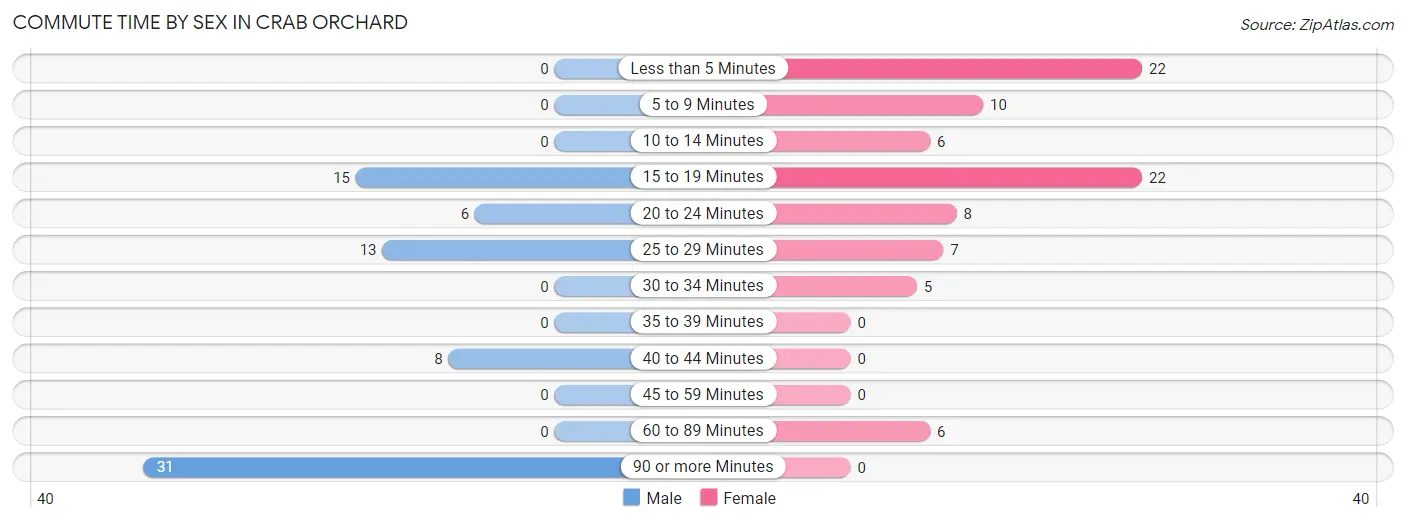
| Commute Time | Male | Female |
| Less than 5 Minutes | 0 (0.0%) | 22 (25.6%) |
| 5 to 9 Minutes | 0 (0.0%) | 10 (11.6%) |
| 10 to 14 Minutes | 0 (0.0%) | 6 (7.0%) |
| 15 to 19 Minutes | 15 (20.5%) | 22 (25.6%) |
| 20 to 24 Minutes | 6 (8.2%) | 8 (9.3%) |
| 25 to 29 Minutes | 13 (17.8%) | 7 (8.1%) |
| 30 to 34 Minutes | 0 (0.0%) | 5 (5.8%) |
| 35 to 39 Minutes | 0 (0.0%) | 0 (0.0%) |
| 40 to 44 Minutes | 8 (11.0%) | 0 (0.0%) |
| 45 to 59 Minutes | 0 (0.0%) | 0 (0.0%) |
| 60 to 89 Minutes | 0 (0.0%) | 6 (7.0%) |
| 90 or more Minutes | 31 (42.5%) | 0 (0.0%) |
Time of Departure to Work by Sex in Crab Orchard
The most frequent times of departure to work in Crab Orchard are 6:00 AM to 6:29 AM (15, 20.5%) for males and 7:30 AM to 7:59 AM (36, 41.9%) for females.
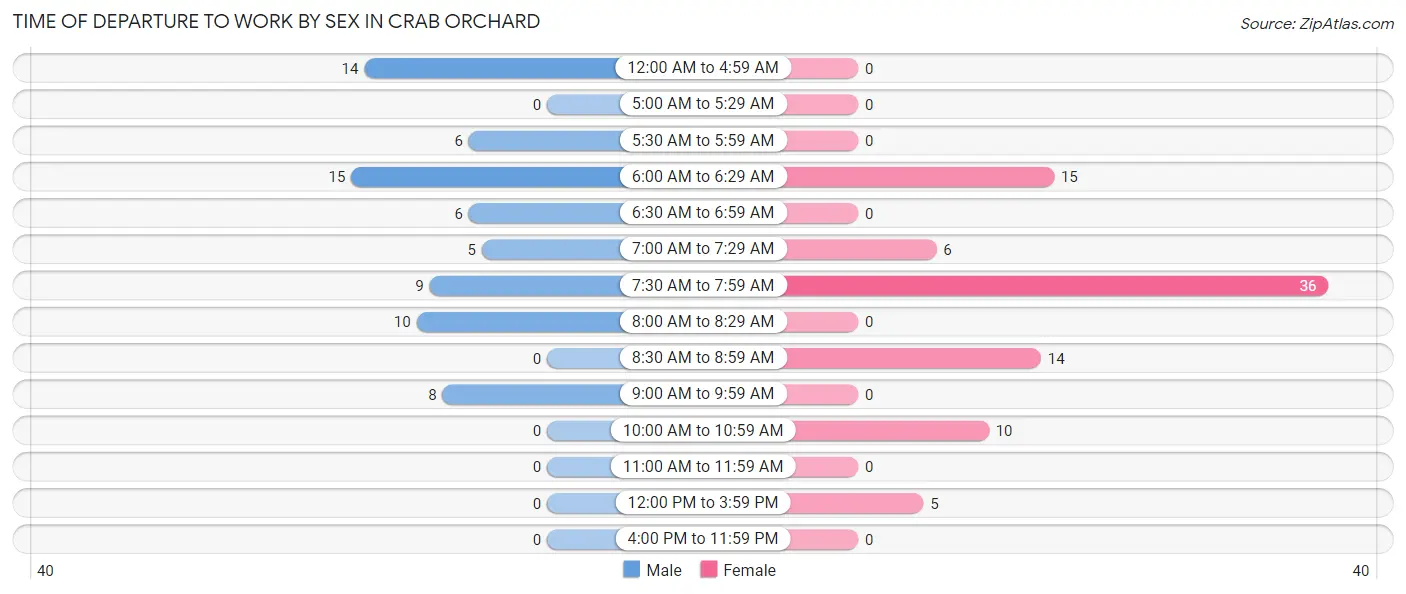
| Time of Departure | Male | Female |
| 12:00 AM to 4:59 AM | 14 (19.2%) | 0 (0.0%) |
| 5:00 AM to 5:29 AM | 0 (0.0%) | 0 (0.0%) |
| 5:30 AM to 5:59 AM | 6 (8.2%) | 0 (0.0%) |
| 6:00 AM to 6:29 AM | 15 (20.5%) | 15 (17.4%) |
| 6:30 AM to 6:59 AM | 6 (8.2%) | 0 (0.0%) |
| 7:00 AM to 7:29 AM | 5 (6.9%) | 6 (7.0%) |
| 7:30 AM to 7:59 AM | 9 (12.3%) | 36 (41.9%) |
| 8:00 AM to 8:29 AM | 10 (13.7%) | 0 (0.0%) |
| 8:30 AM to 8:59 AM | 0 (0.0%) | 14 (16.3%) |
| 9:00 AM to 9:59 AM | 8 (11.0%) | 0 (0.0%) |
| 10:00 AM to 10:59 AM | 0 (0.0%) | 10 (11.6%) |
| 11:00 AM to 11:59 AM | 0 (0.0%) | 0 (0.0%) |
| 12:00 PM to 3:59 PM | 0 (0.0%) | 5 (5.8%) |
| 4:00 PM to 11:59 PM | 0 (0.0%) | 0 (0.0%) |
| Total | 73 (100.0%) | 86 (100.0%) |
Housing Occupancy in Crab Orchard
Occupancy by Ownership in Crab Orchard
Of the total 103 dwellings in Crab Orchard, owner-occupied units account for 86 (83.5%), while renter-occupied units make up 17 (16.5%).
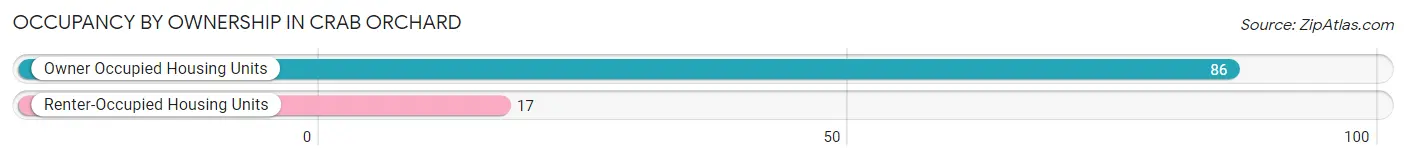
| Occupancy | # Housing Units | % Housing Units |
| Owner Occupied Housing Units | 86 | 83.5% |
| Renter-Occupied Housing Units | 17 | 16.5% |
| Total Occupied Housing Units | 103 | 100.0% |
Occupancy by Household Size in Crab Orchard
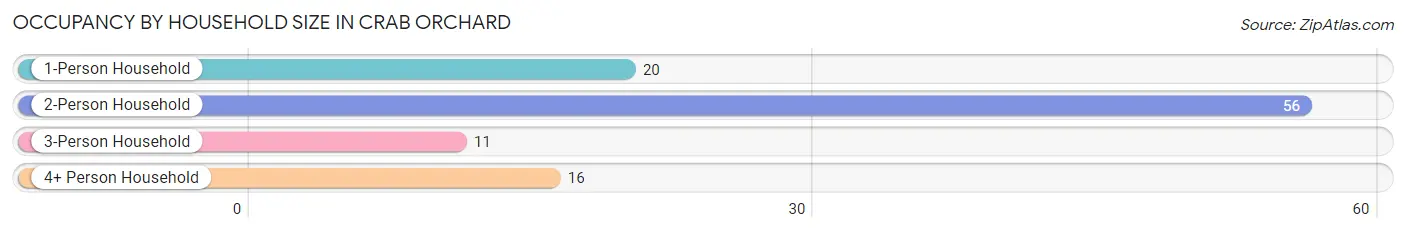
| Household Size | # Housing Units | % Housing Units |
| 1-Person Household | 20 | 19.4% |
| 2-Person Household | 56 | 54.4% |
| 3-Person Household | 11 | 10.7% |
| 4+ Person Household | 16 | 15.5% |
| Total Housing Units | 103 | 100.0% |
Occupancy by Ownership by Household Size in Crab Orchard
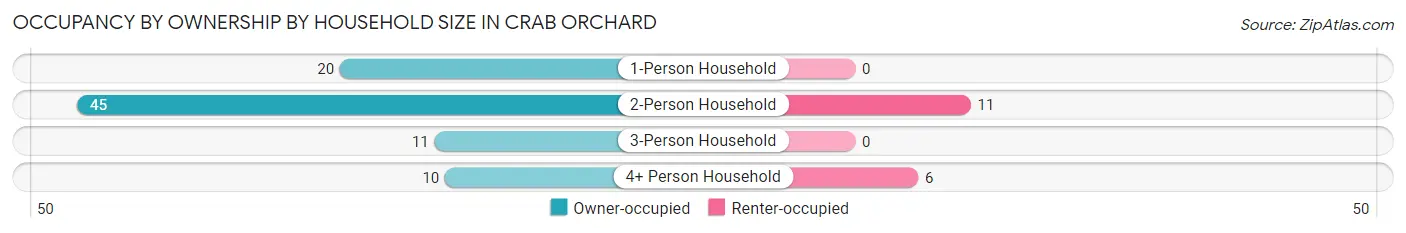
| Household Size | Owner-occupied | Renter-occupied |
| 1-Person Household | 20 (100.0%) | 0 (0.0%) |
| 2-Person Household | 45 (80.4%) | 11 (19.6%) |
| 3-Person Household | 11 (100.0%) | 0 (0.0%) |
| 4+ Person Household | 10 (62.5%) | 6 (37.5%) |
| Total Housing Units | 86 (83.5%) | 17 (16.5%) |
Occupancy by Educational Attainment in Crab Orchard
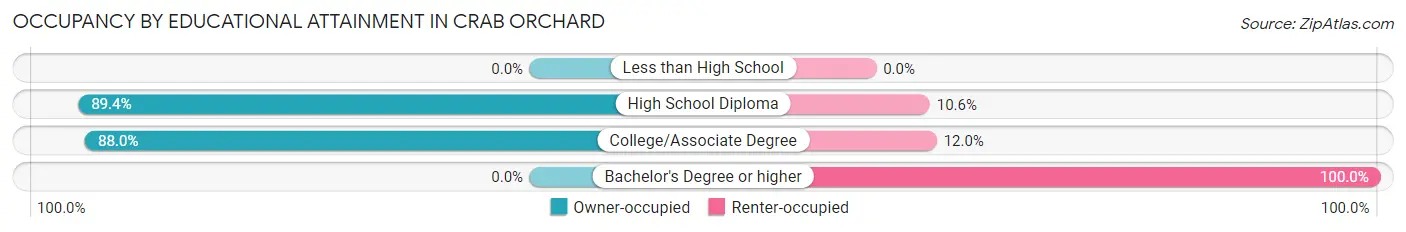
| Household Size | Owner-occupied | Renter-occupied |
| Less than High School | 0 (0.0%) | 0 (0.0%) |
| High School Diploma | 42 (89.4%) | 5 (10.6%) |
| College/Associate Degree | 44 (88.0%) | 6 (12.0%) |
| Bachelor's Degree or higher | 0 (0.0%) | 6 (100.0%) |
Occupancy by Age of Householder in Crab Orchard
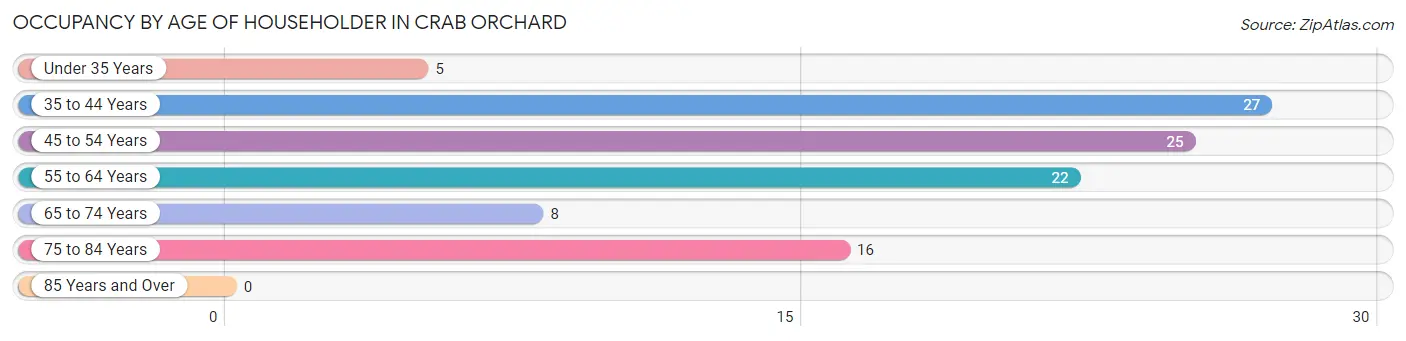
| Age Bracket | # Households | % Households |
| Under 35 Years | 5 | 4.9% |
| 35 to 44 Years | 27 | 26.2% |
| 45 to 54 Years | 25 | 24.3% |
| 55 to 64 Years | 22 | 21.4% |
| 65 to 74 Years | 8 | 7.8% |
| 75 to 84 Years | 16 | 15.5% |
| 85 Years and Over | 0 | 0.0% |
| Total | 103 | 100.0% |
Housing Finances in Crab Orchard
Median Income by Occupancy in Crab Orchard
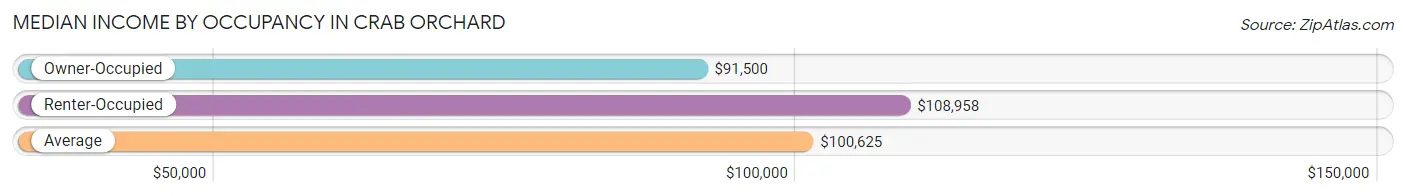
| Occupancy Type | # Households | Median Income |
| Owner-Occupied | 86 (83.5%) | $91,500 |
| Renter-Occupied | 17 (16.5%) | $108,958 |
| Average | 103 (100.0%) | $100,625 |
Occupancy by Householder Income Bracket in Crab Orchard
| Income Bracket | Owner-occupied | Renter-occupied |
| Less than $5,000 | 0 (0.0%) | 0 (0.0%) |
| $5,000 to $9,999 | 0 (0.0%) | 0 (0.0%) |
| $10,000 to $14,999 | 12 (14.0%) | 0 (0.0%) |
| $15,000 to $19,999 | 0 (0.0%) | 0 (0.0%) |
| $20,000 to $24,999 | 0 (0.0%) | 0 (0.0%) |
| $25,000 to $34,999 | 0 (0.0%) | 5 (29.4%) |
| $35,000 to $49,999 | 17 (19.8%) | 0 (0.0%) |
| $50,000 to $74,999 | 11 (12.8%) | 0 (0.0%) |
| $75,000 to $99,999 | 5 (5.8%) | 0 (0.0%) |
| $100,000 to $149,999 | 6 (7.0%) | 12 (70.6%) |
| $150,000 or more | 35 (40.7%) | 0 (0.0%) |
| Total | 86 (100.0%) | 17 (100.0%) |
Monthly Housing Cost Tiers in Crab Orchard
| Monthly Cost | Owner-occupied | Renter-occupied |
| Less than $300 | 12 (14.0%) | 0 (0.0%) |
| $300 to $499 | 0 (0.0%) | 0 (0.0%) |
| $500 to $799 | 16 (18.6%) | 11 (64.7%) |
| $800 to $999 | 27 (31.4%) | 0 (0.0%) |
| $1,000 to $1,499 | 31 (36.0%) | 0 (0.0%) |
| $1,500 to $1,999 | 0 (0.0%) | 6 (35.3%) |
| $2,000 to $2,499 | 0 (0.0%) | 0 (0.0%) |
| $2,500 to $2,999 | 0 (0.0%) | 0 (0.0%) |
| $3,000 or more | 0 (0.0%) | 0 (0.0%) |
| Total | 86 (100.0%) | 17 (100.0%) |
Physical Housing Characteristics in Crab Orchard
Housing Structures in Crab Orchard
| Structure Type | # Housing Units | % Housing Units |
| Single Unit, Detached | 70 | 68.0% |
| Single Unit, Attached | 0 | 0.0% |
| 2 Unit Apartments | 0 | 0.0% |
| 3 or 4 Unit Apartments | 5 | 4.9% |
| 5 to 9 Unit Apartments | 0 | 0.0% |
| 10 or more Apartments | 0 | 0.0% |
| Mobile Home / Other | 28 | 27.2% |
| Total | 103 | 100.0% |
Housing Structures by Occupancy in Crab Orchard
| Structure Type | Owner-occupied | Renter-occupied |
| Single Unit, Detached | 58 (82.9%) | 12 (17.1%) |
| Single Unit, Attached | 0 (0.0%) | 0 (0.0%) |
| 2 Unit Apartments | 0 (0.0%) | 0 (0.0%) |
| 3 or 4 Unit Apartments | 0 (0.0%) | 5 (100.0%) |
| 5 to 9 Unit Apartments | 0 (0.0%) | 0 (0.0%) |
| 10 or more Apartments | 0 (0.0%) | 0 (0.0%) |
| Mobile Home / Other | 28 (100.0%) | 0 (0.0%) |
| Total | 86 (83.5%) | 17 (16.5%) |
Housing Structures by Number of Rooms in Crab Orchard
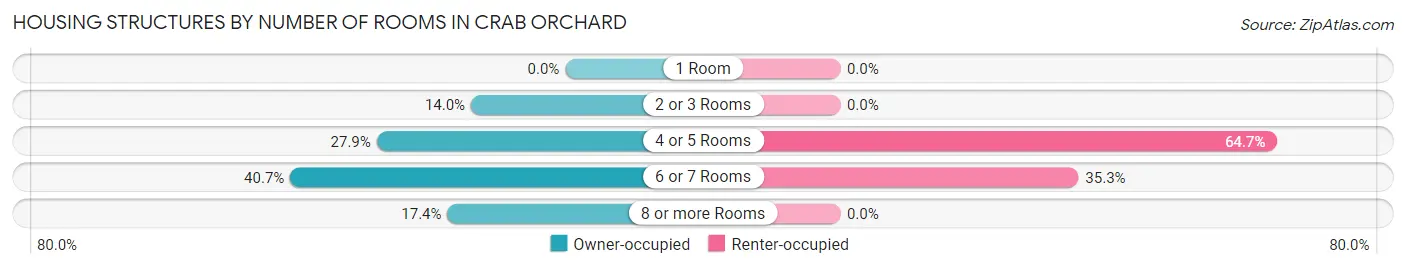
| Number of Rooms | Owner-occupied | Renter-occupied |
| 1 Room | 0 (0.0%) | 0 (0.0%) |
| 2 or 3 Rooms | 12 (14.0%) | 0 (0.0%) |
| 4 or 5 Rooms | 24 (27.9%) | 11 (64.7%) |
| 6 or 7 Rooms | 35 (40.7%) | 6 (35.3%) |
| 8 or more Rooms | 15 (17.4%) | 0 (0.0%) |
| Total | 86 (100.0%) | 17 (100.0%) |
Housing Structure by Heating Type in Crab Orchard
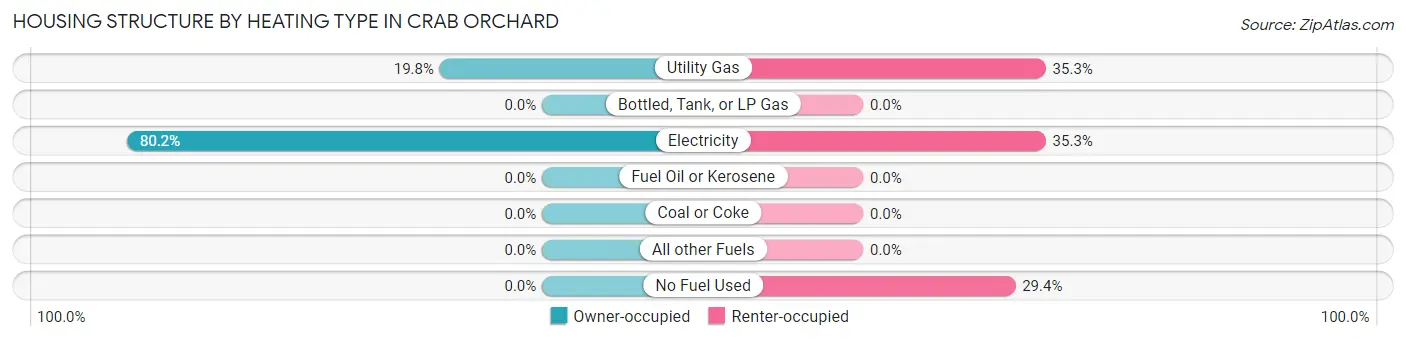
| Heating Type | Owner-occupied | Renter-occupied |
| Utility Gas | 17 (19.8%) | 6 (35.3%) |
| Bottled, Tank, or LP Gas | 0 (0.0%) | 0 (0.0%) |
| Electricity | 69 (80.2%) | 6 (35.3%) |
| Fuel Oil or Kerosene | 0 (0.0%) | 0 (0.0%) |
| Coal or Coke | 0 (0.0%) | 0 (0.0%) |
| All other Fuels | 0 (0.0%) | 0 (0.0%) |
| No Fuel Used | 0 (0.0%) | 5 (29.4%) |
| Total | 86 (100.0%) | 17 (100.0%) |
Household Vehicle Usage in Crab Orchard
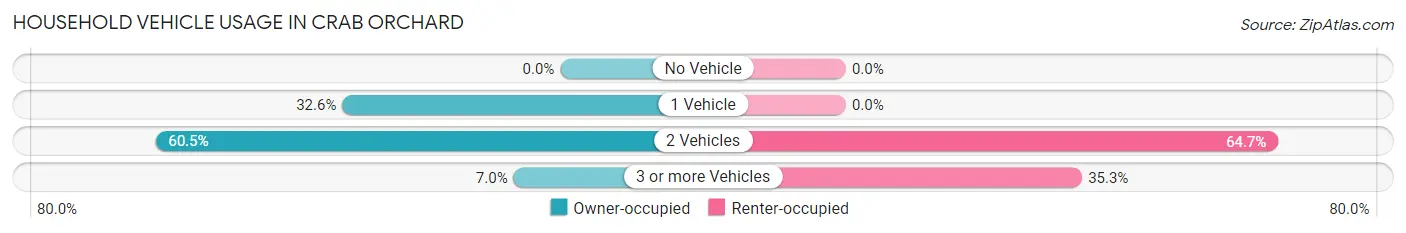
| Vehicles per Household | Owner-occupied | Renter-occupied |
| No Vehicle | 0 (0.0%) | 0 (0.0%) |
| 1 Vehicle | 28 (32.6%) | 0 (0.0%) |
| 2 Vehicles | 52 (60.5%) | 11 (64.7%) |
| 3 or more Vehicles | 6 (7.0%) | 6 (35.3%) |
| Total | 86 (100.0%) | 17 (100.0%) |
Real Estate & Mortgages in Crab Orchard
Real Estate and Mortgage Overview in Crab Orchard
| Characteristic | Without Mortgage | With Mortgage |
| Housing Units | 29 | 57 |
| Median Property Value | $48,500 | $142,700 |
| Median Household Income | - | - |
| Monthly Housing Costs | $521 | $0 |
| Real Estate Taxes | - | - |
Property Value by Mortgage Status in Crab Orchard
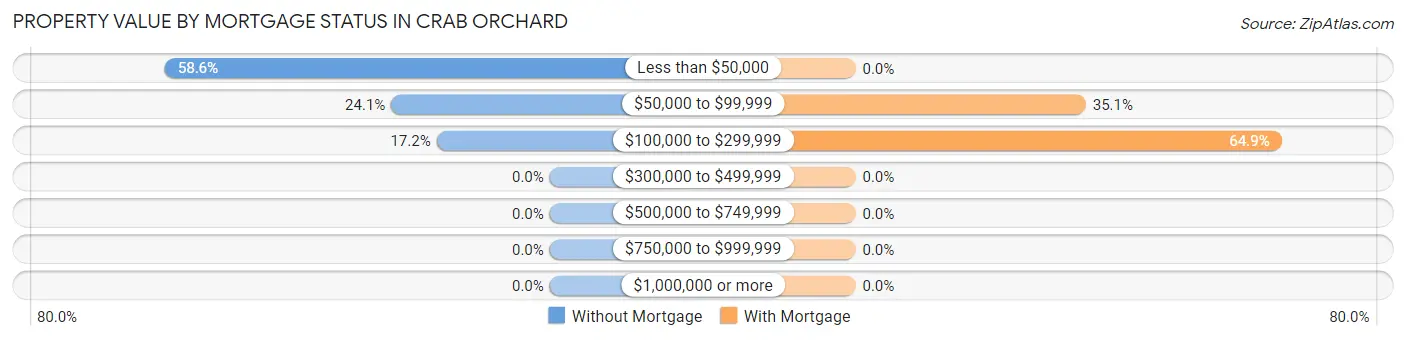
| Property Value | Without Mortgage | With Mortgage |
| Less than $50,000 | 17 (58.6%) | 0 (0.0%) |
| $50,000 to $99,999 | 7 (24.1%) | 20 (35.1%) |
| $100,000 to $299,999 | 5 (17.2%) | 37 (64.9%) |
| $300,000 to $499,999 | 0 (0.0%) | 0 (0.0%) |
| $500,000 to $749,999 | 0 (0.0%) | 0 (0.0%) |
| $750,000 to $999,999 | 0 (0.0%) | 0 (0.0%) |
| $1,000,000 or more | 0 (0.0%) | 0 (0.0%) |
| Total | 29 (100.0%) | 57 (100.0%) |
Household Income by Mortgage Status in Crab Orchard
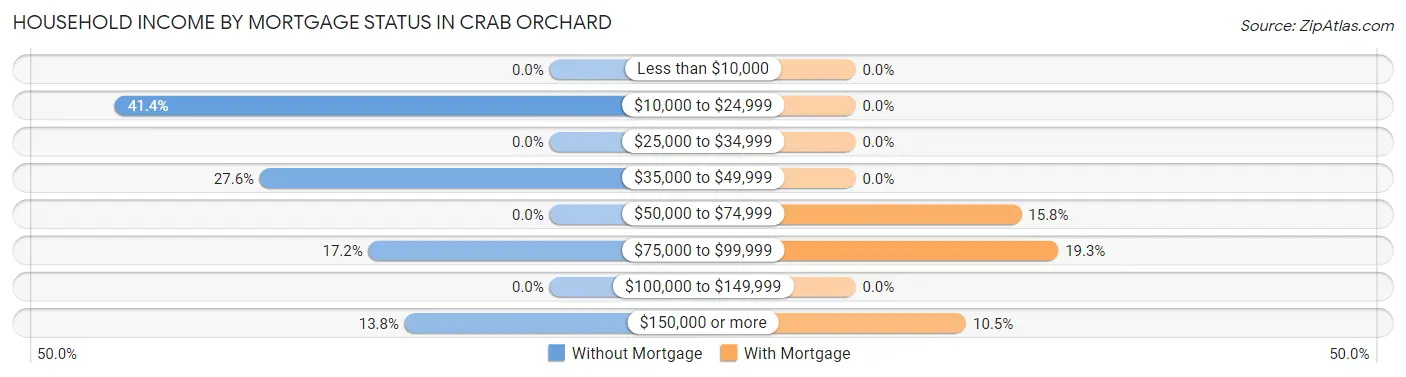
| Household Income | Without Mortgage | With Mortgage |
| Less than $10,000 | 0 (0.0%) | 0 (0.0%) |
| $10,000 to $24,999 | 12 (41.4%) | 0 (0.0%) |
| $25,000 to $34,999 | 0 (0.0%) | 0 (0.0%) |
| $35,000 to $49,999 | 8 (27.6%) | 0 (0.0%) |
| $50,000 to $74,999 | 0 (0.0%) | 9 (15.8%) |
| $75,000 to $99,999 | 5 (17.2%) | 11 (19.3%) |
| $100,000 to $149,999 | 0 (0.0%) | 0 (0.0%) |
| $150,000 or more | 4 (13.8%) | 6 (10.5%) |
| Total | 29 (100.0%) | 57 (100.0%) |
Property Value to Household Income Ratio in Crab Orchard
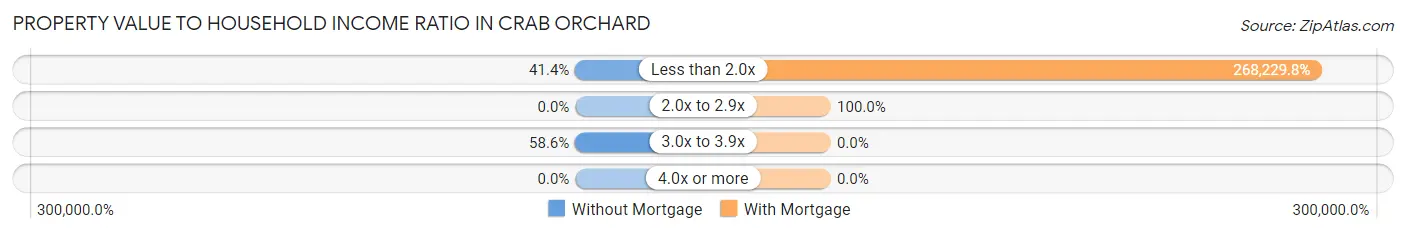
| Value-to-Income Ratio | Without Mortgage | With Mortgage |
| Less than 2.0x | 12 (41.4%) | 152,891 (268,229.8%) |
| 2.0x to 2.9x | 0 (0.0%) | 57 (100.0%) |
| 3.0x to 3.9x | 17 (58.6%) | 0 (0.0%) |
| 4.0x or more | 0 (0.0%) | 0 (0.0%) |
| Total | 29 (100.0%) | 57 (100.0%) |
Real Estate Taxes by Mortgage Status in Crab Orchard
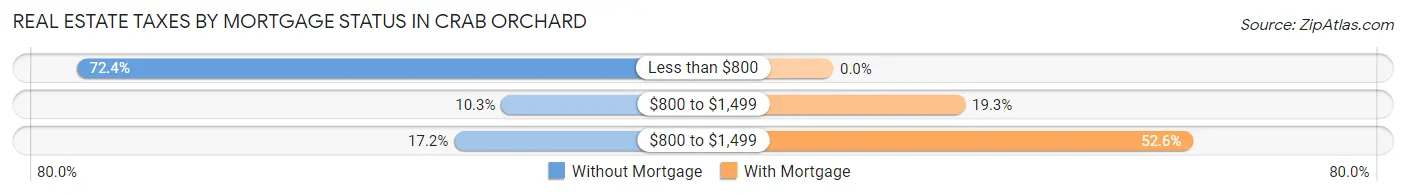
| Property Taxes | Without Mortgage | With Mortgage |
| Less than $800 | 21 (72.4%) | 0 (0.0%) |
| $800 to $1,499 | 3 (10.3%) | 11 (19.3%) |
| $800 to $1,499 | 5 (17.2%) | 30 (52.6%) |
| Total | 29 (100.0%) | 57 (100.0%) |
Health & Disability in Crab Orchard
Health Insurance Coverage by Age in Crab Orchard
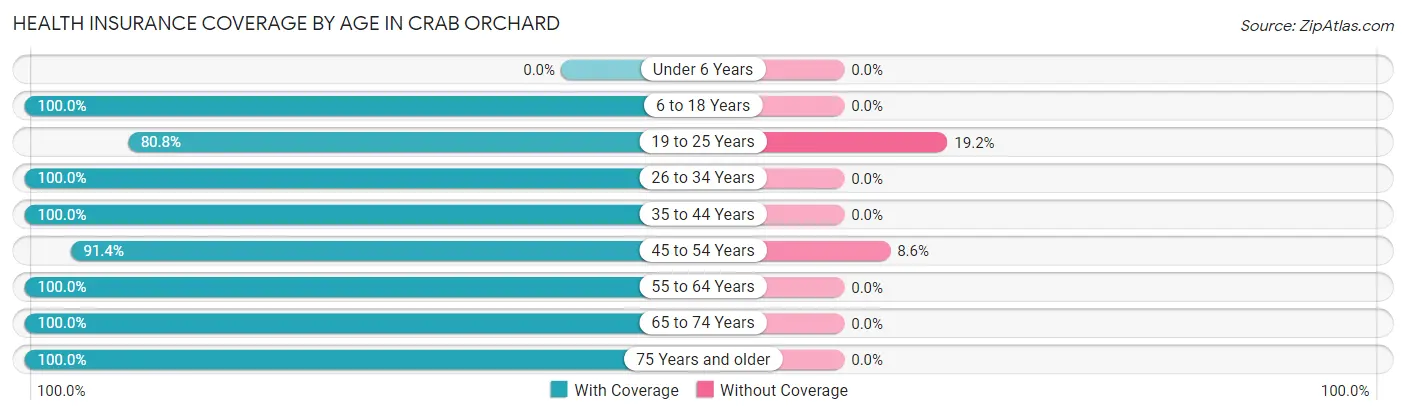
| Age Bracket | With Coverage | Without Coverage |
| Under 6 Years | 0 (0.0%) | 0 (0.0%) |
| 6 to 18 Years | 38 (100.0%) | 0 (0.0%) |
| 19 to 25 Years | 21 (80.8%) | 5 (19.2%) |
| 26 to 34 Years | 11 (100.0%) | 0 (0.0%) |
| 35 to 44 Years | 34 (100.0%) | 0 (0.0%) |
| 45 to 54 Years | 64 (91.4%) | 6 (8.6%) |
| 55 to 64 Years | 36 (100.0%) | 0 (0.0%) |
| 65 to 74 Years | 17 (100.0%) | 0 (0.0%) |
| 75 Years and older | 21 (100.0%) | 0 (0.0%) |
| Total | 242 (95.7%) | 11 (4.3%) |
Health Insurance Coverage by Citizenship Status in Crab Orchard
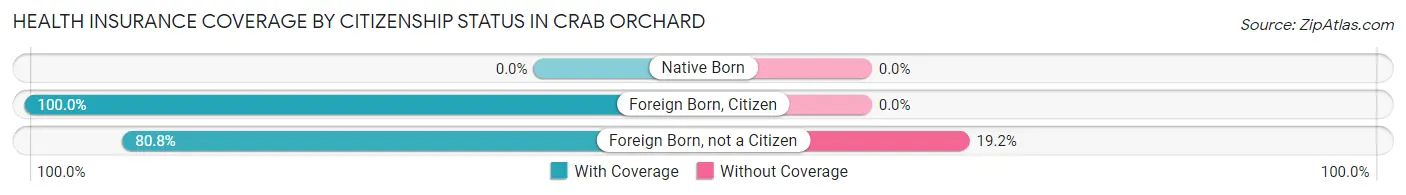
| Citizenship Status | With Coverage | Without Coverage |
| Native Born | 0 (0.0%) | 0 (0.0%) |
| Foreign Born, Citizen | 38 (100.0%) | 0 (0.0%) |
| Foreign Born, not a Citizen | 21 (80.8%) | 5 (19.2%) |
Health Insurance Coverage by Household Income in Crab Orchard
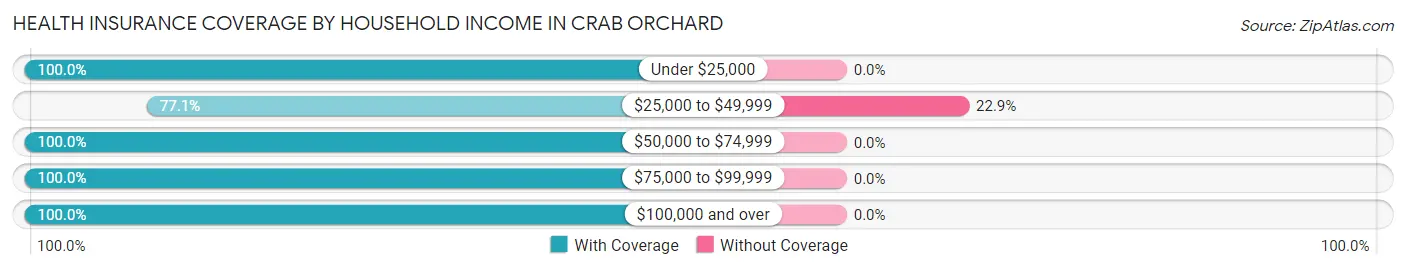
| Household Income | With Coverage | Without Coverage |
| Under $25,000 | 12 (100.0%) | 0 (0.0%) |
| $25,000 to $49,999 | 37 (77.1%) | 11 (22.9%) |
| $50,000 to $74,999 | 37 (100.0%) | 0 (0.0%) |
| $75,000 to $99,999 | 5 (100.0%) | 0 (0.0%) |
| $100,000 and over | 151 (100.0%) | 0 (0.0%) |
Public vs Private Health Insurance Coverage by Age in Crab Orchard
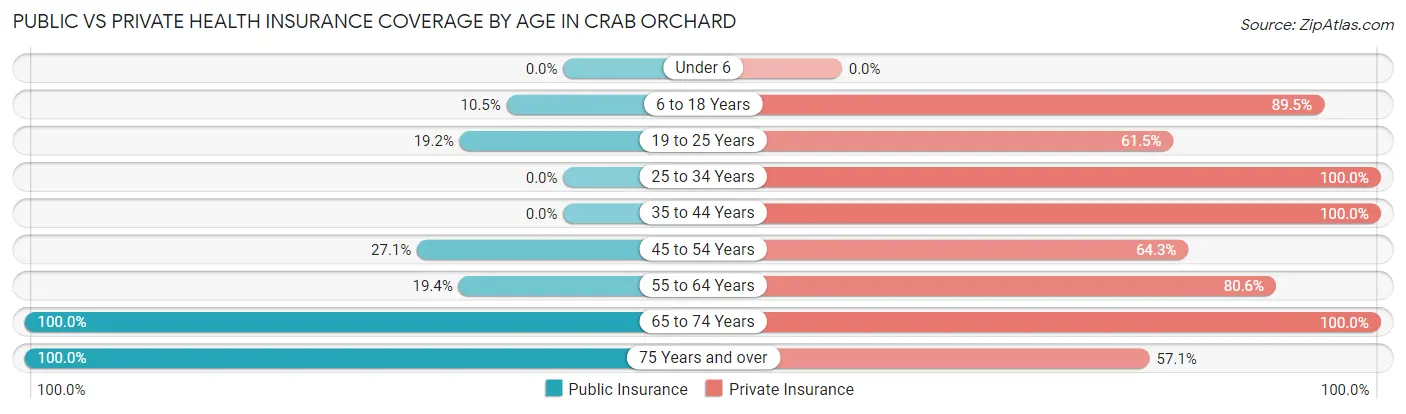
| Age Bracket | Public Insurance | Private Insurance |
| Under 6 | 0 (0.0%) | 0 (0.0%) |
| 6 to 18 Years | 4 (10.5%) | 34 (89.5%) |
| 19 to 25 Years | 5 (19.2%) | 16 (61.5%) |
| 25 to 34 Years | 0 (0.0%) | 11 (100.0%) |
| 35 to 44 Years | 0 (0.0%) | 34 (100.0%) |
| 45 to 54 Years | 19 (27.1%) | 45 (64.3%) |
| 55 to 64 Years | 7 (19.4%) | 29 (80.6%) |
| 65 to 74 Years | 17 (100.0%) | 17 (100.0%) |
| 75 Years and over | 21 (100.0%) | 12 (57.1%) |
| Total | 73 (28.8%) | 198 (78.3%) |
Disability Status by Sex by Age in Crab Orchard
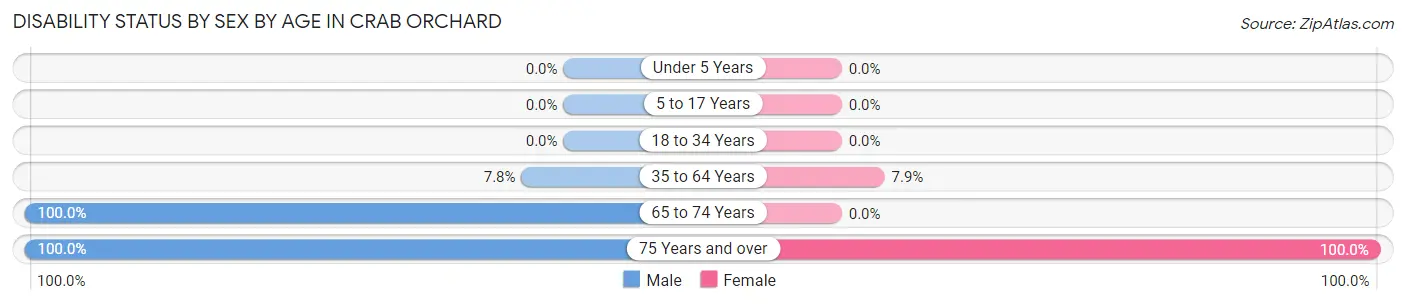
| Age Bracket | Male | Female |
| Under 5 Years | 0 (0.0%) | 0 (0.0%) |
| 5 to 17 Years | 0 (0.0%) | 0 (0.0%) |
| 18 to 34 Years | 0 (0.0%) | 0 (0.0%) |
| 35 to 64 Years | 6 (7.8%) | 5 (7.9%) |
| 65 to 74 Years | 10 (100.0%) | 0 (0.0%) |
| 75 Years and over | 9 (100.0%) | 12 (100.0%) |
Disability Class by Sex by Age in Crab Orchard
Disability Class: Hearing Difficulty
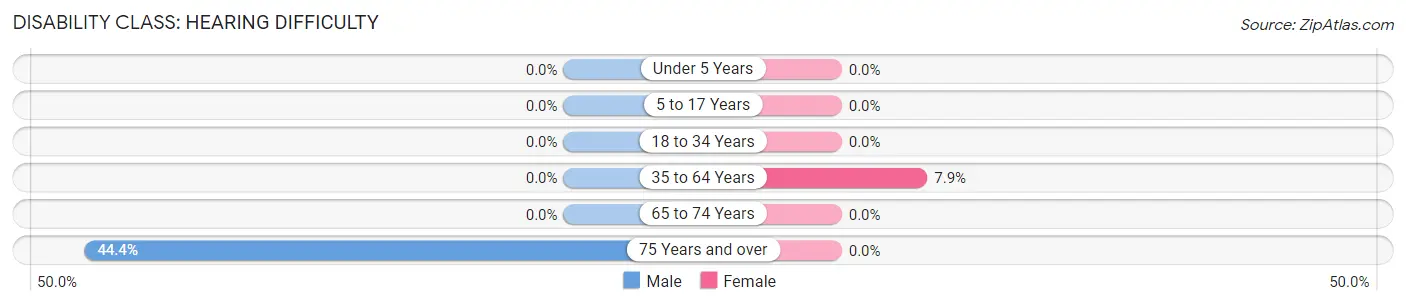
| Age Bracket | Male | Female |
| Under 5 Years | 0 (0.0%) | 0 (0.0%) |
| 5 to 17 Years | 0 (0.0%) | 0 (0.0%) |
| 18 to 34 Years | 0 (0.0%) | 0 (0.0%) |
| 35 to 64 Years | 0 (0.0%) | 5 (7.9%) |
| 65 to 74 Years | 0 (0.0%) | 0 (0.0%) |
| 75 Years and over | 4 (44.4%) | 0 (0.0%) |
Disability Class: Vision Difficulty
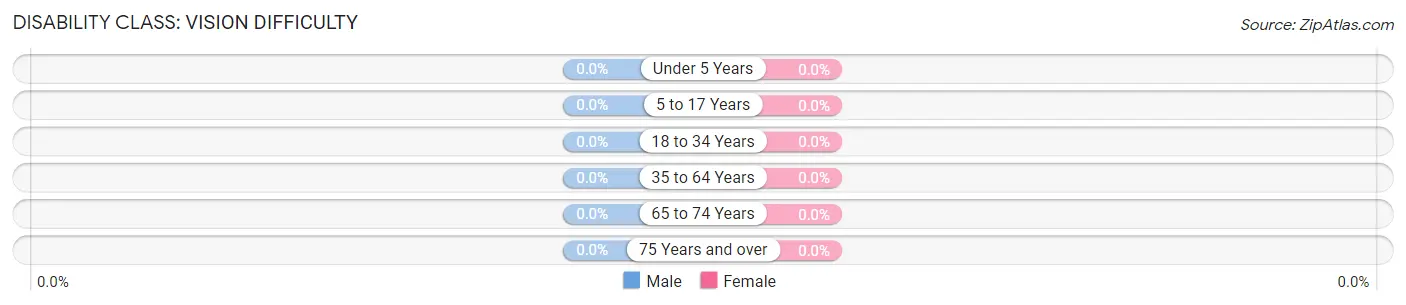
| Age Bracket | Male | Female |
| Under 5 Years | 0 (0.0%) | 0 (0.0%) |
| 5 to 17 Years | 0 (0.0%) | 0 (0.0%) |
| 18 to 34 Years | 0 (0.0%) | 0 (0.0%) |
| 35 to 64 Years | 0 (0.0%) | 0 (0.0%) |
| 65 to 74 Years | 0 (0.0%) | 0 (0.0%) |
| 75 Years and over | 0 (0.0%) | 0 (0.0%) |
Disability Class: Cognitive Difficulty
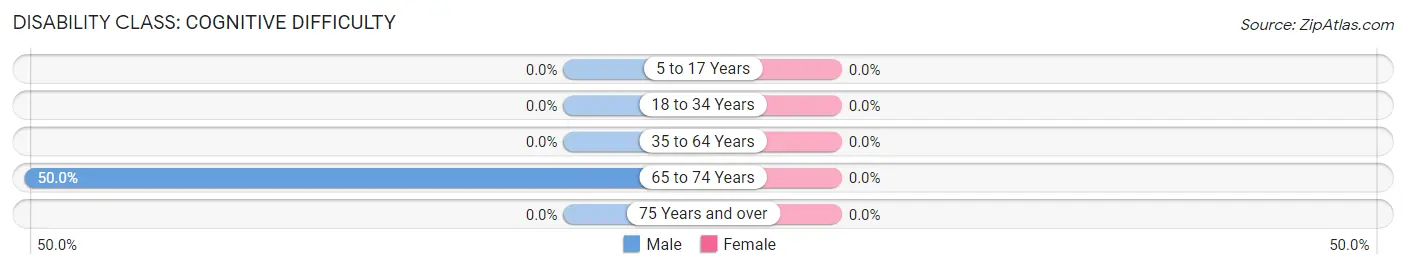
| Age Bracket | Male | Female |
| 5 to 17 Years | 0 (0.0%) | 0 (0.0%) |
| 18 to 34 Years | 0 (0.0%) | 0 (0.0%) |
| 35 to 64 Years | 0 (0.0%) | 0 (0.0%) |
| 65 to 74 Years | 5 (50.0%) | 0 (0.0%) |
| 75 Years and over | 0 (0.0%) | 0 (0.0%) |
Disability Class: Ambulatory Difficulty
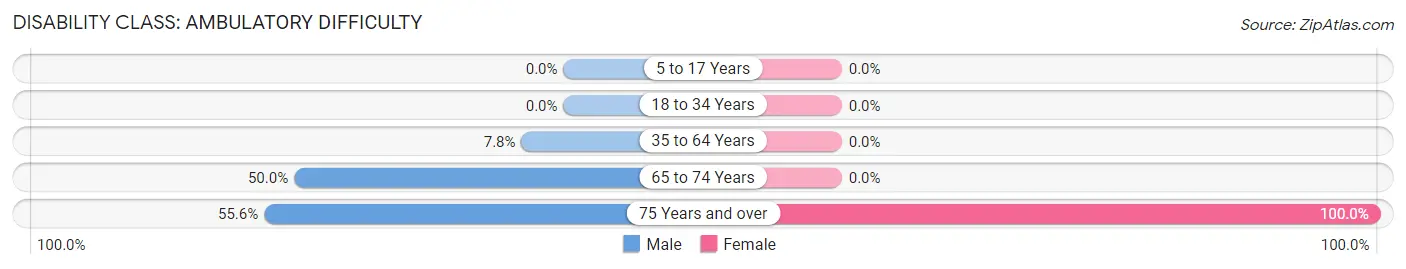
| Age Bracket | Male | Female |
| 5 to 17 Years | 0 (0.0%) | 0 (0.0%) |
| 18 to 34 Years | 0 (0.0%) | 0 (0.0%) |
| 35 to 64 Years | 6 (7.8%) | 0 (0.0%) |
| 65 to 74 Years | 5 (50.0%) | 0 (0.0%) |
| 75 Years and over | 5 (55.6%) | 12 (100.0%) |
Disability Class: Self-Care Difficulty
| Age Bracket | Male | Female |
| 5 to 17 Years | 0 (0.0%) | 0 (0.0%) |
| 18 to 34 Years | 0 (0.0%) | 0 (0.0%) |
| 35 to 64 Years | 0 (0.0%) | 0 (0.0%) |
| 65 to 74 Years | 0 (0.0%) | 0 (0.0%) |
| 75 Years and over | 0 (0.0%) | 0 (0.0%) |
Technology Access in Crab Orchard
Computing Device Access in Crab Orchard
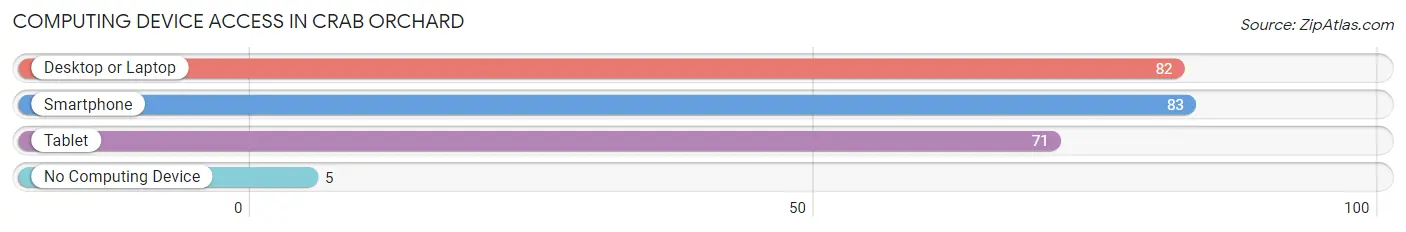
| Device Type | # Households | % Households |
| Desktop or Laptop | 82 | 79.6% |
| Smartphone | 83 | 80.6% |
| Tablet | 71 | 68.9% |
| No Computing Device | 5 | 4.9% |
| Total | 103 | 100.0% |
Internet Access in Crab Orchard
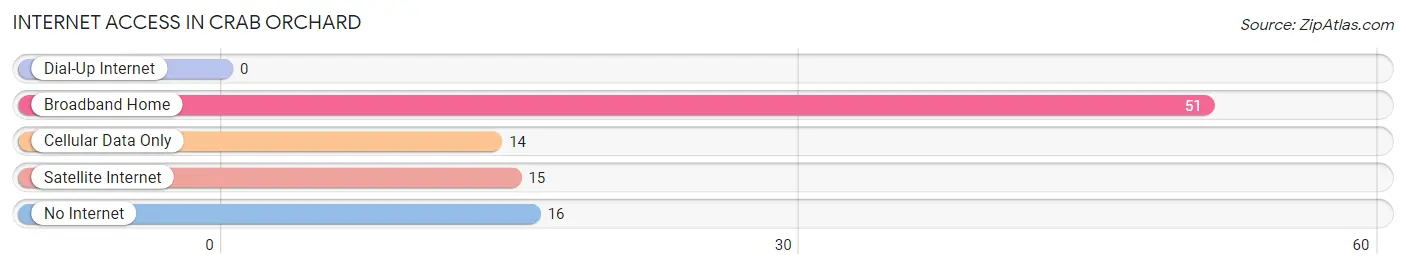
| Internet Type | # Households | % Households |
| Dial-Up Internet | 0 | 0.0% |
| Broadband Home | 51 | 49.5% |
| Cellular Data Only | 14 | 13.6% |
| Satellite Internet | 15 | 14.6% |
| No Internet | 16 | 15.5% |
| Total | 103 | 100.0% |
Crab Orchard Summary
Crab Orchard is a small unincorporated community located in Williamson County, Illinois. It is situated on the banks of the Crab Orchard Creek, a tributary of the Big Muddy River. The town is located about 10 miles south of Marion, the county seat, and about 25 miles east of Carbondale. The population of Crab Orchard was estimated to be around 1,000 in 2020.
History
Crab Orchard was first settled in the early 1800s by a group of settlers from Kentucky. The town was named after the nearby Crab Orchard Creek, which was named for the abundance of crabapple trees that grew along its banks. The town was officially incorporated in 1837.
In the late 1800s, Crab Orchard was a thriving agricultural community. The town was home to several gristmills, sawmills, and a brickyard. The town also had a post office, a general store, and a blacksmith shop.
In the early 1900s, the town began to decline as the railroad bypassed it. The population decreased and many of the businesses closed. In the 1950s, the town was revitalized when the Crab Orchard National Wildlife Refuge was established. The refuge brought in tourists and hunters, and the town began to grow again.
Geography
Crab Orchard is located in the southern part of Williamson County, Illinois. It is situated on the banks of the Crab Orchard Creek, a tributary of the Big Muddy River. The town is located about 10 miles south of Marion, the county seat, and about 25 miles east of Carbondale.
The terrain around Crab Orchard is mostly flat, with some rolling hills. The town is surrounded by farmland and woodlands. The Crab Orchard National Wildlife Refuge is located just to the east of the town.
Economy
The economy of Crab Orchard is largely based on agriculture and tourism. The town is home to several farms, which produce corn, soybeans, and other crops. The town is also home to several hunting lodges and other tourist attractions.
The Crab Orchard National Wildlife Refuge is a major tourist attraction in the area. The refuge is home to a variety of wildlife, including deer, wild turkeys, and bald eagles. The refuge also offers a variety of recreational activities, such as fishing, hunting, and bird watching.
Demographics
The population of Crab Orchard was estimated to be around 1,000 in 2020. The town is predominantly white, with a small African American population. The median household income in the town is around $45,000. The town has a low unemployment rate and a high rate of homeownership.
Common Questions
What is Per Capita Income in Crab Orchard?
Per Capita income in Crab Orchard is $38,806.
What is the Median Family Income in Crab Orchard?
Median Family Income in Crab Orchard is $138,750.
What is the Median Household income in Crab Orchard?
Median Household Income in Crab Orchard is $100,625.
What is Inequality or Gini Index in Crab Orchard?
Inequality or Gini Index in Crab Orchard is 0.35.
What is the Total Population of Crab Orchard?
Total Population of Crab Orchard is 259.
What is the Total Male Population of Crab Orchard?
Total Male Population of Crab Orchard is 136.
What is the Total Female Population of Crab Orchard?
Total Female Population of Crab Orchard is 123.
What is the Ratio of Males per 100 Females in Crab Orchard?
There are 110.57 Males per 100 Females in Crab Orchard.
What is the Ratio of Females per 100 Males in Crab Orchard?
There are 90.44 Females per 100 Males in Crab Orchard.
What is the Median Population Age in Crab Orchard?
Median Population Age in Crab Orchard is 46.1 Years.
What is the Average Family Size in Crab Orchard
Average Family Size in Crab Orchard is 2.9 People.
What is the Average Household Size in Crab Orchard
Average Household Size in Crab Orchard is 2.5 People.
How Large is the Labor Force in Crab Orchard?
There are 159 People in the Labor Forcein in Crab Orchard.
What is the Percentage of People in the Labor Force in Crab Orchard?
67.1% of People are in the Labor Force in Crab Orchard.