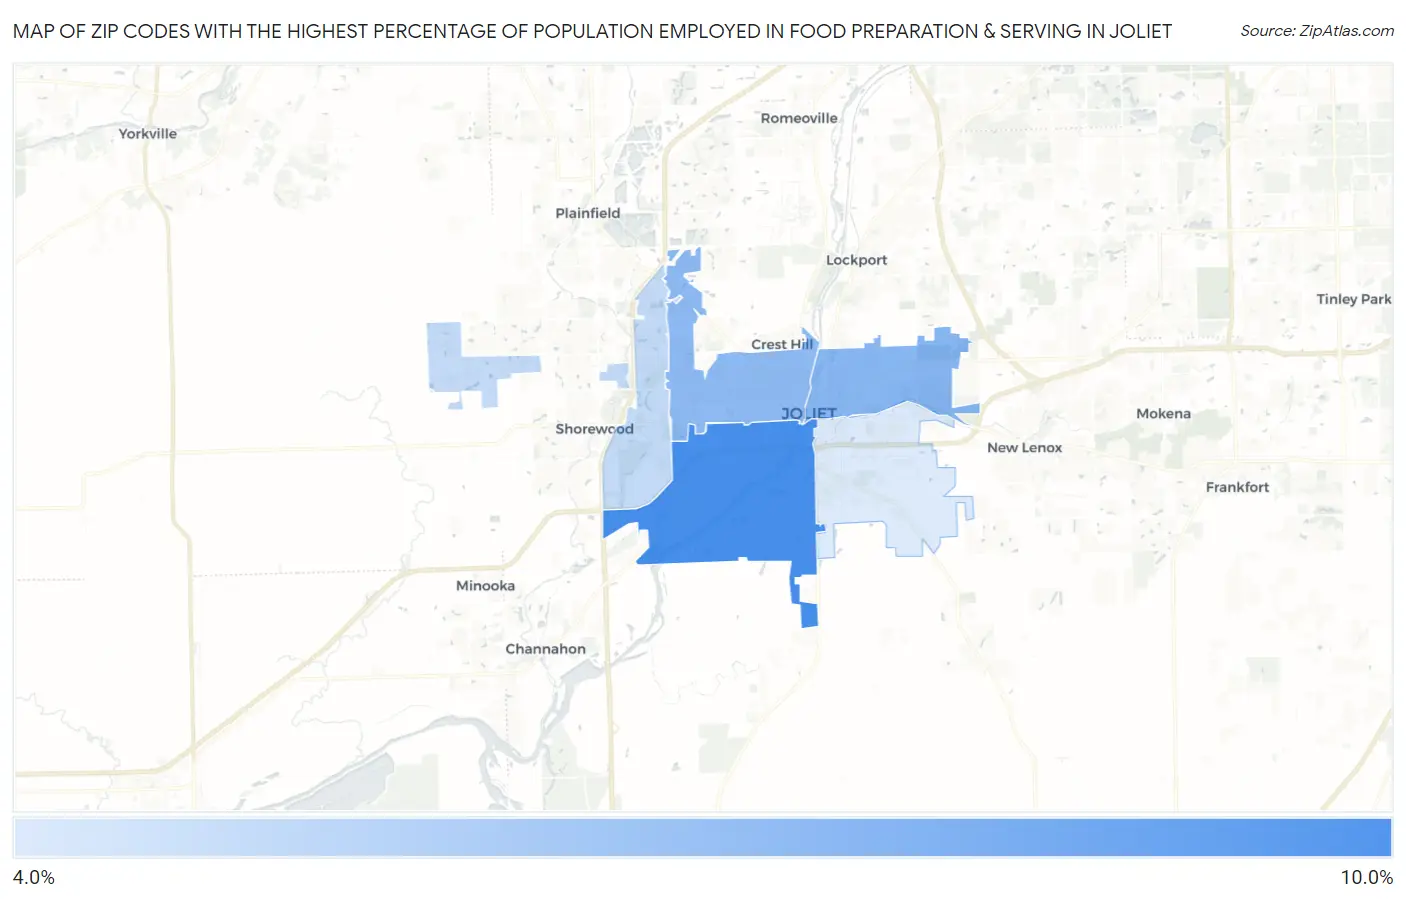
Zip Codes with the Highest Percentage of Population Employed in Food Preparation & Serving in Joliet, IL
RELATED REPORTS & OPTIONS
Food Preparation & Serving
Joliet
Compare Zip Codes
Map of Zip Codes with the Highest Percentage of Population Employed in Food Preparation & Serving in Joliet
4.2%
9.4%
Zip Codes with the Highest Percentage of Population Employed in Food Preparation & Serving in Joliet, IL
| Zip Code | % Employed | vs State | vs National | |
| 1. | 60436 | 9.4% | 5.0%(+4.35)#129 | 5.3%(+4.09)#3,154 |
| 2. | 60432 | 7.1% | 5.0%(+2.07)#254 | 5.3%(+1.82)#6,321 |
| 3. | 60435 | 6.9% | 5.0%(+1.82)#289 | 5.3%(+1.57)#6,931 |
| 4. | 60431 | 5.0% | 5.0%(-0.044)#558 | 5.3%(-0.296)#12,998 |
| 5. | 60433 | 4.2% | 5.0%(-0.874)#700 | 5.3%(-1.13)#16,466 |
1
Common Questions
What are the Top 3 Zip Codes with the Highest Percentage of Population Employed in Food Preparation & Serving in Joliet, IL?
Top 3 Zip Codes with the Highest Percentage of Population Employed in Food Preparation & Serving in Joliet, IL are:
What zip code has the Highest Percentage of Population Employed in Food Preparation & Serving in Joliet, IL?
60436 has the Highest Percentage of Population Employed in Food Preparation & Serving in Joliet, IL with 9.4%.
What is the Percentage of Population Employed in Food Preparation & Serving in Joliet, IL?
Percentage of Population Employed in Food Preparation & Serving in Joliet is 5.9%.
What is the Percentage of Population Employed in Food Preparation & Serving in Illinois?
Percentage of Population Employed in Food Preparation & Serving in Illinois is 5.0%.
What is the Percentage of Population Employed in Food Preparation & Serving in the United States?
Percentage of Population Employed in Food Preparation & Serving in the United States is 5.3%.