Cities with the Highest Percentage of Croatian Population in Illinois
RELATED REPORTS & OPTIONS
Croatian
Illinois
Compare Cities
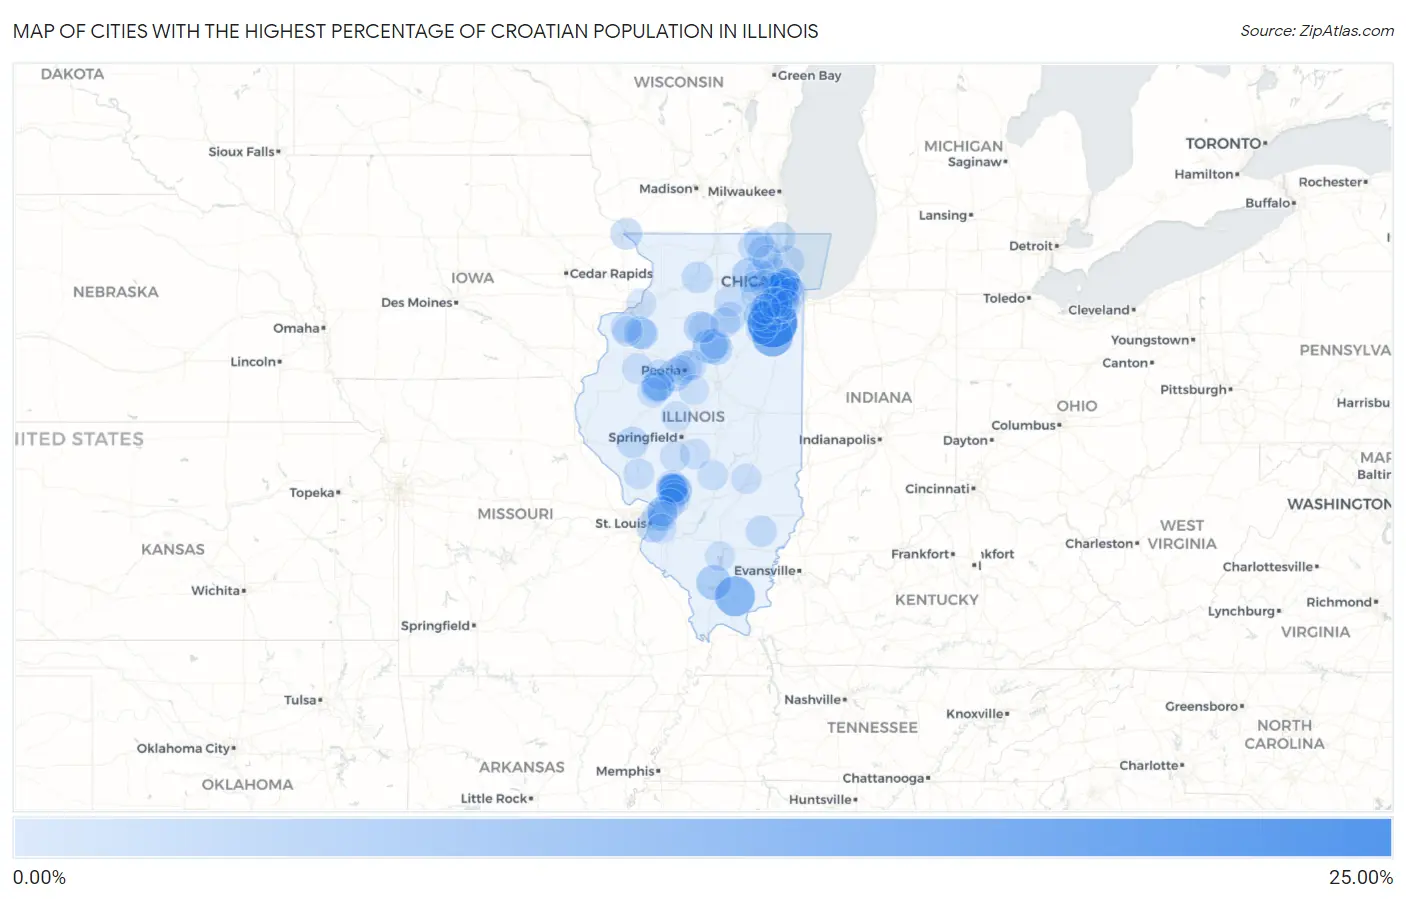
Map of Cities with the Highest Percentage of Croatian Population in Illinois
0.00%
25.00%
Cities with the Highest Percentage of Croatian Population in Illinois
| City | Croatian | vs State | vs National | |
| 1. | Symerton | 23.29% | 0.29%(+23.0)#1 | 0.12%(+23.2)#3 |
| 2. | Bonfield | 12.71% | 0.29%(+12.4)#2 | 0.12%(+12.6)#10 |
| 3. | Stonefort | 11.87% | 0.29%(+11.6)#3 | 0.12%(+11.7)#12 |
| 4. | Mccook | 9.03% | 0.29%(+8.74)#4 | 0.12%(+8.91)#23 |
| 5. | Colp | 5.98% | 0.29%(+5.69)#5 | 0.12%(+5.86)#56 |
| 6. | Toluca | 5.70% | 0.29%(+5.41)#6 | 0.12%(+5.58)#63 |
| 7. | Lily Lake | 4.82% | 0.29%(+4.53)#7 | 0.12%(+4.70)#78 |
| 8. | Indian Head Park | 4.67% | 0.29%(+4.38)#8 | 0.12%(+4.55)#83 |
| 9. | Ritchie | 3.90% | 0.29%(+3.60)#9 | 0.12%(+3.78)#116 |
| 10. | Lake Camelot | 3.83% | 0.29%(+3.54)#10 | 0.12%(+3.71)#118 |
| 11. | Hennepin | 3.66% | 0.29%(+3.36)#11 | 0.12%(+3.53)#133 |
| 12. | Rutland | 3.41% | 0.29%(+3.12)#12 | 0.12%(+3.29)#143 |
| 13. | St David | 3.33% | 0.29%(+3.04)#13 | 0.12%(+3.21)#154 |
| 14. | Sauget | 3.33% | 0.29%(+3.04)#14 | 0.12%(+3.21)#155 |
| 15. | Alpha | 3.16% | 0.29%(+2.86)#15 | 0.12%(+3.04)#173 |
| 16. | East Gillespie | 3.11% | 0.29%(+2.82)#16 | 0.12%(+2.99)#178 |
| 17. | White City | 3.10% | 0.29%(+2.80)#17 | 0.12%(+2.98)#179 |
| 18. | Port Barrington | 3.02% | 0.29%(+2.73)#18 | 0.12%(+2.90)#187 |
| 19. | Mount Olive | 2.89% | 0.29%(+2.60)#19 | 0.12%(+2.77)#203 |
| 20. | Exeter | 2.61% | 0.29%(+2.32)#20 | 0.12%(+2.49)#228 |
| 21. | East Dubuque | 2.57% | 0.29%(+2.28)#21 | 0.12%(+2.45)#231 |
| 22. | Burr Ridge | 2.41% | 0.29%(+2.11)#22 | 0.12%(+2.29)#256 |
| 23. | Rockdale | 2.33% | 0.29%(+2.04)#23 | 0.12%(+2.21)#268 |
| 24. | Countryside | 2.31% | 0.29%(+2.02)#24 | 0.12%(+2.19)#273 |
| 25. | Elwood | 2.29% | 0.29%(+2.00)#25 | 0.12%(+2.17)#277 |
| 26. | Itasca | 2.27% | 0.29%(+1.98)#26 | 0.12%(+2.15)#281 |
| 27. | Glencoe | 2.26% | 0.29%(+1.97)#27 | 0.12%(+2.14)#284 |
| 28. | Manhattan | 2.26% | 0.29%(+1.97)#28 | 0.12%(+2.14)#285 |
| 29. | Mount Erie | 2.22% | 0.29%(+1.93)#29 | 0.12%(+2.10)#293 |
| 30. | Lost Nation | 2.20% | 0.29%(+1.90)#30 | 0.12%(+2.08)#296 |
| 31. | Sunnyland | 2.15% | 0.29%(+1.86)#31 | 0.12%(+2.03)#303 |
| 32. | Riverside | 2.11% | 0.29%(+1.82)#32 | 0.12%(+1.99)#307 |
| 33. | Dunfermline | 2.08% | 0.29%(+1.79)#33 | 0.12%(+1.96)#315 |
| 34. | Woodhull | 2.08% | 0.29%(+1.78)#34 | 0.12%(+1.95)#317 |
| 35. | Dayton | 2.01% | 0.29%(+1.72)#35 | 0.12%(+1.89)#328 |
| 36. | Peoria Heights | 1.97% | 0.29%(+1.68)#36 | 0.12%(+1.85)#334 |
| 37. | Benld | 1.96% | 0.29%(+1.67)#37 | 0.12%(+1.84)#337 |
| 38. | Norris | 1.93% | 0.29%(+1.64)#38 | 0.12%(+1.81)#349 |
| 39. | Glen Carbon | 1.81% | 0.29%(+1.52)#39 | 0.12%(+1.69)#390 |
| 40. | Bryant | 1.78% | 0.29%(+1.48)#40 | 0.12%(+1.66)#406 |
| 41. | Matherville | 1.76% | 0.29%(+1.47)#41 | 0.12%(+1.64)#410 |
| 42. | Wadsworth | 1.74% | 0.29%(+1.45)#42 | 0.12%(+1.62)#420 |
| 43. | Leland | 1.73% | 0.29%(+1.44)#43 | 0.12%(+1.61)#424 |
| 44. | Bull Valley | 1.68% | 0.29%(+1.39)#44 | 0.12%(+1.56)#439 |
| 45. | Carrollton | 1.65% | 0.29%(+1.36)#45 | 0.12%(+1.53)#452 |
| 46. | Willow Springs | 1.64% | 0.29%(+1.34)#46 | 0.12%(+1.52)#456 |
| 47. | Wenona | 1.62% | 0.29%(+1.33)#47 | 0.12%(+1.50)#459 |
| 48. | St Augustine | 1.60% | 0.29%(+1.31)#48 | 0.12%(+1.48)#465 |
| 49. | Justice | 1.52% | 0.29%(+1.23)#49 | 0.12%(+1.40)#497 |
| 50. | Sawyerville | 1.51% | 0.29%(+1.21)#50 | 0.12%(+1.39)#502 |
| 51. | Mount Clare | 1.47% | 0.29%(+1.17)#51 | 0.12%(+1.35)#522 |
| 52. | Staunton | 1.46% | 0.29%(+1.17)#52 | 0.12%(+1.34)#524 |
| 53. | Godley | 1.45% | 0.29%(+1.16)#53 | 0.12%(+1.33)#527 |
| 54. | Livingston | 1.43% | 0.29%(+1.14)#54 | 0.12%(+1.31)#540 |
| 55. | Germantown Hills | 1.43% | 0.29%(+1.13)#55 | 0.12%(+1.31)#542 |
| 56. | Pontoon Beach | 1.37% | 0.29%(+1.08)#56 | 0.12%(+1.25)#563 |
| 57. | Mark | 1.32% | 0.29%(+1.03)#57 | 0.12%(+1.20)#592 |
| 58. | Sigel | 1.28% | 0.29%(+0.986)#58 | 0.12%(+1.16)#613 |
| 59. | Western Springs | 1.23% | 0.29%(+0.939)#59 | 0.12%(+1.11)#636 |
| 60. | Minooka | 1.22% | 0.29%(+0.929)#60 | 0.12%(+1.10)#643 |
| 61. | Viola | 1.16% | 0.29%(+0.869)#61 | 0.12%(+1.04)#683 |
| 62. | Downers Grove | 1.13% | 0.29%(+0.833)#62 | 0.12%(+1.01)#711 |
| 63. | North Riverside | 1.12% | 0.29%(+0.825)#63 | 0.12%(+0.997)#723 |
| 64. | Oconee | 1.12% | 0.29%(+0.824)#64 | 0.12%(+0.997)#725 |
| 65. | Crest Hill | 1.12% | 0.29%(+0.824)#65 | 0.12%(+0.996)#726 |
| 66. | Palos Hills | 1.12% | 0.29%(+0.823)#66 | 0.12%(+0.995)#727 |
| 67. | Jeisyville | 1.09% | 0.29%(+0.794)#67 | 0.12%(+0.966)#752 |
| 68. | Orland Park | 1.07% | 0.29%(+0.775)#68 | 0.12%(+0.947)#770 |
| 69. | Greenview | 1.05% | 0.29%(+0.756)#69 | 0.12%(+0.929)#790 |
| 70. | Wayne | 1.03% | 0.29%(+0.741)#70 | 0.12%(+0.913)#799 |
| 71. | Mokena | 1.02% | 0.29%(+0.728)#71 | 0.12%(+0.900)#811 |
| 72. | Rest Haven | 1.00% | 0.29%(+0.709)#72 | 0.12%(+0.881)#824 |
| 73. | Eagarville | 0.98% | 0.29%(+0.688)#73 | 0.12%(+0.860)#845 |
| 74. | Brookfield | 0.97% | 0.29%(+0.674)#74 | 0.12%(+0.846)#857 |
| 75. | North Aurora | 0.96% | 0.29%(+0.671)#75 | 0.12%(+0.843)#860 |
| 76. | New Lenox | 0.95% | 0.29%(+0.662)#76 | 0.12%(+0.834)#864 |
| 77. | Hamel | 0.95% | 0.29%(+0.657)#77 | 0.12%(+0.829)#871 |
| 78. | West Peoria | 0.94% | 0.29%(+0.649)#78 | 0.12%(+0.821)#878 |
| 79. | Wilmington | 0.92% | 0.29%(+0.630)#79 | 0.12%(+0.802)#894 |
| 80. | Oswego | 0.92% | 0.29%(+0.626)#80 | 0.12%(+0.799)#899 |
| 81. | Barrington | 0.92% | 0.29%(+0.623)#81 | 0.12%(+0.795)#902 |
| 82. | Rapids City | 0.91% | 0.29%(+0.622)#82 | 0.12%(+0.794)#903 |
| 83. | Thayer | 0.90% | 0.29%(+0.611)#83 | 0.12%(+0.784)#913 |
| 84. | Westlake | 0.90% | 0.29%(+0.606)#84 | 0.12%(+0.778)#917 |
| 85. | Westmont | 0.89% | 0.29%(+0.593)#85 | 0.12%(+0.765)#924 |
| 86. | Lewistown | 0.88% | 0.29%(+0.584)#86 | 0.12%(+0.757)#933 |
| 87. | Homer Glen | 0.87% | 0.29%(+0.572)#87 | 0.12%(+0.744)#946 |
| 88. | Maryville | 0.86% | 0.29%(+0.571)#88 | 0.12%(+0.743)#949 |
| 89. | Channahon | 0.85% | 0.29%(+0.562)#89 | 0.12%(+0.734)#960 |
| 90. | Evergreen Park | 0.85% | 0.29%(+0.559)#90 | 0.12%(+0.731)#965 |
| 91. | Edwardsville | 0.85% | 0.29%(+0.552)#91 | 0.12%(+0.725)#976 |
| 92. | Naplate | 0.84% | 0.29%(+0.546)#92 | 0.12%(+0.718)#982 |
| 93. | Mccullom Lake | 0.84% | 0.29%(+0.545)#93 | 0.12%(+0.717)#985 |
| 94. | Warrenville | 0.83% | 0.29%(+0.539)#94 | 0.12%(+0.711)#991 |
| 95. | Lockport | 0.83% | 0.29%(+0.534)#95 | 0.12%(+0.706)#995 |
| 96. | Tinley Park | 0.81% | 0.29%(+0.521)#96 | 0.12%(+0.693)#1,014 |
| 97. | Nason | 0.81% | 0.29%(+0.520)#97 | 0.12%(+0.692)#1,016 |
| 98. | Swansea | 0.81% | 0.29%(+0.513)#98 | 0.12%(+0.685)#1,023 |
| 99. | Joliet | 0.80% | 0.29%(+0.511)#99 | 0.12%(+0.684)#1,026 |
| 100. | Hopedale | 0.80% | 0.29%(+0.510)#100 | 0.12%(+0.683)#1,028 |
Common Questions
What are the Top 10 Cities with the Highest Percentage of Croatian Population in Illinois?
Top 10 Cities with the Highest Percentage of Croatian Population in Illinois are:
#1
23.29%
#2
12.71%
#3
11.87%
#4
9.03%
#5
5.98%
#6
5.70%
#7
4.82%
#8
4.67%
#9
3.83%
#10
3.66%
What city has the Highest Percentage of Croatian Population in Illinois?
Symerton has the Highest Percentage of Croatian Population in Illinois with 23.29%.
What is the Percentage of Croatian Population in the State of Illinois?
Percentage of Croatian Population in Illinois is 0.29%.
What is the Percentage of Croatian Population in the United States?
Percentage of Croatian Population in the United States is 0.12%.