Cities with the Largest Hispanic or Latino Community in Illinois
RELATED REPORTS & OPTIONS
Hispanic or Latino
Illinois
Compare Cities
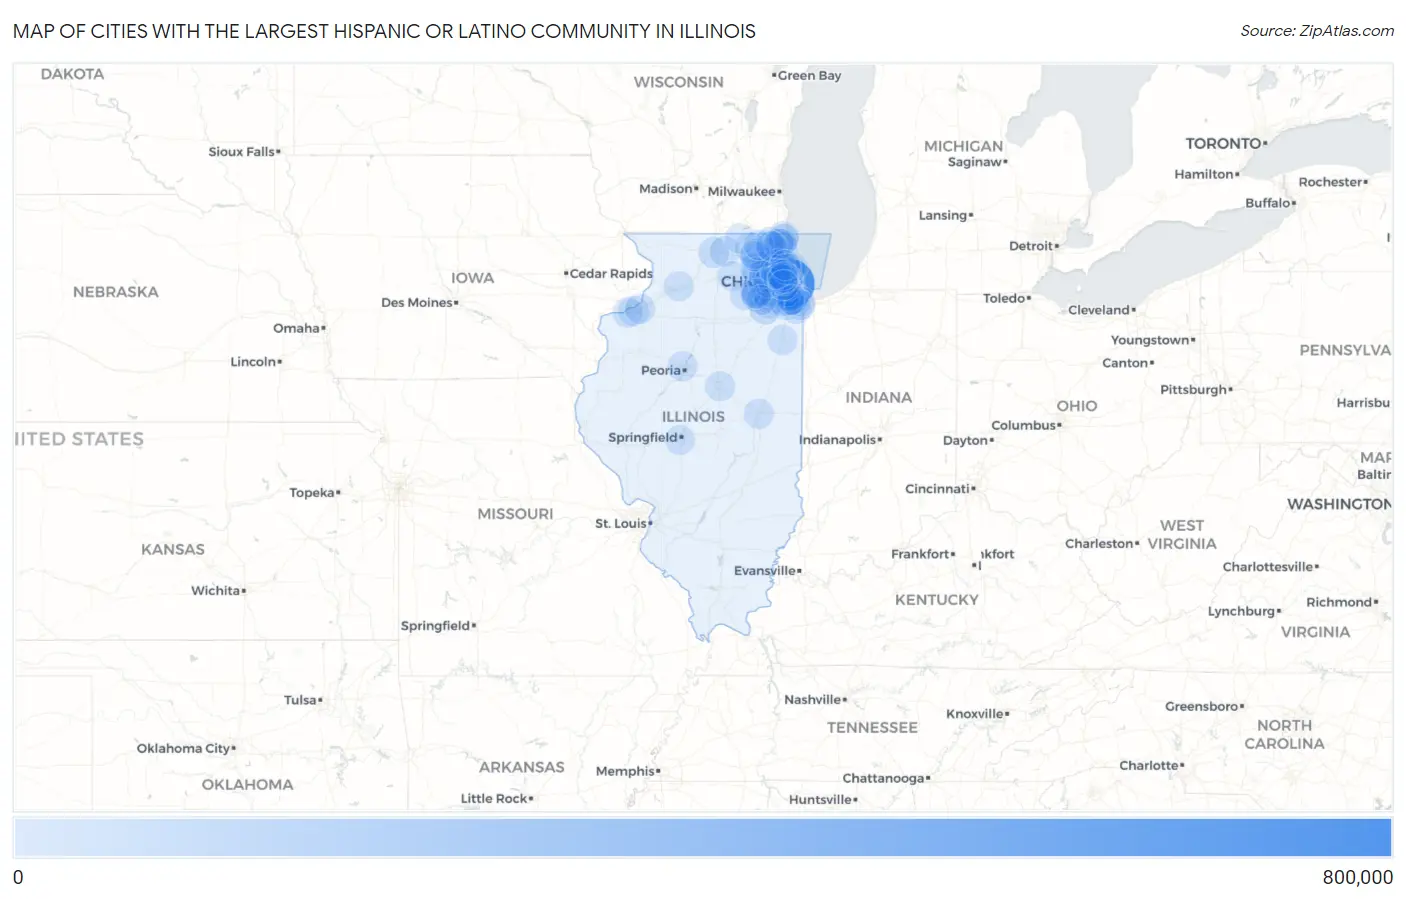
Map of Cities with the Largest Hispanic or Latino Community in Illinois
0
800,000
Cities with the Largest Hispanic or Latino Community in Illinois
| City | Hispanic or Latino | vs State | vs National | |
| 1. | Chicago | 788,106 | 2,275,704(34.63%)#1 | 61,755,866(1.28%)#5 |
| 2. | Aurora | 76,816 | 2,275,704(3.38%)#2 | 61,755,866(0.12%)#85 |
| 3. | Cicero | 73,974 | 2,275,704(3.25%)#3 | 61,755,866(0.12%)#93 |
| 4. | Elgin | 54,061 | 2,275,704(2.38%)#4 | 61,755,866(0.09%)#145 |
| 5. | Joliet | 50,388 | 2,275,704(2.21%)#5 | 61,755,866(0.08%)#160 |
| 6. | Waukegan | 47,070 | 2,275,704(2.07%)#6 | 61,755,866(0.08%)#177 |
| 7. | Berwyn | 34,510 | 2,275,704(1.52%)#7 | 61,755,866(0.06%)#262 |
| 8. | Rockford | 28,264 | 2,275,704(1.24%)#8 | 61,755,866(0.05%)#325 |
| 9. | Carpentersville | 20,571 | 2,275,704(0.90%)#9 | 61,755,866(0.03%)#453 |
| 10. | Bolingbrook | 20,044 | 2,275,704(0.88%)#10 | 61,755,866(0.03%)#469 |
| 11. | Melrose Park | 19,882 | 2,275,704(0.87%)#11 | 61,755,866(0.03%)#472 |
| 12. | Addison | 14,592 | 2,275,704(0.64%)#12 | 61,755,866(0.02%)#634 |
| 13. | Streamwood | 14,341 | 2,275,704(0.63%)#13 | 61,755,866(0.02%)#647 |
| 14. | Hanover Park | 14,338 | 2,275,704(0.63%)#14 | 61,755,866(0.02%)#648 |
| 15. | Round Lake Beach | 14,315 | 2,275,704(0.63%)#15 | 61,755,866(0.02%)#649 |
| 16. | Romeoville | 14,127 | 2,275,704(0.62%)#16 | 61,755,866(0.02%)#658 |
| 17. | Burbank | 13,840 | 2,275,704(0.61%)#17 | 61,755,866(0.02%)#676 |
| 18. | Palatine | 13,250 | 2,275,704(0.58%)#18 | 61,755,866(0.02%)#705 |
| 19. | Des Plaines | 12,449 | 2,275,704(0.55%)#19 | 61,755,866(0.02%)#735 |
| 20. | West Chicago | 12,428 | 2,275,704(0.55%)#20 | 61,755,866(0.02%)#739 |
| 21. | Wheeling | 12,358 | 2,275,704(0.54%)#21 | 61,755,866(0.02%)#743 |
| 22. | Oak Lawn | 12,013 | 2,275,704(0.53%)#22 | 61,755,866(0.02%)#761 |
| 23. | North Chicago | 11,095 | 2,275,704(0.49%)#23 | 61,755,866(0.02%)#825 |
| 24. | Glendale Heights | 11,023 | 2,275,704(0.48%)#24 | 61,755,866(0.02%)#831 |
| 25. | Franklin Park | 10,706 | 2,275,704(0.47%)#25 | 61,755,866(0.02%)#854 |
| 26. | Mundelein | 10,539 | 2,275,704(0.46%)#26 | 61,755,866(0.02%)#866 |
| 27. | Blue Island | 10,266 | 2,275,704(0.45%)#27 | 61,755,866(0.02%)#888 |
| 28. | Naperville | 10,264 | 2,275,704(0.45%)#28 | 61,755,866(0.02%)#889 |
| 29. | Chicago Heights | 10,020 | 2,275,704(0.44%)#29 | 61,755,866(0.02%)#906 |
| 30. | Zion | 9,990 | 2,275,704(0.44%)#30 | 61,755,866(0.02%)#911 |
| 31. | Belvidere | 9,391 | 2,275,704(0.41%)#31 | 61,755,866(0.02%)#971 |
| 32. | Hoffman Estates | 9,327 | 2,275,704(0.41%)#32 | 61,755,866(0.02%)#977 |
| 33. | Schaumburg | 9,052 | 2,275,704(0.40%)#33 | 61,755,866(0.01%)#999 |
| 34. | Mount Prospect | 8,962 | 2,275,704(0.39%)#34 | 61,755,866(0.01%)#1,010 |
| 35. | Bensenville | 8,772 | 2,275,704(0.39%)#35 | 61,755,866(0.01%)#1,031 |
| 36. | Evanston | 8,713 | 2,275,704(0.38%)#36 | 61,755,866(0.01%)#1,037 |
| 37. | Elmwood Park | 8,367 | 2,275,704(0.37%)#37 | 61,755,866(0.01%)#1,074 |
| 38. | Summit | 8,156 | 2,275,704(0.36%)#38 | 61,755,866(0.01%)#1,091 |
| 39. | Peoria | 8,013 | 2,275,704(0.35%)#39 | 61,755,866(0.01%)#1,106 |
| 40. | Northlake | 7,712 | 2,275,704(0.34%)#40 | 61,755,866(0.01%)#1,147 |
| 41. | Skokie | 7,413 | 2,275,704(0.33%)#41 | 61,755,866(0.01%)#1,172 |
| 42. | Moline | 7,368 | 2,275,704(0.32%)#42 | 61,755,866(0.01%)#1,176 |
| 43. | Maywood | 7,130 | 2,275,704(0.31%)#43 | 61,755,866(0.01%)#1,203 |
| 44. | Arlington Heights | 6,807 | 2,275,704(0.30%)#44 | 61,755,866(0.01%)#1,246 |
| 45. | Montgomery | 6,664 | 2,275,704(0.29%)#45 | 61,755,866(0.01%)#1,263 |
| 46. | Dekalb | 6,559 | 2,275,704(0.29%)#46 | 61,755,866(0.01%)#1,276 |
| 47. | Tinley Park | 6,544 | 2,275,704(0.29%)#47 | 61,755,866(0.01%)#1,279 |
| 48. | Harvey | 6,544 | 2,275,704(0.29%)#48 | 61,755,866(0.01%)#1,280 |
| 49. | Beach Park | 6,486 | 2,275,704(0.29%)#49 | 61,755,866(0.01%)#1,287 |
| 50. | Carol Stream | 6,456 | 2,275,704(0.28%)#50 | 61,755,866(0.01%)#1,291 |
| 51. | Rolling Meadows | 6,413 | 2,275,704(0.28%)#51 | 61,755,866(0.01%)#1,299 |
| 52. | Calumet City | 6,113 | 2,275,704(0.27%)#52 | 61,755,866(0.01%)#1,346 |
| 53. | Oswego | 6,106 | 2,275,704(0.27%)#53 | 61,755,866(0.01%)#1,348 |
| 54. | Bartlett | 6,105 | 2,275,704(0.27%)#54 | 61,755,866(0.01%)#1,349 |
| 55. | Woodstock | 5,861 | 2,275,704(0.26%)#55 | 61,755,866(0.01%)#1,391 |
| 56. | Lyons | 5,849 | 2,275,704(0.26%)#56 | 61,755,866(0.01%)#1,398 |
| 57. | Park City | 5,752 | 2,275,704(0.25%)#57 | 61,755,866(0.01%)#1,418 |
| 58. | South Elgin | 5,653 | 2,275,704(0.25%)#58 | 61,755,866(0.01%)#1,434 |
| 59. | Orland Park | 5,635 | 2,275,704(0.25%)#59 | 61,755,866(0.01%)#1,436 |
| 60. | Villa Park | 5,628 | 2,275,704(0.25%)#60 | 61,755,866(0.01%)#1,439 |
| 61. | Round Lake | 5,622 | 2,275,704(0.25%)#61 | 61,755,866(0.01%)#1,442 |
| 62. | Lansing | 5,562 | 2,275,704(0.24%)#62 | 61,755,866(0.01%)#1,451 |
| 63. | Champaign | 5,498 | 2,275,704(0.24%)#63 | 61,755,866(0.01%)#1,461 |
| 64. | Bridgeview | 5,422 | 2,275,704(0.24%)#64 | 61,755,866(0.01%)#1,476 |
| 65. | Woodridge | 5,343 | 2,275,704(0.23%)#65 | 61,755,866(0.01%)#1,486 |
| 66. | Harvard | 5,191 | 2,275,704(0.23%)#66 | 61,755,866(0.01%)#1,521 |
| 67. | Kankakee | 5,134 | 2,275,704(0.23%)#67 | 61,755,866(0.01%)#1,532 |
| 68. | Rock Island | 5,078 | 2,275,704(0.22%)#68 | 61,755,866(0.01%)#1,543 |
| 69. | Prospect Heights | 5,041 | 2,275,704(0.22%)#69 | 61,755,866(0.01%)#1,552 |
| 70. | Stickney | 5,005 | 2,275,704(0.22%)#70 | 61,755,866(0.01%)#1,562 |
| 71. | Oak Park | 4,990 | 2,275,704(0.22%)#71 | 61,755,866(0.01%)#1,567 |
| 72. | Alsip | 4,875 | 2,275,704(0.21%)#72 | 61,755,866(0.01%)#1,591 |
| 73. | Midlothian | 4,808 | 2,275,704(0.21%)#73 | 61,755,866(0.01%)#1,613 |
| 74. | Bloomington | 4,800 | 2,275,704(0.21%)#74 | 61,755,866(0.01%)#1,614 |
| 75. | Lombard | 4,698 | 2,275,704(0.21%)#75 | 61,755,866(0.01%)#1,638 |
| 76. | Crystal Lake | 4,658 | 2,275,704(0.20%)#76 | 61,755,866(0.01%)#1,645 |
| 77. | Elk Grove Village | 4,547 | 2,275,704(0.20%)#77 | 61,755,866(0.01%)#1,680 |
| 78. | Lake In The Hills | 4,529 | 2,275,704(0.20%)#78 | 61,755,866(0.01%)#1,686 |
| 79. | Mchenry | 4,453 | 2,275,704(0.20%)#79 | 61,755,866(0.01%)#1,710 |
| 80. | Gurnee | 4,440 | 2,275,704(0.20%)#80 | 61,755,866(0.01%)#1,714 |
| 81. | Crest Hill | 4,429 | 2,275,704(0.19%)#81 | 61,755,866(0.01%)#1,719 |
| 82. | Bellwood | 4,298 | 2,275,704(0.19%)#82 | 61,755,866(0.01%)#1,763 |
| 83. | Stone Park | 4,268 | 2,275,704(0.19%)#83 | 61,755,866(0.01%)#1,768 |
| 84. | Plano | 4,197 | 2,275,704(0.18%)#84 | 61,755,866(0.01%)#1,795 |
| 85. | Elmhurst | 4,145 | 2,275,704(0.18%)#85 | 61,755,866(0.01%)#1,817 |
| 86. | Wheaton | 4,081 | 2,275,704(0.18%)#86 | 61,755,866(0.01%)#1,840 |
| 87. | East Moline | 4,014 | 2,275,704(0.18%)#87 | 61,755,866(0.01%)#1,859 |
| 88. | Oak Forest | 4,000 | 2,275,704(0.18%)#88 | 61,755,866(0.01%)#1,867 |
| 89. | Sterling | 3,955 | 2,275,704(0.17%)#89 | 61,755,866(0.01%)#1,887 |
| 90. | Posen | 3,790 | 2,275,704(0.17%)#90 | 61,755,866(0.01%)#1,950 |
| 91. | Schiller Park | 3,777 | 2,275,704(0.17%)#91 | 61,755,866(0.01%)#1,957 |
| 92. | Plainfield | 3,727 | 2,275,704(0.16%)#92 | 61,755,866(0.01%)#1,969 |
| 93. | Wood Dale | 3,704 | 2,275,704(0.16%)#93 | 61,755,866(0.01%)#1,980 |
| 94. | Round Lake Park | 3,700 | 2,275,704(0.16%)#94 | 61,755,866(0.01%)#1,984 |
| 95. | Boulder Hill | 3,697 | 2,275,704(0.16%)#95 | 61,755,866(0.01%)#1,985 |
| 96. | Niles | 3,689 | 2,275,704(0.16%)#96 | 61,755,866(0.01%)#1,989 |
| 97. | River Grove | 3,643 | 2,275,704(0.16%)#97 | 61,755,866(0.01%)#2,006 |
| 98. | Glenview | 3,641 | 2,275,704(0.16%)#98 | 61,755,866(0.01%)#2,007 |
| 99. | Brookfield | 3,552 | 2,275,704(0.16%)#99 | 61,755,866(0.01%)#2,043 |
| 100. | Springfield | 3,543 | 2,275,704(0.16%)#100 | 61,755,866(0.01%)#2,046 |
Common Questions
What are the Top 10 Cities with the Largest Hispanic or Latino Community in Illinois?
Top 10 Cities with the Largest Hispanic or Latino Community in Illinois are:
#1
788,106
#2
76,816
#3
73,974
#4
54,061
#5
50,388
#6
47,070
#7
34,510
#8
28,264
#9
20,571
#10
20,044
What city has the Largest Hispanic or Latino Community in Illinois?
Chicago has the Largest Hispanic or Latino Community in Illinois with 788,106.
What is the Total Hispanic or Latino Population in the State of Illinois?
Total Hispanic or Latino Population in Illinois is 2,275,704.
What is the Total Hispanic or Latino Population in the United States?
Total Hispanic or Latino Population in the United States is 61,755,866.