Cities with the Most Births per 1,000 Women Receiving Public Assitance in Illinois
RELATED REPORTS & OPTIONS
Highest Birth Rate | Public Income
Illinois
Compare Cities
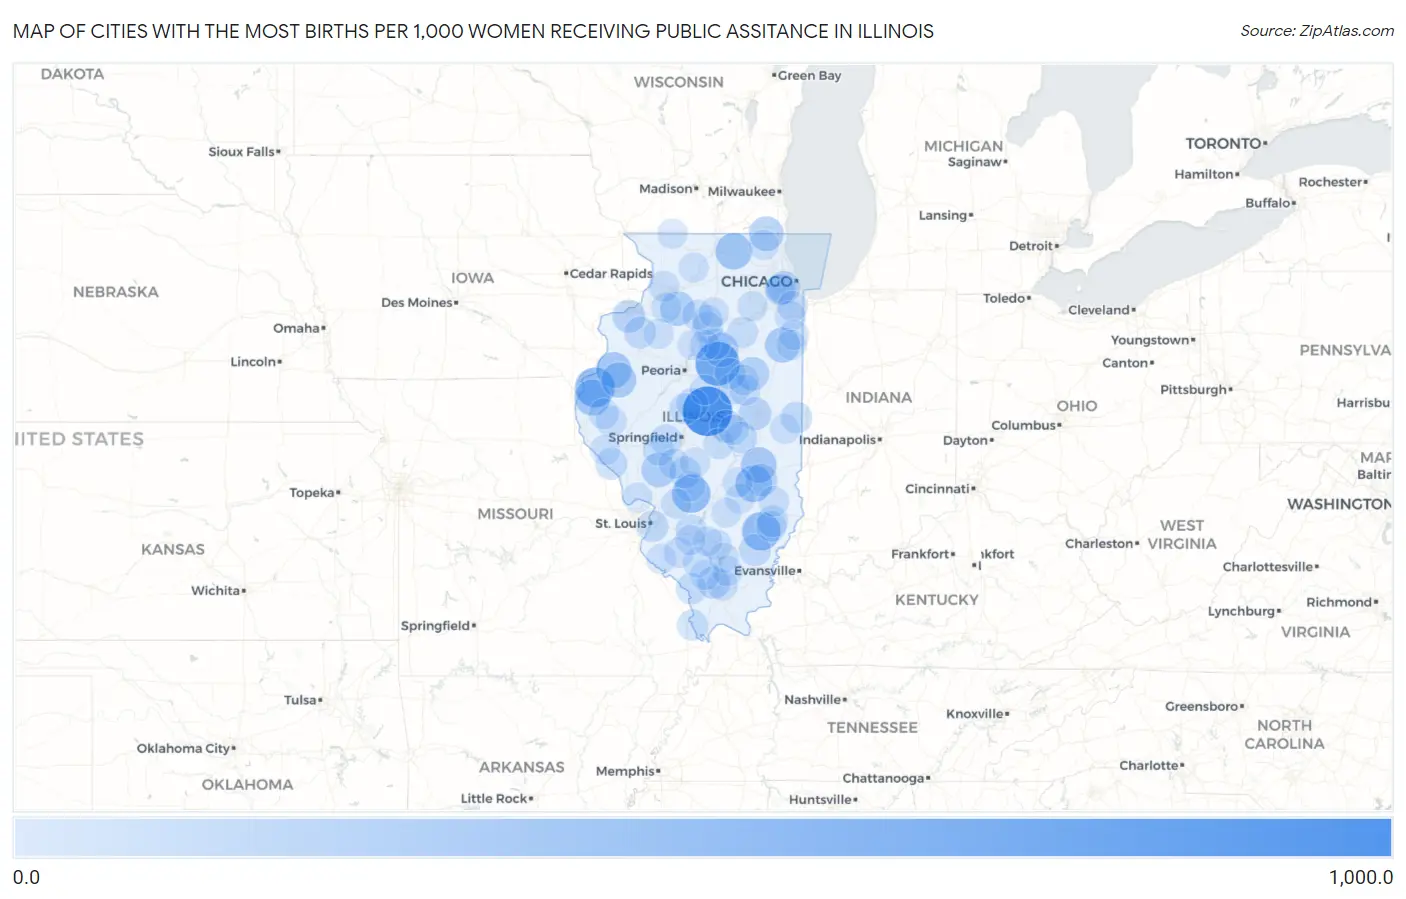
Map of Cities with the Most Births per 1,000 Women Receiving Public Assitance in Illinois
0.0
1,000.0
Cities with the Most Births per 1,000 Women Receiving Public Assitance in Illinois
| City | Births / 1,000 Women | vs State | vs National | |
| 1. | Mossville | 1,000.0 | 51.0(+949)#1 | 52.0(+948)#16 |
| 2. | Beason | 1,000.0 | 51.0(+949)#2 | 52.0(+948)#23 |
| 3. | Taylor Ridge | 1,000.0 | 51.0(+949)#3 | 52.0(+948)#31 |
| 4. | Trilla | 1,000.0 | 51.0(+949)#4 | 52.0(+948)#33 |
| 5. | Solon Mills | 750.0 | 51.0(+699)#5 | 52.0(+698)#108 |
| 6. | Panola | 750.0 | 51.0(+699)#6 | 52.0(+698)#112 |
| 7. | Baileyville | 560.0 | 51.0(+509)#7 | 52.0(+508)#198 |
| 8. | Ferris | 556.0 | 51.0(+505)#8 | 52.0(+504)#201 |
| 9. | Kings | 505.0 | 51.0(+454)#9 | 52.0(+453)#223 |
| 10. | Donnellson | 500.0 | 51.0(+449)#10 | 52.0(+448)#227 |
| 11. | Mount Erie | 500.0 | 51.0(+449)#11 | 52.0(+448)#229 |
| 12. | Lake Carroll | 419.0 | 51.0(+368)#12 | 52.0(+367)#315 |
| 13. | Montrose | 419.0 | 51.0(+368)#13 | 52.0(+367)#317 |
| 14. | Garden Prairie | 413.0 | 51.0(+362)#14 | 52.0(+361)#327 |
| 15. | Wilton Center | 400.0 | 51.0(+349)#15 | 52.0(+348)#345 |
| 16. | Basco | 400.0 | 51.0(+349)#16 | 52.0(+348)#346 |
| 17. | Lerna | 378.0 | 51.0(+327)#17 | 52.0(+326)#381 |
| 18. | Raritan | 375.0 | 51.0(+324)#18 | 52.0(+323)#385 |
| 19. | Lowpoint | 364.0 | 51.0(+313)#19 | 52.0(+312)#408 |
| 20. | Sciota | 357.0 | 51.0(+306)#20 | 52.0(+305)#423 |
| 21. | Sammons Point | 354.0 | 51.0(+303)#21 | 52.0(+302)#433 |
| 22. | Hettick | 333.0 | 51.0(+282)#22 | 52.0(+281)#488 |
| 23. | New Bedford | 333.0 | 51.0(+282)#23 | 52.0(+281)#500 |
| 24. | Channel Lake | 331.0 | 51.0(+280)#24 | 52.0(+279)#507 |
| 25. | Dana | 324.0 | 51.0(+273)#25 | 52.0(+272)#530 |
| 26. | Ritchie | 313.0 | 51.0(+262)#26 | 52.0(+261)#573 |
| 27. | Strawn | 286.0 | 51.0(+235)#27 | 52.0(+234)#689 |
| 28. | Oak Grove | 259.0 | 51.0(+208)#28 | 52.0(+207)#825 |
| 29. | Mccook | 259.0 | 51.0(+208)#29 | 52.0(+207)#826 |
| 30. | Bondville | 258.0 | 51.0(+207)#30 | 52.0(+206)#831 |
| 31. | Oreana | 255.0 | 51.0(+204)#31 | 52.0(+203)#843 |
| 32. | Jewett | 244.0 | 51.0(+193)#32 | 52.0(+192)#925 |
| 33. | Colp | 244.0 | 51.0(+193)#33 | 52.0(+192)#926 |
| 34. | Alpha | 218.0 | 51.0(+167)#34 | 52.0(+166)#1,143 |
| 35. | Mill Shoals | 214.0 | 51.0(+163)#35 | 52.0(+162)#1,185 |
| 36. | Hammond | 212.0 | 51.0(+161)#36 | 52.0(+160)#1,211 |
| 37. | Raymond | 211.0 | 51.0(+160)#37 | 52.0(+159)#1,219 |
| 38. | Pleasant Hill | 209.0 | 51.0(+158)#38 | 52.0(+157)#1,233 |
| 39. | Sauget | 208.0 | 51.0(+157)#39 | 52.0(+156)#1,250 |
| 40. | Belgium | 207.0 | 51.0(+156)#40 | 52.0(+155)#1,260 |
| 41. | Wenona | 201.0 | 51.0(+150)#41 | 52.0(+149)#1,306 |
| 42. | Hartsburg | 200.0 | 51.0(+149)#42 | 52.0(+148)#1,316 |
| 43. | New Holland | 200.0 | 51.0(+149)#43 | 52.0(+148)#1,322 |
| 44. | Calhoun | 200.0 | 51.0(+149)#44 | 52.0(+148)#1,329 |
| 45. | Berlin | 200.0 | 51.0(+149)#45 | 52.0(+148)#1,336 |
| 46. | Ellsworth | 194.0 | 51.0(+143)#46 | 52.0(+142)#1,402 |
| 47. | Standard | 192.0 | 51.0(+141)#47 | 52.0(+140)#1,426 |
| 48. | Franklin | 190.0 | 51.0(+139)#48 | 52.0(+138)#1,451 |
| 49. | Lexington | 189.0 | 51.0(+138)#49 | 52.0(+137)#1,462 |
| 50. | Gorham | 186.0 | 51.0(+135)#50 | 52.0(+134)#1,518 |
| 51. | Mound Station | 184.0 | 51.0(+133)#51 | 52.0(+132)#1,551 |
| 52. | Indian Head Park | 179.0 | 51.0(+128)#52 | 52.0(+127)#1,610 |
| 53. | Bartelso | 179.0 | 51.0(+128)#53 | 52.0(+127)#1,620 |
| 54. | Thebes | 179.0 | 51.0(+128)#54 | 52.0(+127)#1,624 |
| 55. | Woodlawn | 177.0 | 51.0(+126)#55 | 52.0(+125)#1,651 |
| 56. | Saybrook | 176.0 | 51.0(+125)#56 | 52.0(+124)#1,660 |
| 57. | Spillertown | 176.0 | 51.0(+125)#57 | 52.0(+124)#1,662 |
| 58. | Kinsman | 174.0 | 51.0(+123)#58 | 52.0(+122)#1,712 |
| 59. | Morrison | 173.0 | 51.0(+122)#59 | 52.0(+121)#1,716 |
| 60. | Burr Ridge | 172.0 | 51.0(+121)#60 | 52.0(+120)#1,729 |
| 61. | Parkersburg | 172.0 | 51.0(+121)#61 | 52.0(+120)#1,744 |
| 62. | Macon | 171.0 | 51.0(+120)#62 | 52.0(+119)#1,755 |
| 63. | Anchor | 171.0 | 51.0(+120)#63 | 52.0(+119)#1,761 |
| 64. | Monee | 169.0 | 51.0(+118)#64 | 52.0(+117)#1,776 |
| 65. | Malden | 169.0 | 51.0(+118)#65 | 52.0(+117)#1,788 |
| 66. | Ste Marie | 164.0 | 51.0(+113)#66 | 52.0(+112)#1,903 |
| 67. | Golden | 162.0 | 51.0(+111)#67 | 52.0(+110)#1,945 |
| 68. | Taylor Springs | 160.0 | 51.0(+109)#68 | 52.0(+108)#1,979 |
| 69. | Flossmoor | 158.0 | 51.0(+107)#69 | 52.0(+106)#2,018 |
| 70. | Tilden | 158.0 | 51.0(+107)#70 | 52.0(+106)#2,030 |
| 71. | Varna | 157.0 | 51.0(+106)#71 | 52.0(+105)#2,061 |
| 72. | Girard | 153.0 | 51.0(+102)#72 | 52.0(+101)#2,161 |
| 73. | Dalzell | 153.0 | 51.0(+102)#73 | 52.0(+101)#2,171 |
| 74. | Alhambra | 153.0 | 51.0(+102)#74 | 52.0(+101)#2,172 |
| 75. | Cerro Gordo | 152.0 | 51.0(+101)#75 | 52.0(+100.0)#2,189 |
| 76. | Plattville | 152.0 | 51.0(+101)#76 | 52.0(+100.0)#2,201 |
| 77. | Stanford | 151.0 | 51.0(+100.0)#77 | 52.0(+99.0)#2,231 |
| 78. | Hanaford | 151.0 | 51.0(+100.0)#78 | 52.0(+99.0)#2,233 |
| 79. | Elkville | 150.0 | 51.0(+99.0)#79 | 52.0(+98.0)#2,247 |
| 80. | El Dara | 150.0 | 51.0(+99.0)#80 | 52.0(+98.0)#2,263 |
| 81. | Momence | 149.0 | 51.0(+98.0)#81 | 52.0(+97.0)#2,273 |
| 82. | Mount Morris | 149.0 | 51.0(+98.0)#82 | 52.0(+97.0)#2,274 |
| 83. | Lakemoor | 148.0 | 51.0(+97.0)#83 | 52.0(+96.0)#2,301 |
| 84. | Ruma | 147.0 | 51.0(+96.0)#84 | 52.0(+95.0)#2,349 |
| 85. | Mason | 147.0 | 51.0(+96.0)#85 | 52.0(+95.0)#2,351 |
| 86. | Pinckneyville | 146.0 | 51.0(+95.0)#86 | 52.0(+94.0)#2,357 |
| 87. | Sidell | 146.0 | 51.0(+95.0)#87 | 52.0(+94.0)#2,378 |
| 88. | Shumway | 146.0 | 51.0(+95.0)#88 | 52.0(+94.0)#2,383 |
| 89. | Galva | 145.0 | 51.0(+94.0)#89 | 52.0(+93.0)#2,389 |
| 90. | Ina | 145.0 | 51.0(+94.0)#90 | 52.0(+93.0)#2,393 |
| 91. | St Anne | 145.0 | 51.0(+94.0)#91 | 52.0(+93.0)#2,401 |
| 92. | Sparland | 145.0 | 51.0(+94.0)#92 | 52.0(+93.0)#2,414 |
| 93. | Winslow | 145.0 | 51.0(+94.0)#93 | 52.0(+93.0)#2,417 |
| 94. | Addieville | 145.0 | 51.0(+94.0)#94 | 52.0(+93.0)#2,420 |
| 95. | Troy Grove | 145.0 | 51.0(+94.0)#95 | 52.0(+93.0)#2,422 |
| 96. | Palmer | 145.0 | 51.0(+94.0)#96 | 52.0(+93.0)#2,424 |
| 97. | Kinmundy | 143.0 | 51.0(+92.0)#97 | 52.0(+91.0)#2,473 |
| 98. | Grafton | 143.0 | 51.0(+92.0)#98 | 52.0(+91.0)#2,479 |
| 99. | Richview | 143.0 | 51.0(+92.0)#99 | 52.0(+91.0)#2,501 |
| 100. | Hooppole | 143.0 | 51.0(+92.0)#100 | 52.0(+91.0)#2,505 |
Common Questions
What are the Top 10 Cities with the Most Births per 1,000 Women Receiving Public Assitance in Illinois?
Top 10 Cities with the Most Births per 1,000 Women Receiving Public Assitance in Illinois are:
#1
1,000.0
#2
750.0
#3
556.0
#4
500.0
#5
500.0
#6
419.0
#7
413.0
#8
400.0
#9
378.0
#10
375.0
What city has the Most Births per 1,000 Women Receiving Public Assitance in Illinois?
Beason has the Most Births per 1,000 Women Receiving Public Assitance in Illinois with 1,000.0.
What is the Number of Births per 1,000 Women Receiving Public Assitance in the State of Illinois?
Number of Births per 1,000 Women Receiving Public Assitance in Illinois is 51.0.
What is the Number of Births per 1,000 Women Receiving Public Assitance in the United States?
Number of Births per 1,000 Women Receiving Public Assitance in the United States is 52.0.