Zip Codes with the Highest Percentage of Population Employed in Food Preparation & Serving in Des Plaines, IL
RELATED REPORTS & OPTIONS
Food Preparation & Serving
Des Plaines
Compare Zip Codes
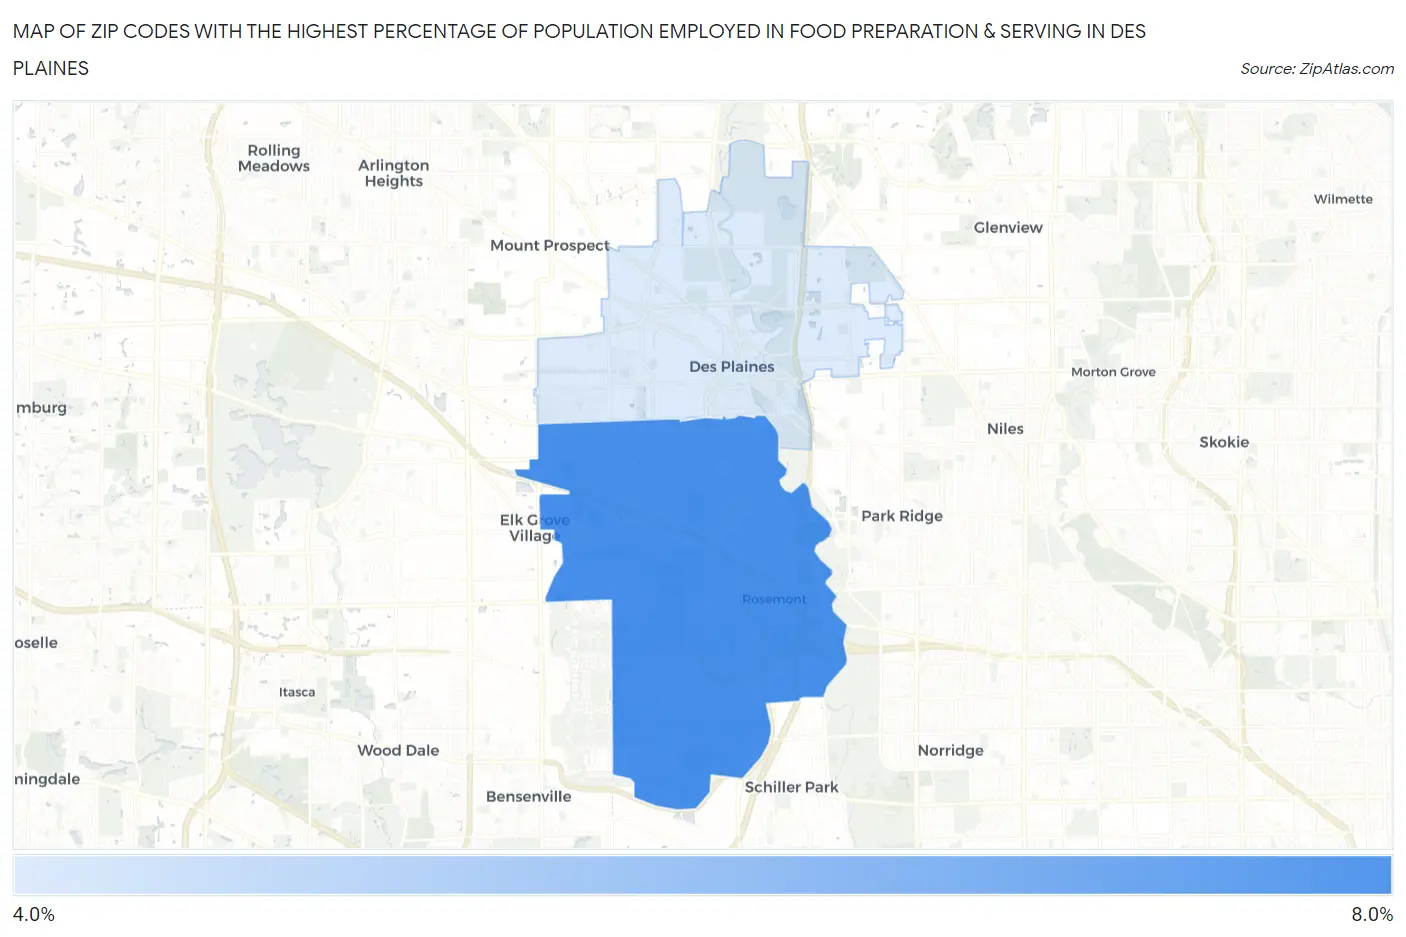
Map of Zip Codes with the Highest Percentage of Population Employed in Food Preparation & Serving in Des Plaines
4.4%
6.4%
Zip Codes with the Highest Percentage of Population Employed in Food Preparation & Serving in Des Plaines, IL
| Zip Code | % Employed | vs State | vs National | |
| 1. | 60018 | 6.4% | 5.0%(+1.38)#345 | 5.3%(+1.13)#8,105 |
| 2. | 60016 | 4.4% | 5.0%(-0.585)#654 | 5.3%(-0.836)#15,202 |
1
Common Questions
What are the Top Zip Codes with the Highest Percentage of Population Employed in Food Preparation & Serving in Des Plaines, IL?
Top Zip Codes with the Highest Percentage of Population Employed in Food Preparation & Serving in Des Plaines, IL are:
What zip code has the Highest Percentage of Population Employed in Food Preparation & Serving in Des Plaines, IL?
60018 has the Highest Percentage of Population Employed in Food Preparation & Serving in Des Plaines, IL with 6.4%.
What is the Percentage of Population Employed in Food Preparation & Serving in Des Plaines, IL?
Percentage of Population Employed in Food Preparation & Serving in Des Plaines is 4.7%.
What is the Percentage of Population Employed in Food Preparation & Serving in Illinois?
Percentage of Population Employed in Food Preparation & Serving in Illinois is 5.0%.
What is the Percentage of Population Employed in Food Preparation & Serving in the United States?
Percentage of Population Employed in Food Preparation & Serving in the United States is 5.3%.