Zip Codes with the Highest Percentage of Population Employed in Food Preparation & Serving in Plainfield, IL
RELATED REPORTS & OPTIONS
Food Preparation & Serving
Plainfield
Compare Zip Codes
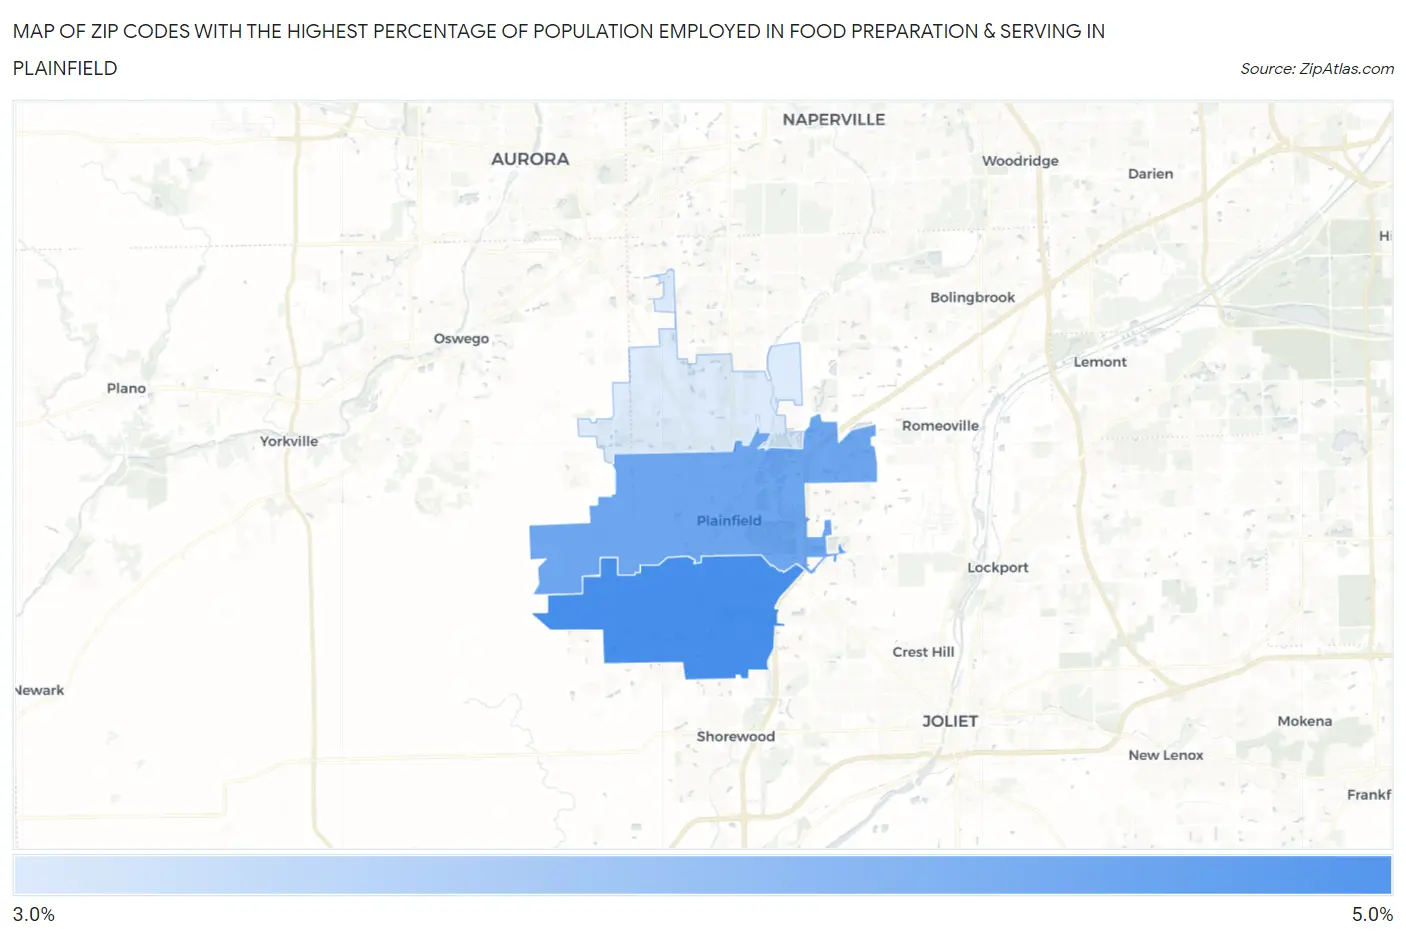
Map of Zip Codes with the Highest Percentage of Population Employed in Food Preparation & Serving in Plainfield
3.3%
4.7%
Zip Codes with the Highest Percentage of Population Employed in Food Preparation & Serving in Plainfield, IL
| Zip Code | % Employed | vs State | vs National | |
| 1. | 60586 | 4.7% | 5.0%(-0.318)#614 | 5.3%(-0.570)#14,101 |
| 2. | 60544 | 4.3% | 5.0%(-0.696)#673 | 5.3%(-0.948)#15,710 |
| 3. | 60585 | 3.3% | 5.0%(-1.72)#862 | 5.3%(-1.97)#19,998 |
1
Common Questions
What are the Top Zip Codes with the Highest Percentage of Population Employed in Food Preparation & Serving in Plainfield, IL?
Top Zip Codes with the Highest Percentage of Population Employed in Food Preparation & Serving in Plainfield, IL are:
What zip code has the Highest Percentage of Population Employed in Food Preparation & Serving in Plainfield, IL?
60586 has the Highest Percentage of Population Employed in Food Preparation & Serving in Plainfield, IL with 4.7%.
What is the Percentage of Population Employed in Food Preparation & Serving in Plainfield, IL?
Percentage of Population Employed in Food Preparation & Serving in Plainfield is 3.5%.
What is the Percentage of Population Employed in Food Preparation & Serving in Illinois?
Percentage of Population Employed in Food Preparation & Serving in Illinois is 5.0%.
What is the Percentage of Population Employed in Food Preparation & Serving in the United States?
Percentage of Population Employed in Food Preparation & Serving in the United States is 5.3%.