Zip Codes with the Highest Percentage of Population Employed in Food Preparation & Serving in Arlington Heights, IL
RELATED REPORTS & OPTIONS
Food Preparation & Serving
Arlington Heights
Compare Zip Codes
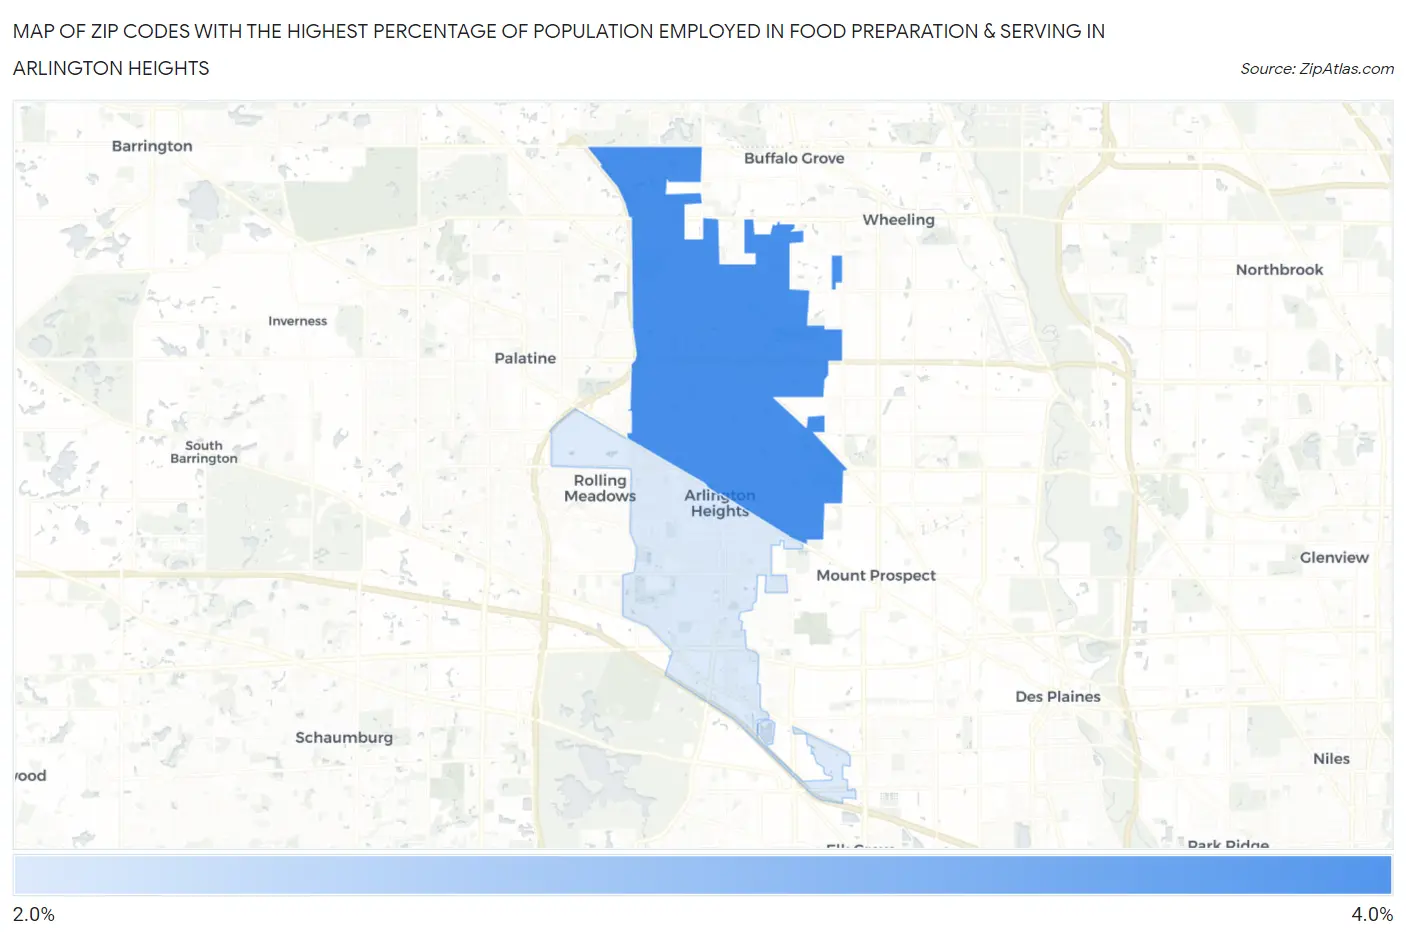
Map of Zip Codes with the Highest Percentage of Population Employed in Food Preparation & Serving in Arlington Heights
2.8%
3.8%
Zip Codes with the Highest Percentage of Population Employed in Food Preparation & Serving in Arlington Heights, IL
| Zip Code | % Employed | vs State | vs National | |
| 1. | 60004 | 3.8% | 5.0%(-1.22)#766 | 5.3%(-1.48)#17,897 |
| 2. | 60005 | 2.8% | 5.0%(-2.28)#980 | 5.3%(-2.53)#22,240 |
1
Common Questions
What are the Top Zip Codes with the Highest Percentage of Population Employed in Food Preparation & Serving in Arlington Heights, IL?
Top Zip Codes with the Highest Percentage of Population Employed in Food Preparation & Serving in Arlington Heights, IL are:
What zip code has the Highest Percentage of Population Employed in Food Preparation & Serving in Arlington Heights, IL?
60004 has the Highest Percentage of Population Employed in Food Preparation & Serving in Arlington Heights, IL with 3.8%.
What is the Percentage of Population Employed in Food Preparation & Serving in Arlington Heights, IL?
Percentage of Population Employed in Food Preparation & Serving in Arlington Heights is 3.4%.
What is the Percentage of Population Employed in Food Preparation & Serving in Illinois?
Percentage of Population Employed in Food Preparation & Serving in Illinois is 5.0%.
What is the Percentage of Population Employed in Food Preparation & Serving in the United States?
Percentage of Population Employed in Food Preparation & Serving in the United States is 5.3%.