Cities with the Most Immigrants from Middle Africa in Illinois
RELATED REPORTS & OPTIONS
Middle Africa
Illinois
Compare Cities
Map of Cities with the Most Immigrants from Middle Africa in Illinois
0
1,500
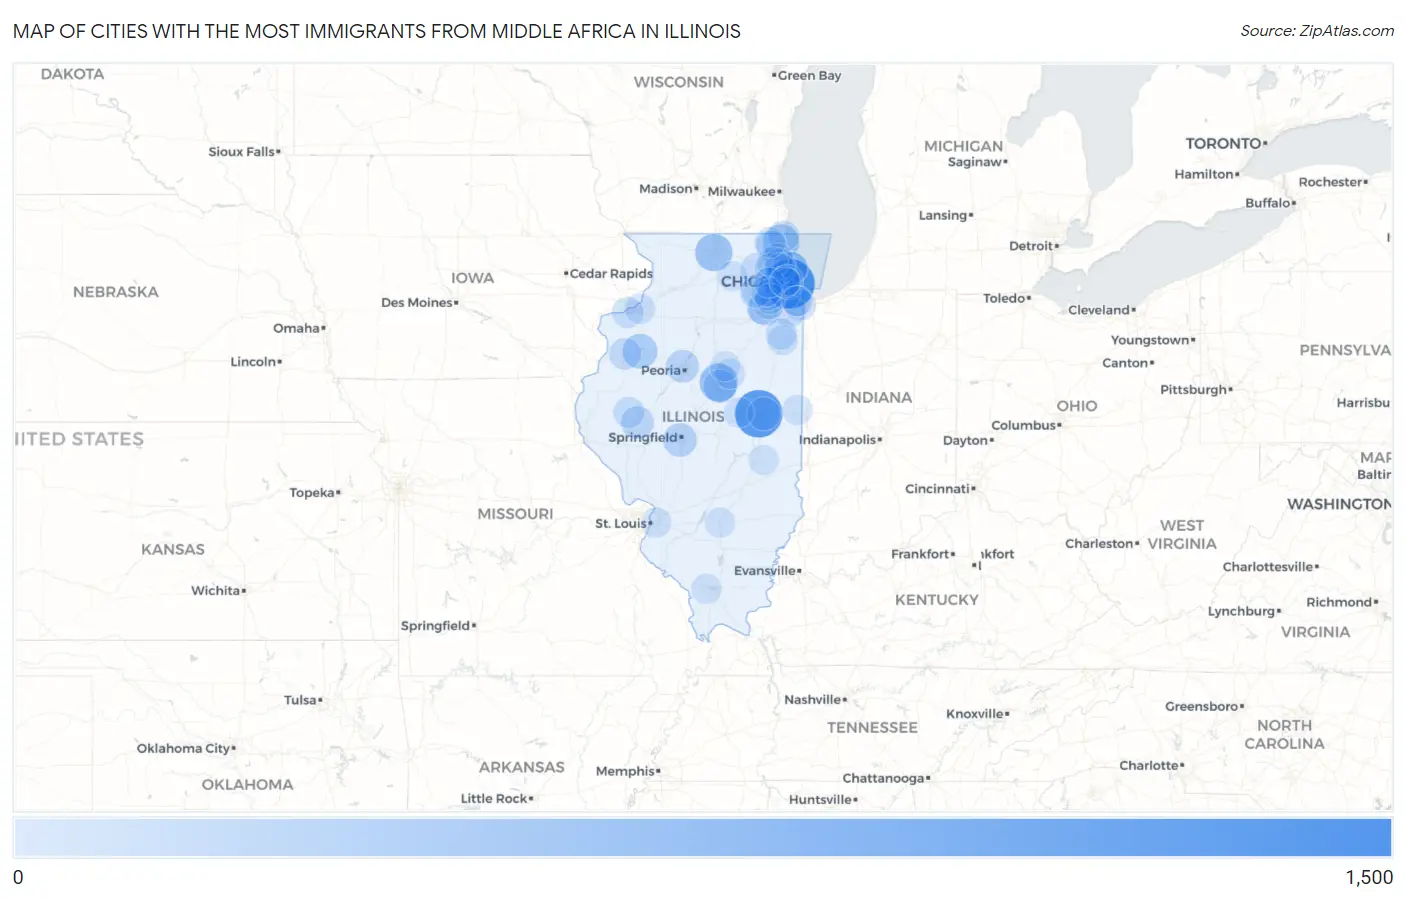
Cities with the Most Immigrants from Middle Africa in Illinois
| City | Middle Africa | vs State | vs National | |
| 1. | Chicago | 1,348 | 7,830(17.22%)#1 | 193,874(0.70%)#21 |
| 2. | Champaign | 1,201 | 7,830(15.34%)#2 | 193,874(0.62%)#23 |
| 3. | Normal | 544 | 7,830(6.95%)#3 | 193,874(0.28%)#63 |
| 4. | Rockford | 481 | 7,830(6.14%)#4 | 193,874(0.25%)#73 |
| 5. | Waukegan | 414 | 7,830(5.29%)#5 | 193,874(0.21%)#85 |
| 6. | Hillside | 387 | 7,830(4.94%)#6 | 193,874(0.20%)#99 |
| 7. | Galesburg | 308 | 7,830(3.93%)#7 | 193,874(0.16%)#126 |
| 8. | Skokie | 288 | 7,830(3.68%)#8 | 193,874(0.15%)#138 |
| 9. | Springfield | 234 | 7,830(2.99%)#9 | 193,874(0.12%)#179 |
| 10. | Joliet | 195 | 7,830(2.49%)#10 | 193,874(0.10%)#208 |
| 11. | Bloomington | 191 | 7,830(2.44%)#11 | 193,874(0.10%)#213 |
| 12. | Urbana | 189 | 7,830(2.41%)#12 | 193,874(0.10%)#215 |
| 13. | Peoria | 175 | 7,830(2.23%)#13 | 193,874(0.09%)#229 |
| 14. | Beardstown | 170 | 7,830(2.17%)#14 | 193,874(0.09%)#232 |
| 15. | Aurora | 123 | 7,830(1.57%)#15 | 193,874(0.06%)#295 |
| 16. | Monmouth | 110 | 7,830(1.40%)#16 | 193,874(0.06%)#320 |
| 17. | Lansing | 81 | 7,830(1.03%)#17 | 193,874(0.04%)#411 |
| 18. | Rock Island | 78 | 7,830(1.00%)#18 | 193,874(0.04%)#422 |
| 19. | Elgin | 73 | 7,830(0.93%)#19 | 193,874(0.04%)#437 |
| 20. | Richton Park | 72 | 7,830(0.92%)#20 | 193,874(0.04%)#449 |
| 21. | Shorewood | 63 | 7,830(0.80%)#21 | 193,874(0.03%)#495 |
| 22. | Bourbonnais | 62 | 7,830(0.79%)#22 | 193,874(0.03%)#502 |
| 23. | Crest Hill | 59 | 7,830(0.75%)#23 | 193,874(0.03%)#514 |
| 24. | Zion | 58 | 7,830(0.74%)#24 | 193,874(0.03%)#520 |
| 25. | Round Lake Park | 58 | 7,830(0.74%)#25 | 193,874(0.03%)#521 |
| 26. | Rushville | 58 | 7,830(0.74%)#26 | 193,874(0.03%)#522 |
| 27. | Evanston | 50 | 7,830(0.64%)#27 | 193,874(0.03%)#570 |
| 28. | Palos Hills | 49 | 7,830(0.63%)#28 | 193,874(0.03%)#580 |
| 29. | Buffalo Grove | 47 | 7,830(0.60%)#29 | 193,874(0.02%)#590 |
| 30. | Glen Ellyn | 45 | 7,830(0.57%)#30 | 193,874(0.02%)#607 |
| 31. | Schaumburg | 39 | 7,830(0.50%)#31 | 193,874(0.02%)#658 |
| 32. | Prospect Heights | 39 | 7,830(0.50%)#32 | 193,874(0.02%)#663 |
| 33. | Palatine | 34 | 7,830(0.43%)#33 | 193,874(0.02%)#702 |
| 34. | Des Plaines | 31 | 7,830(0.40%)#34 | 193,874(0.02%)#734 |
| 35. | Woodridge | 31 | 7,830(0.40%)#35 | 193,874(0.02%)#735 |
| 36. | Bolingbrook | 29 | 7,830(0.37%)#36 | 193,874(0.01%)#755 |
| 37. | Forest Park | 28 | 7,830(0.36%)#37 | 193,874(0.01%)#777 |
| 38. | Round Lake Beach | 23 | 7,830(0.29%)#38 | 193,874(0.01%)#829 |
| 39. | Berwyn | 22 | 7,830(0.28%)#39 | 193,874(0.01%)#849 |
| 40. | Montgomery | 17 | 7,830(0.22%)#40 | 193,874(0.01%)#949 |
| 41. | Oak Park | 16 | 7,830(0.20%)#41 | 193,874(0.01%)#959 |
| 42. | Kankakee | 15 | 7,830(0.19%)#42 | 193,874(0.01%)#993 |
| 43. | Romeoville | 13 | 7,830(0.17%)#43 | 193,874(0.01%)#1,031 |
| 44. | Naperville | 12 | 7,830(0.15%)#44 | 193,874(0.01%)#1,056 |
| 45. | East Moline | 12 | 7,830(0.15%)#45 | 193,874(0.01%)#1,069 |
| 46. | Wheaton | 9 | 7,830(0.11%)#46 | 193,874(0.00%)#1,161 |
| 47. | Lexington | 9 | 7,830(0.11%)#47 | 193,874(0.00%)#1,182 |
| 48. | Phoenix | 9 | 7,830(0.11%)#48 | 193,874(0.00%)#1,185 |
| 49. | South Holland | 8 | 7,830(0.10%)#49 | 193,874(0.00%)#1,196 |
| 50. | Washington Park | 8 | 7,830(0.10%)#50 | 193,874(0.00%)#1,206 |
| 51. | Danville | 7 | 7,830(0.09%)#51 | 193,874(0.00%)#1,220 |
| 52. | Gridley | 6 | 7,830(0.08%)#52 | 193,874(0.00%)#1,262 |
| 53. | Salem | 4 | 7,830(0.05%)#53 | 193,874(0.00%)#1,292 |
| 54. | Dekalb | 3 | 7,830(0.04%)#54 | 193,874(0.00%)#1,308 |
| 55. | Charleston | 3 | 7,830(0.04%)#55 | 193,874(0.00%)#1,314 |
| 56. | North Riverside | 2 | 7,830(0.03%)#56 | 193,874(0.00%)#1,349 |
| 57. | De Land | 2 | 7,830(0.03%)#57 | 193,874(0.00%)#1,362 |
| 58. | Carbondale | 1 | 7,830(0.01%)#58 | 193,874(0.00%)#1,374 |
Common Questions
What are the Top 10 Cities with the Most Immigrants from Middle Africa in Illinois?
Top 10 Cities with the Most Immigrants from Middle Africa in Illinois are:
What city has the Most Immigrants from Middle Africa in Illinois?
Chicago has the Most Immigrants from Middle Africa in Illinois with 1,348.
What is the Total Immigrants from Middle Africa in the State of Illinois?
Total Immigrants from Middle Africa in Illinois is 7,830.
What is the Total Immigrants from Middle Africa in the United States?
Total Immigrants from Middle Africa in the United States is 193,874.