Mill Creek, IL Map & Demographics
Mill Creek Map
Mill Creek Overview
$20,651
PER CAPITA INCOME
0.38
INEQUALITY / GINI INDEX
45
TOTAL POPULATION
24
MALE POPULATION
21
FEMALE POPULATION
114.29
MALES / 100 FEMALES
87.50
FEMALES / 100 MALES
45.5
MEDIAN AGE
2.8
AVG FAMILY SIZE
2.8
AVG HOUSEHOLD SIZE
18
LABOR FORCE [ PEOPLE ]
41.9%
PERCENT IN LABOR FORCE
22.2%
UNEMPLOYMENT RATE
Income in Mill Creek
Income Overview in Mill Creek
| Characteristic | Number | Measure |
| Per Capita Income | 45 | $20,651 |
| Median Family Income | 16 | $0 |
| Mean Family Income | 16 | $57,006 |
| Median Household Income | 16 | $0 |
| Mean Household Income | 16 | $57,006 |
| Income Deficit | 16 | $0 |
| Wage / Income Gap (%) | 45 | 0.00% |
| Wage / Income Gap ($) | 45 | 100.00¢ per $1 |
| Gini / Inequality Index | 45 | 0.38 |
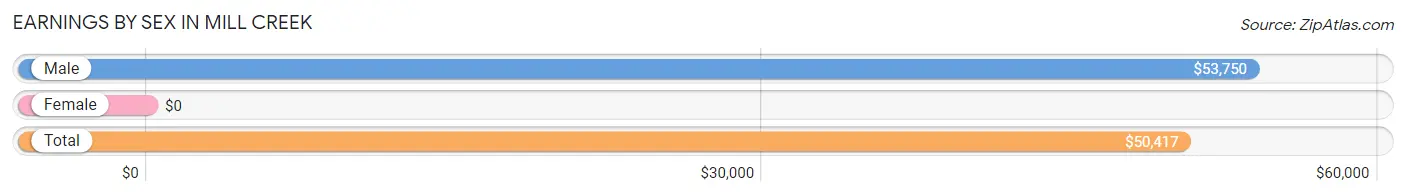
Earnings by Sex in Mill Creek
| Sex | Number | Average Earnings |
| Male | 9 (47.4%) | $53,750 |
| Female | 10 (52.6%) | $0 |
| Total | 19 (100.0%) | $50,417 |
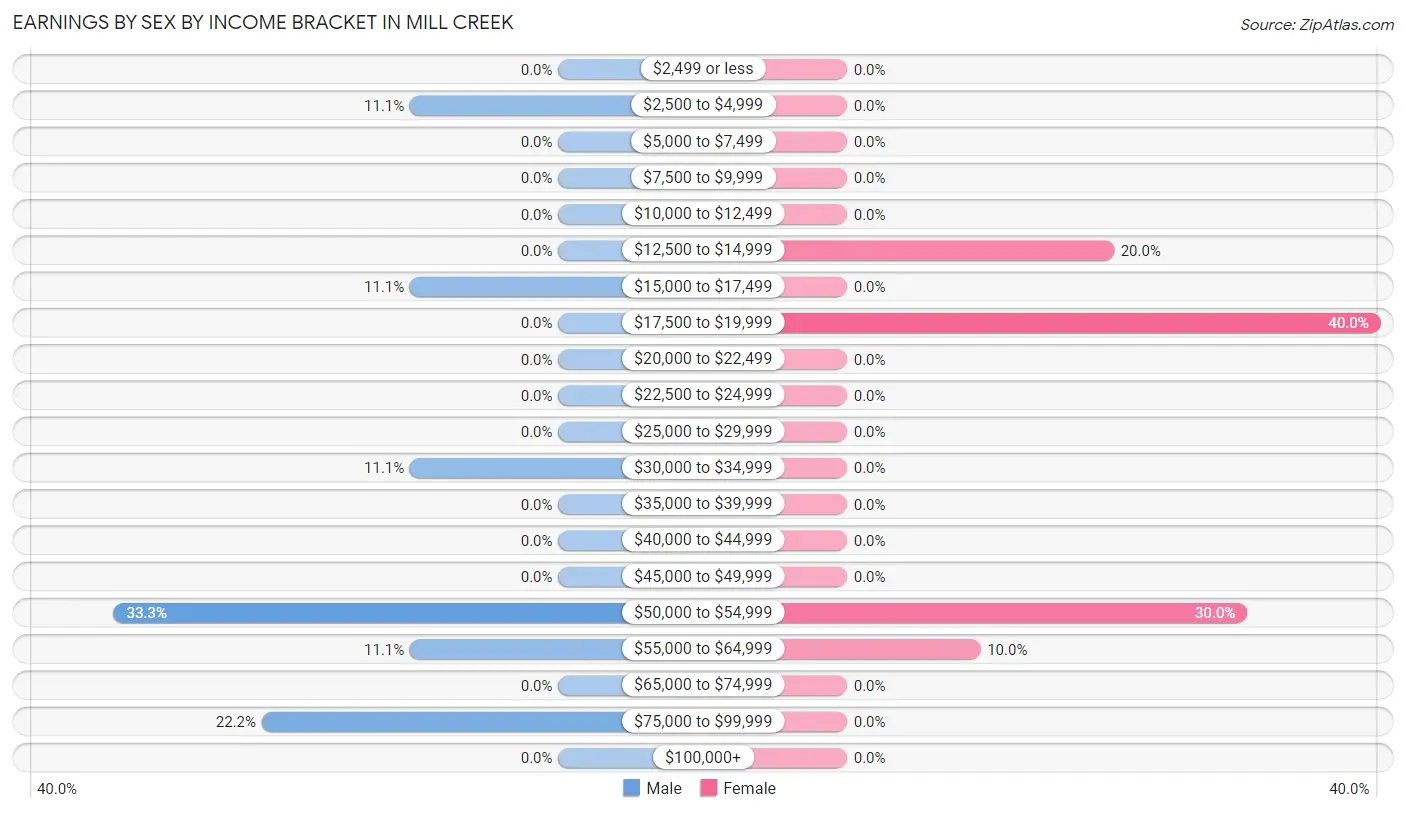
Earnings by Sex by Income Bracket in Mill Creek
The most common earnings brackets in Mill Creek are $50,000 to $54,999 for men (3 | 33.3%) and $17,500 to $19,999 for women (4 | 40.0%).
| Income | Male | Female |
| $2,499 or less | 0 (0.0%) | 0 (0.0%) |
| $2,500 to $4,999 | 1 (11.1%) | 0 (0.0%) |
| $5,000 to $7,499 | 0 (0.0%) | 0 (0.0%) |
| $7,500 to $9,999 | 0 (0.0%) | 0 (0.0%) |
| $10,000 to $12,499 | 0 (0.0%) | 0 (0.0%) |
| $12,500 to $14,999 | 0 (0.0%) | 2 (20.0%) |
| $15,000 to $17,499 | 1 (11.1%) | 0 (0.0%) |
| $17,500 to $19,999 | 0 (0.0%) | 4 (40.0%) |
| $20,000 to $22,499 | 0 (0.0%) | 0 (0.0%) |
| $22,500 to $24,999 | 0 (0.0%) | 0 (0.0%) |
| $25,000 to $29,999 | 0 (0.0%) | 0 (0.0%) |
| $30,000 to $34,999 | 1 (11.1%) | 0 (0.0%) |
| $35,000 to $39,999 | 0 (0.0%) | 0 (0.0%) |
| $40,000 to $44,999 | 0 (0.0%) | 0 (0.0%) |
| $45,000 to $49,999 | 0 (0.0%) | 0 (0.0%) |
| $50,000 to $54,999 | 3 (33.3%) | 3 (30.0%) |
| $55,000 to $64,999 | 1 (11.1%) | 1 (10.0%) |
| $65,000 to $74,999 | 0 (0.0%) | 0 (0.0%) |
| $75,000 to $99,999 | 2 (22.2%) | 0 (0.0%) |
| $100,000+ | 0 (0.0%) | 0 (0.0%) |
| Total | 9 (100.0%) | 10 (100.0%) |
Earnings by Sex by Educational Attainment in Mill Creek
| Educational Attainment | Male Income | Female Income |
| Less than High School | - | - |
| High School Diploma | - | - |
| College or Associate's Degree | - | - |
| Bachelor's Degree | - | - |
| Graduate Degree | - | - |
| Total | $54,583 | $0 |
Family Income in Mill Creek
Family Income Brackets in Mill Creek
According to the Mill Creek family income data, there are 8 families falling into the $15,000 to $24,999 income range, which is the most common income bracket and makes up 50.0% of all families.
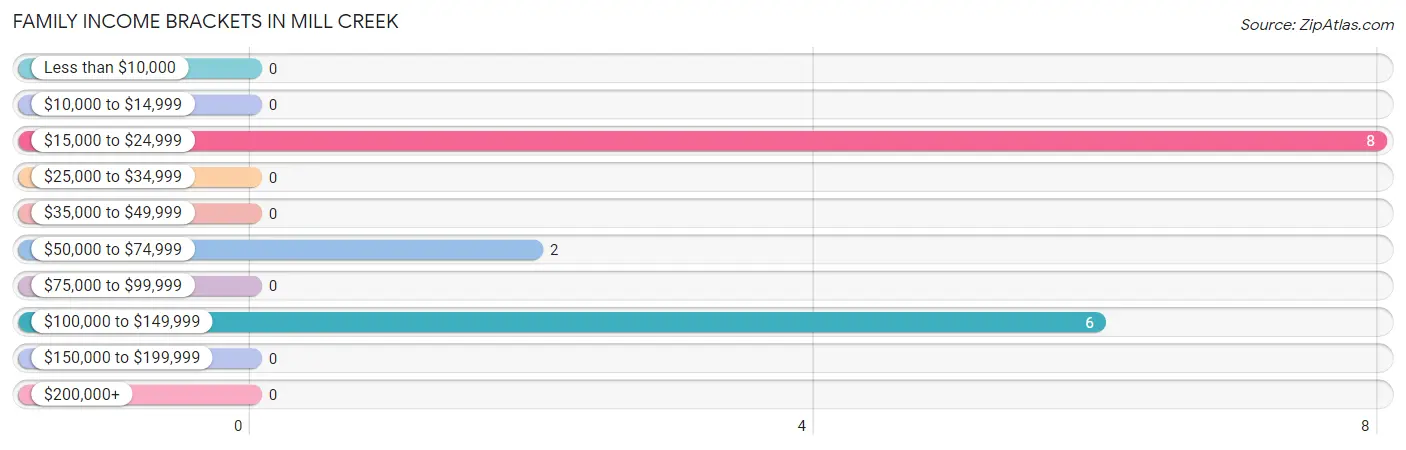
| Income Bracket | # Families | % Families |
| Less than $10,000 | 0 | 0.0% |
| $10,000 to $14,999 | 0 | 0.0% |
| $15,000 to $24,999 | 8 | 50.0% |
| $25,000 to $34,999 | 0 | 0.0% |
| $35,000 to $49,999 | 0 | 0.0% |
| $50,000 to $74,999 | 2 | 12.5% |
| $75,000 to $99,999 | 0 | 0.0% |
| $100,000 to $149,999 | 6 | 37.5% |
| $150,000 to $199,999 | 0 | 0.0% |
| $200,000+ | 0 | 0.0% |
Family Income by Famaliy Size in Mill Creek
| Income Bracket | # Families | Median Income |
| 2-Person Families | 11 (68.8%) | $0 |
| 3-Person Families | 2 (12.5%) | $0 |
| 4-Person Families | 3 (18.8%) | $0 |
| 5-Person Families | 0 (0.0%) | $0 |
| 6-Person Families | 0 (0.0%) | $0 |
| 7+ Person Families | 0 (0.0%) | $0 |
| Total | 16 (100.0%) | $0 |
Family Income by Number of Earners in Mill Creek
| Number of Earners | # Families | Median Income |
| No Earners | 4 (25.0%) | $0 |
| 1 Earner | 6 (37.5%) | $0 |
| 2 Earners | 4 (25.0%) | $0 |
| 3+ Earners | 2 (12.5%) | $0 |
| Total | 16 (100.0%) | $0 |
Household Income in Mill Creek
Household Income Brackets in Mill Creek
With 8 households falling in the category, the $15,000 to $24,999 income range is the most frequent in Mill Creek, accounting for 50.0% of all households.
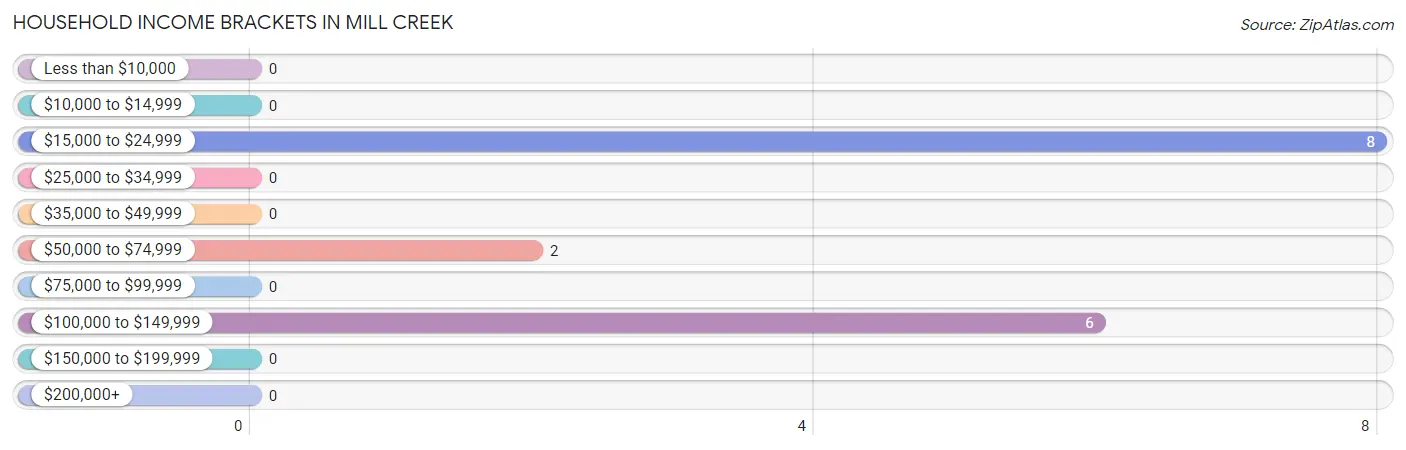
| Income Bracket | # Households | % Households |
| Less than $10,000 | 0 | 0.0% |
| $10,000 to $14,999 | 0 | 0.0% |
| $15,000 to $24,999 | 8 | 50.0% |
| $25,000 to $34,999 | 0 | 0.0% |
| $35,000 to $49,999 | 0 | 0.0% |
| $50,000 to $74,999 | 2 | 12.5% |
| $75,000 to $99,999 | 0 | 0.0% |
| $100,000 to $149,999 | 6 | 37.5% |
| $150,000 to $199,999 | 0 | 0.0% |
| $200,000+ | 0 | 0.0% |
Household Income by Householder Age in Mill Creek
| Income Bracket | # Households | Median Income |
| 15 to 24 Years | 0 (0.0%) | $0 |
| 25 to 44 Years | 8 (50.0%) | $0 |
| 45 to 64 Years | 4 (25.0%) | $0 |
| 65+ Years | 4 (25.0%) | $0 |
| Total | 16 (100.0%) | $0 |
Poverty in Mill Creek
Income Below Poverty by Sex and Age in Mill Creek
With 33.3% poverty level for males and 38.1% for females among the residents of Mill Creek, 16 and 17 year old males and 35 to 44 year old females are the most vulnerable to poverty, with 5 males (100.0%) and 4 females (50.0%) in their respective age groups living below the poverty level.
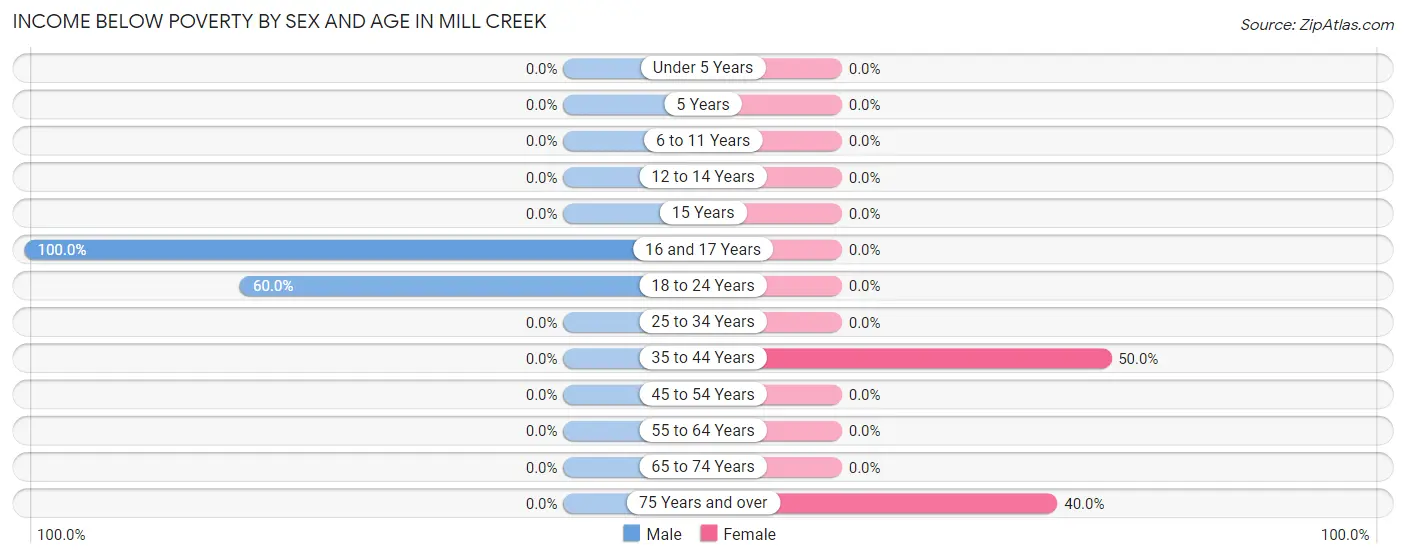
| Age Bracket | Male | Female |
| Under 5 Years | 0 (0.0%) | 0 (0.0%) |
| 5 Years | 0 (0.0%) | 0 (0.0%) |
| 6 to 11 Years | 0 (0.0%) | 0 (0.0%) |
| 12 to 14 Years | 0 (0.0%) | 0 (0.0%) |
| 15 Years | 0 (0.0%) | 0 (0.0%) |
| 16 and 17 Years | 5 (100.0%) | 0 (0.0%) |
| 18 to 24 Years | 3 (60.0%) | 0 (0.0%) |
| 25 to 34 Years | 0 (0.0%) | 0 (0.0%) |
| 35 to 44 Years | 0 (0.0%) | 4 (50.0%) |
| 45 to 54 Years | 0 (0.0%) | 0 (0.0%) |
| 55 to 64 Years | 0 (0.0%) | 0 (0.0%) |
| 65 to 74 Years | 0 (0.0%) | 0 (0.0%) |
| 75 Years and over | 0 (0.0%) | 4 (40.0%) |
| Total | 8 (33.3%) | 8 (38.1%) |
Income Above Poverty by Sex and Age in Mill Creek
According to the poverty statistics in Mill Creek, males aged 6 to 11 years and females aged under 5 years are the age groups that are most secure financially, with 100.0% of males and 100.0% of females in these age groups living above the poverty line.
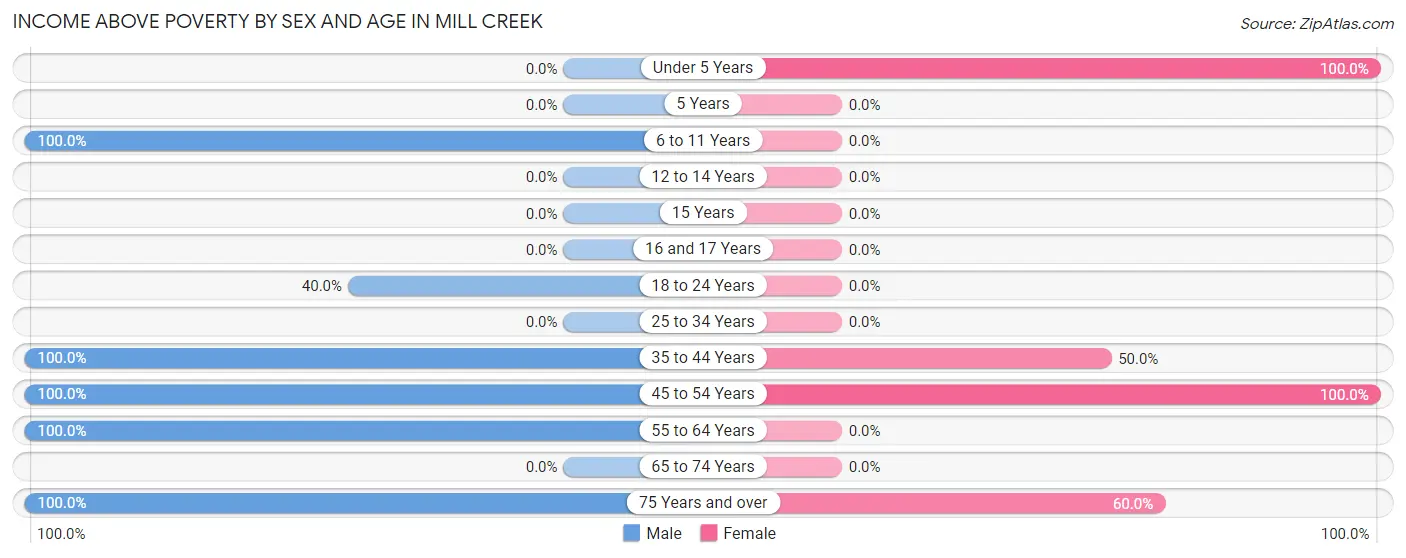
| Age Bracket | Male | Female |
| Under 5 Years | 0 (0.0%) | 1 (100.0%) |
| 5 Years | 0 (0.0%) | 0 (0.0%) |
| 6 to 11 Years | 1 (100.0%) | 0 (0.0%) |
| 12 to 14 Years | 0 (0.0%) | 0 (0.0%) |
| 15 Years | 0 (0.0%) | 0 (0.0%) |
| 16 and 17 Years | 0 (0.0%) | 0 (0.0%) |
| 18 to 24 Years | 2 (40.0%) | 0 (0.0%) |
| 25 to 34 Years | 0 (0.0%) | 0 (0.0%) |
| 35 to 44 Years | 1 (100.0%) | 4 (50.0%) |
| 45 to 54 Years | 4 (100.0%) | 2 (100.0%) |
| 55 to 64 Years | 2 (100.0%) | 0 (0.0%) |
| 65 to 74 Years | 0 (0.0%) | 0 (0.0%) |
| 75 Years and over | 6 (100.0%) | 6 (60.0%) |
| Total | 16 (66.7%) | 13 (61.9%) |
Income Below Poverty Among Married-Couple Families in Mill Creek
| Children | Above Poverty | Below Poverty |
| No Children | 5 (100.0%) | 0 (0.0%) |
| 1 or 2 Children | 1 (100.0%) | 0 (0.0%) |
| 3 or 4 Children | 0 (0.0%) | 0 (0.0%) |
| 5 or more Children | 0 (0.0%) | 0 (0.0%) |
| Total | 6 (100.0%) | 0 (0.0%) |
Income Below Poverty Among Single-Parent Households in Mill Creek
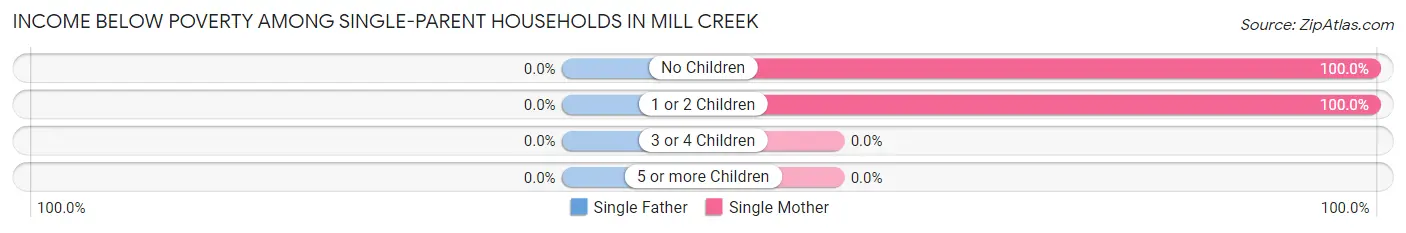
| Children | Single Father | Single Mother |
| No Children | 0 (0.0%) | 4 (100.0%) |
| 1 or 2 Children | 0 (0.0%) | 4 (100.0%) |
| 3 or 4 Children | 0 (0.0%) | 0 (0.0%) |
| 5 or more Children | 0 (0.0%) | 0 (0.0%) |
| Total | 0 (0.0%) | 8 (100.0%) |
Income Below Poverty Among Married-Couple vs Single-Parent Households in Mill Creek
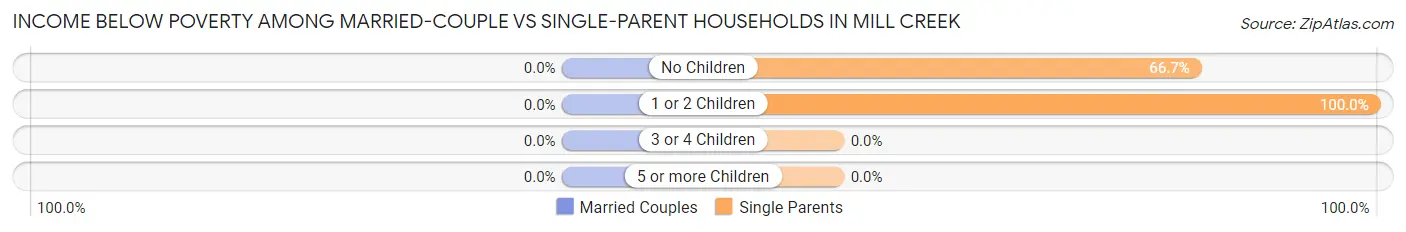
| Children | Married-Couple Families | Single-Parent Households |
| No Children | 0 (0.0%) | 4 (66.7%) |
| 1 or 2 Children | 0 (0.0%) | 4 (100.0%) |
| 3 or 4 Children | 0 (0.0%) | 0 (0.0%) |
| 5 or more Children | 0 (0.0%) | 0 (0.0%) |
| Total | 0 (0.0%) | 8 (80.0%) |
Race in Mill Creek
The most populous races in Mill Creek are White / Caucasian (45 | 100.0%), and Hispanic or Latino (4 | 8.9%).
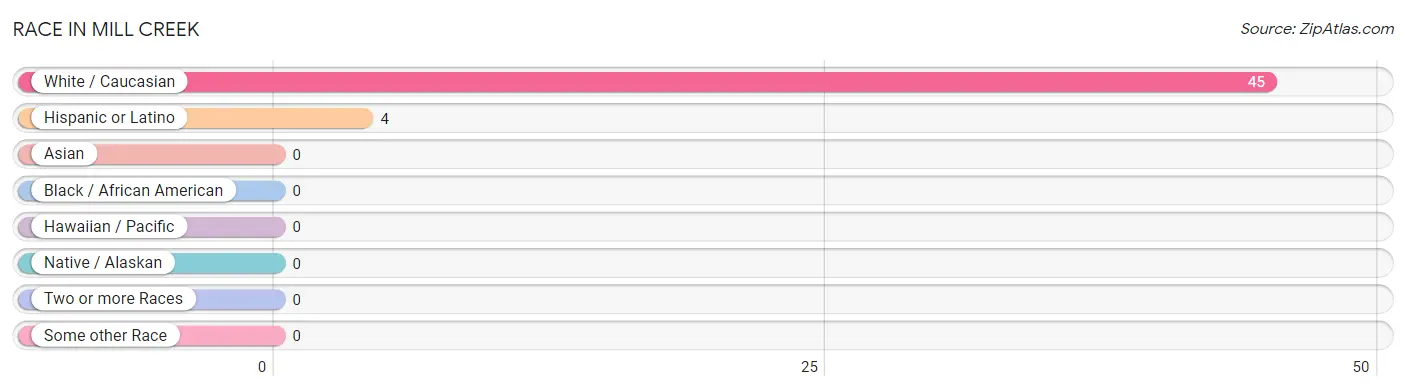
| Race | # Population | % Population |
| Asian | 0 | 0.0% |
| Black / African American | 0 | 0.0% |
| Hawaiian / Pacific | 0 | 0.0% |
| Hispanic or Latino | 4 | 8.9% |
| Native / Alaskan | 0 | 0.0% |
| White / Caucasian | 45 | 100.0% |
| Two or more Races | 0 | 0.0% |
| Some other Race | 0 | 0.0% |
| Total | 45 | 100.0% |
Ancestry in Mill Creek
The most populous ancestries reported in Mill Creek are German (20 | 44.4%), Irish (12 | 26.7%), Norwegian (10 | 22.2%), American (5 | 11.1%), and English (4 | 8.9%), together accounting for 113.3% of all Mill Creek residents.
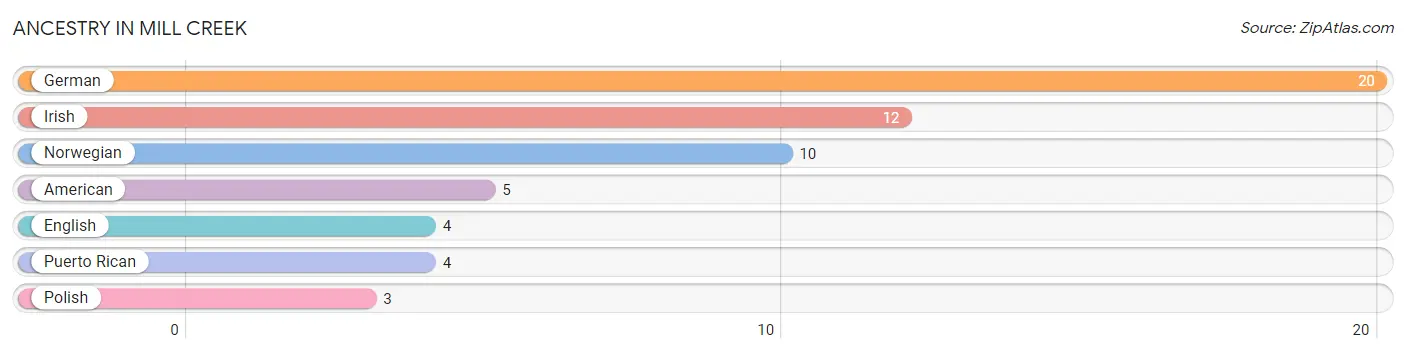
| Ancestry | # Population | % Population |
| American | 5 | 11.1% |
| English | 4 | 8.9% |
| German | 20 | 44.4% |
| Irish | 12 | 26.7% |
| Norwegian | 10 | 22.2% |
| Polish | 3 | 6.7% |
| Puerto Rican | 4 | 8.9% | View All 7 Rows |
Immigrants in Mill Creek

| Immigration Origin | # Population | % Population | View All 0 Rows |
Sex and Age in Mill Creek
Sex and Age in Mill Creek
The most populous age groups in Mill Creek are 85 Years and over (6 | 25.0%) for men and 40 to 44 Years (7 | 33.3%) for women.
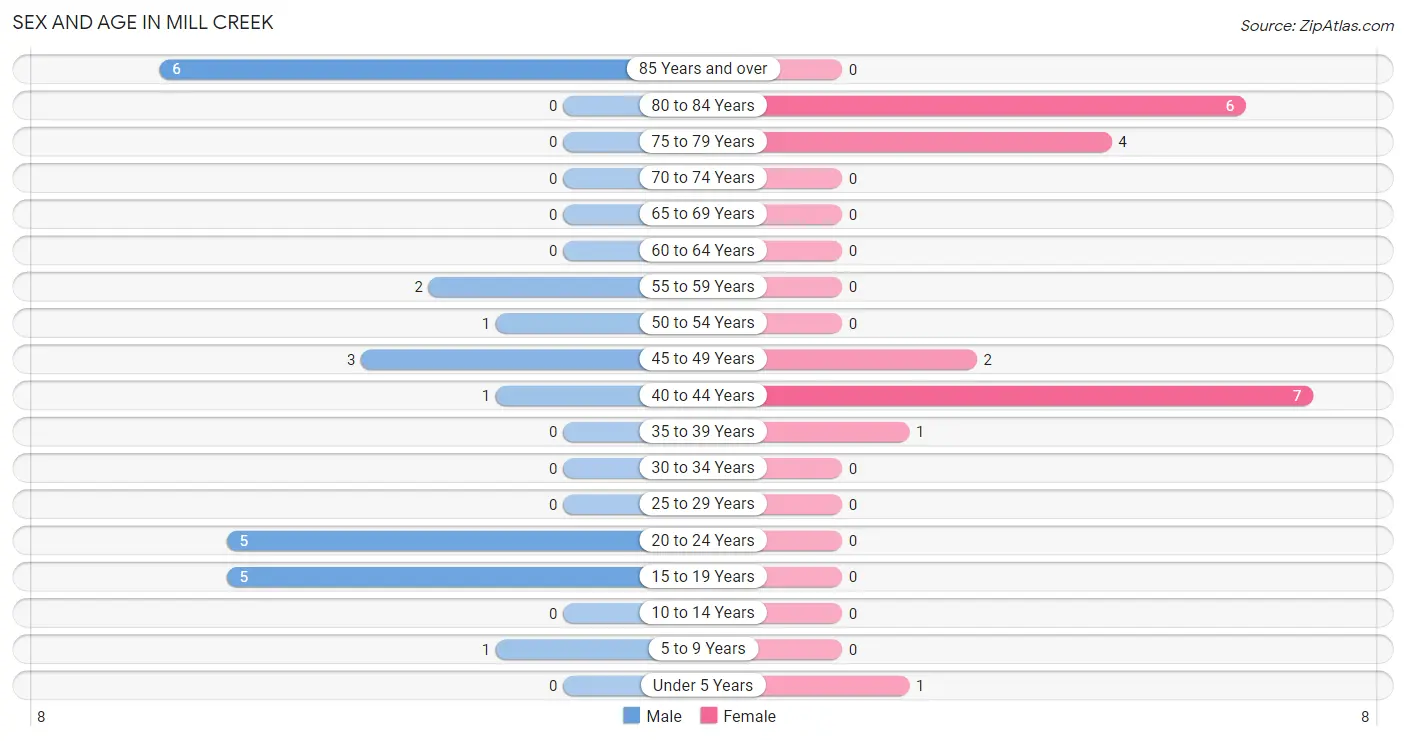
| Age Bracket | Male | Female |
| Under 5 Years | 0 (0.0%) | 1 (4.8%) |
| 5 to 9 Years | 1 (4.2%) | 0 (0.0%) |
| 10 to 14 Years | 0 (0.0%) | 0 (0.0%) |
| 15 to 19 Years | 5 (20.8%) | 0 (0.0%) |
| 20 to 24 Years | 5 (20.8%) | 0 (0.0%) |
| 25 to 29 Years | 0 (0.0%) | 0 (0.0%) |
| 30 to 34 Years | 0 (0.0%) | 0 (0.0%) |
| 35 to 39 Years | 0 (0.0%) | 1 (4.8%) |
| 40 to 44 Years | 1 (4.2%) | 7 (33.3%) |
| 45 to 49 Years | 3 (12.5%) | 2 (9.5%) |
| 50 to 54 Years | 1 (4.2%) | 0 (0.0%) |
| 55 to 59 Years | 2 (8.3%) | 0 (0.0%) |
| 60 to 64 Years | 0 (0.0%) | 0 (0.0%) |
| 65 to 69 Years | 0 (0.0%) | 0 (0.0%) |
| 70 to 74 Years | 0 (0.0%) | 0 (0.0%) |
| 75 to 79 Years | 0 (0.0%) | 4 (19.1%) |
| 80 to 84 Years | 0 (0.0%) | 6 (28.6%) |
| 85 Years and over | 6 (25.0%) | 0 (0.0%) |
| Total | 24 (100.0%) | 21 (100.0%) |
Families and Households in Mill Creek
Median Family Size in Mill Creek
The median family size in Mill Creek is 2.81 persons per family, with single male/father families (2 | 12.5%) accounting for the largest median family size of 7 persons per family. On the other hand, single female/mother families (8 | 50.0%) represent the smallest median family size with 2.00 persons per family.
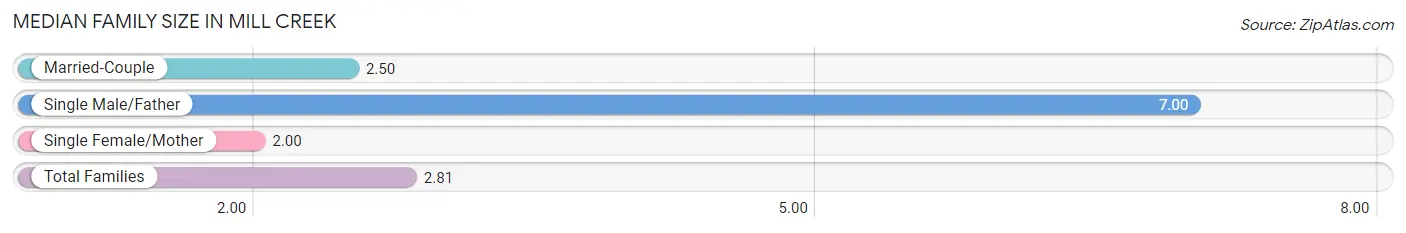
| Family Type | # Families | Family Size |
| Married-Couple | 6 (37.5%) | 2.50 |
| Single Male/Father | 2 (12.5%) | 7.00 |
| Single Female/Mother | 8 (50.0%) | 2.00 |
| Total Families | 16 (100.0%) | 2.81 |
Median Household Size in Mill Creek
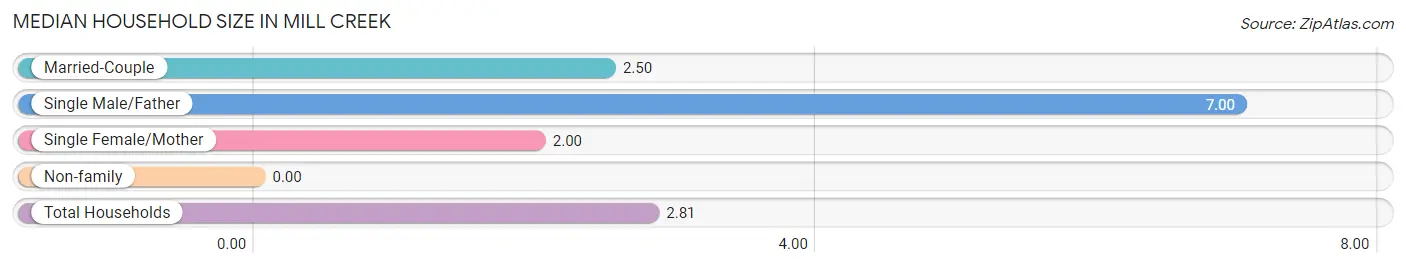
| Household Type | # Households | Household Size |
| Married-Couple | 6 (37.5%) | 2.50 |
| Single Male/Father | 2 (12.5%) | 7.00 |
| Single Female/Mother | 8 (50.0%) | 2.00 |
| Non-family | 0 (0.0%) | - |
| Total Households | 16 (100.0%) | 2.81 |
Household Size by Marriage Status in Mill Creek
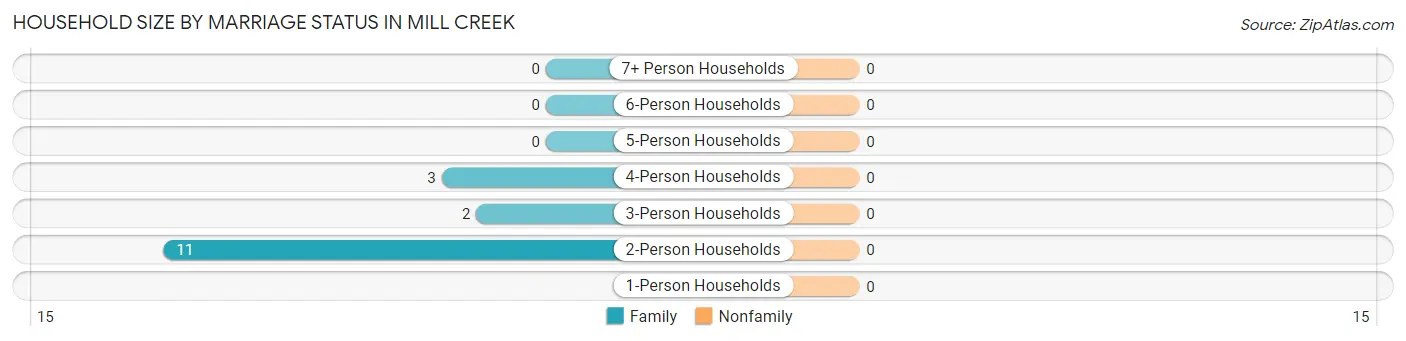
| Household Size | Family Households | Nonfamily Households |
| 1-Person Households | - | 0 (0.0%) |
| 2-Person Households | 11 (68.8%) | 0 (0.0%) |
| 3-Person Households | 2 (12.5%) | 0 (0.0%) |
| 4-Person Households | 3 (18.8%) | 0 (0.0%) |
| 5-Person Households | 0 (0.0%) | 0 (0.0%) |
| 6-Person Households | 0 (0.0%) | 0 (0.0%) |
| 7+ Person Households | 0 (0.0%) | 0 (0.0%) |
| Total | 16 (100.0%) | 0 (0.0%) |
Female Fertility in Mill Creek
Fertility by Age in Mill Creek
| Age Bracket | Women with Births | Births / 1,000 Women |
| 15 to 19 years | 0 (0.0%) | 0.0 |
| 20 to 34 years | 0 (0.0%) | 0.0 |
| 35 to 50 years | 0 (0.0%) | 0.0 |
| Total | 0 (0.0%) | 0.0 |
Fertility by Age by Marriage Status in Mill Creek
| Age Bracket | Married | Unmarried |
| 15 to 19 years | 0 (0.0%) | 0 (0.0%) |
| 20 to 34 years | 0 (0.0%) | 0 (0.0%) |
| 35 to 50 years | 0 (0.0%) | 0 (0.0%) |
| Total | 0 (0.0%) | 0 (0.0%) |
Fertility by Education in Mill Creek
| Educational Attainment | Women with Births | Births / 1,000 Women |
| Less than High School | 0 (0.0%) | 0.0 |
| High School Diploma | 0 (0.0%) | 0.0 |
| College or Associate's Degree | 0 (0.0%) | 0.0 |
| Bachelor's Degree | 0 (0.0%) | 0.0 |
| Graduate Degree | 0 (0.0%) | 0.0 |
| Total | 0 (0.0%) | 0.0 |
Fertility by Education by Marriage Status in Mill Creek
| Educational Attainment | Married | Unmarried |
| Less than High School | 0 (0.0%) | 0 (0.0%) |
| High School Diploma | 0 (0.0%) | 0 (0.0%) |
| College or Associate's Degree | 0 (0.0%) | 0 (0.0%) |
| Bachelor's Degree | 0 (0.0%) | 0 (0.0%) |
| Graduate Degree | 0 (0.0%) | 0 (0.0%) |
| Total | 0 (0.0%) | 0 (0.0%) |
Employment Characteristics in Mill Creek
Employment by Class of Employer in Mill Creek
Among the 12 employed individuals in Mill Creek, private company employees (7 | 58.3%), self-employed (not incorporated) (4 | 33.3%), and state government employees (1 | 8.3%) make up the most common classes of employment.
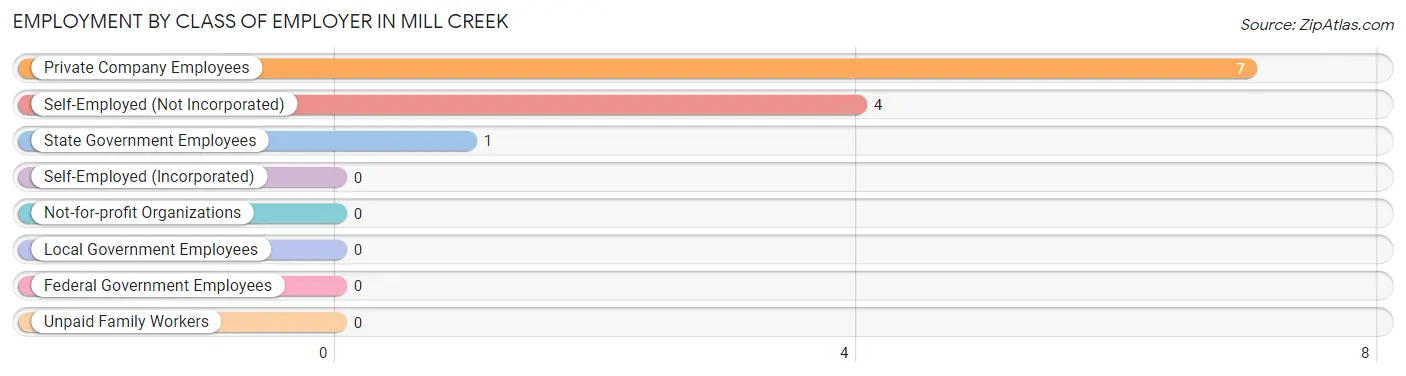
| Employer Class | # Employees | % Employees |
| Private Company Employees | 7 | 58.3% |
| Self-Employed (Incorporated) | 0 | 0.0% |
| Self-Employed (Not Incorporated) | 4 | 33.3% |
| Not-for-profit Organizations | 0 | 0.0% |
| Local Government Employees | 0 | 0.0% |
| State Government Employees | 1 | 8.3% |
| Federal Government Employees | 0 | 0.0% |
| Unpaid Family Workers | 0 | 0.0% |
| Total | 12 | 100.0% |
Employment Status by Age in Mill Creek
According to the labor force statistics for Mill Creek, out of the total population over 16 years of age (43), 41.9% or 18 individuals are in the labor force, with 22.2% or 4 of them unemployed. The age group with the highest labor force participation rate is 35 to 44 years, with 100.0% or 9 individuals in the labor force. Within the labor force, the 20 to 24 years age range has the highest percentage of unemployed individuals, with 100.0% or 1 of them being unemployed.
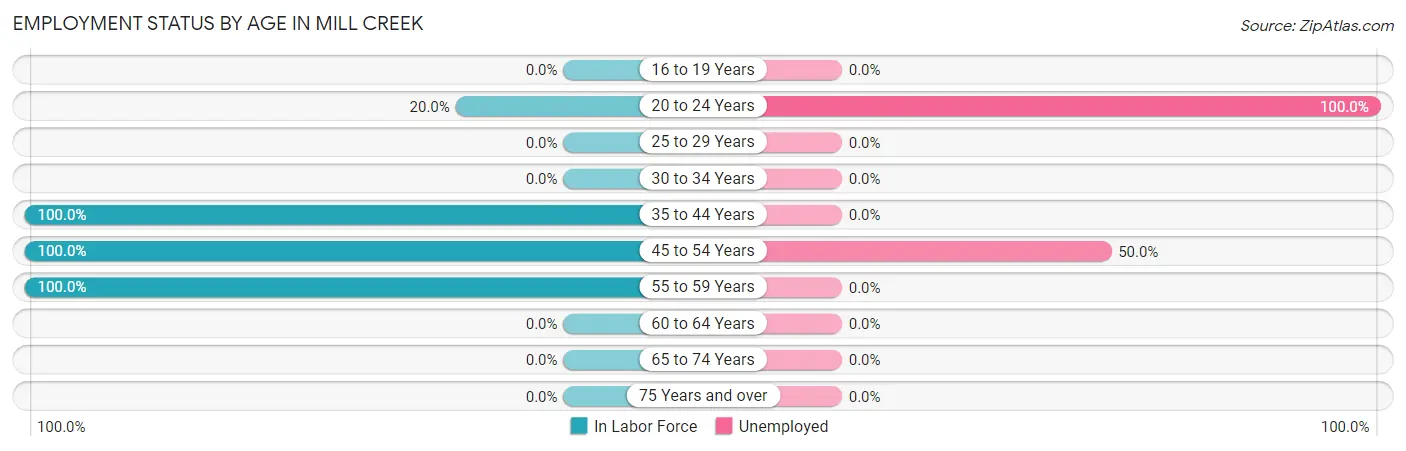
| Age Bracket | In Labor Force | Unemployed |
| 16 to 19 Years | 0 (0.0%) | 0 (0.0%) |
| 20 to 24 Years | 1 (20.0%) | 1 (100.0%) |
| 25 to 29 Years | 0 (0.0%) | 0 (0.0%) |
| 30 to 34 Years | 0 (0.0%) | 0 (0.0%) |
| 35 to 44 Years | 9 (100.0%) | 0 (0.0%) |
| 45 to 54 Years | 6 (100.0%) | 3 (50.0%) |
| 55 to 59 Years | 2 (100.0%) | 0 (0.0%) |
| 60 to 64 Years | 0 (0.0%) | 0 (0.0%) |
| 65 to 74 Years | 0 (0.0%) | 0 (0.0%) |
| 75 Years and over | 0 (0.0%) | 0 (0.0%) |
| Total | 18 (41.9%) | 4 (22.2%) |
Employment Status by Educational Attainment in Mill Creek
According to labor force statistics for Mill Creek, 100.0% of individuals (17) out of the total population between 25 and 64 years of age (17) are in the labor force, with 17.6% or 3 of them being unemployed. The group with the highest labor force participation rate are those with the educational attainment of high school diploma, with 100.0% or 8 individuals in the labor force. Within the labor force, individuals with college / associate degree education have the highest percentage of unemployment, with 100.0% or 3 of them being unemployed.
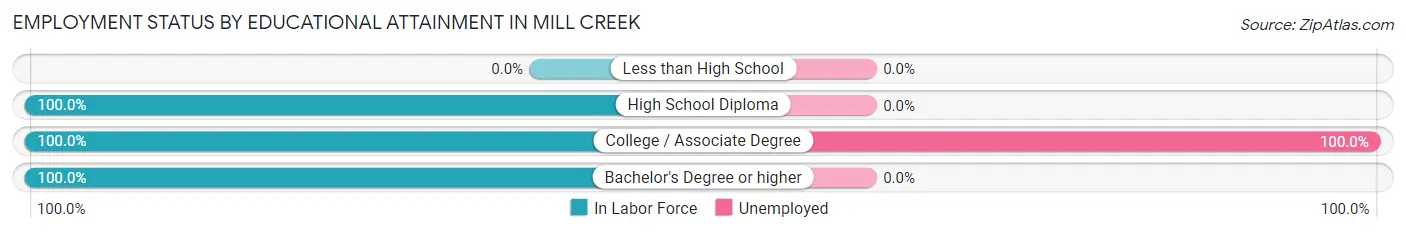
| Educational Attainment | In Labor Force | Unemployed |
| Less than High School | 0 (0.0%) | 0 (0.0%) |
| High School Diploma | 8 (100.0%) | 0 (0.0%) |
| College / Associate Degree | 3 (100.0%) | 3 (100.0%) |
| Bachelor's Degree or higher | 6 (100.0%) | 0 (0.0%) |
| Total | 17 (100.0%) | 3 (17.6%) |
Employment Occupations by Sex in Mill Creek
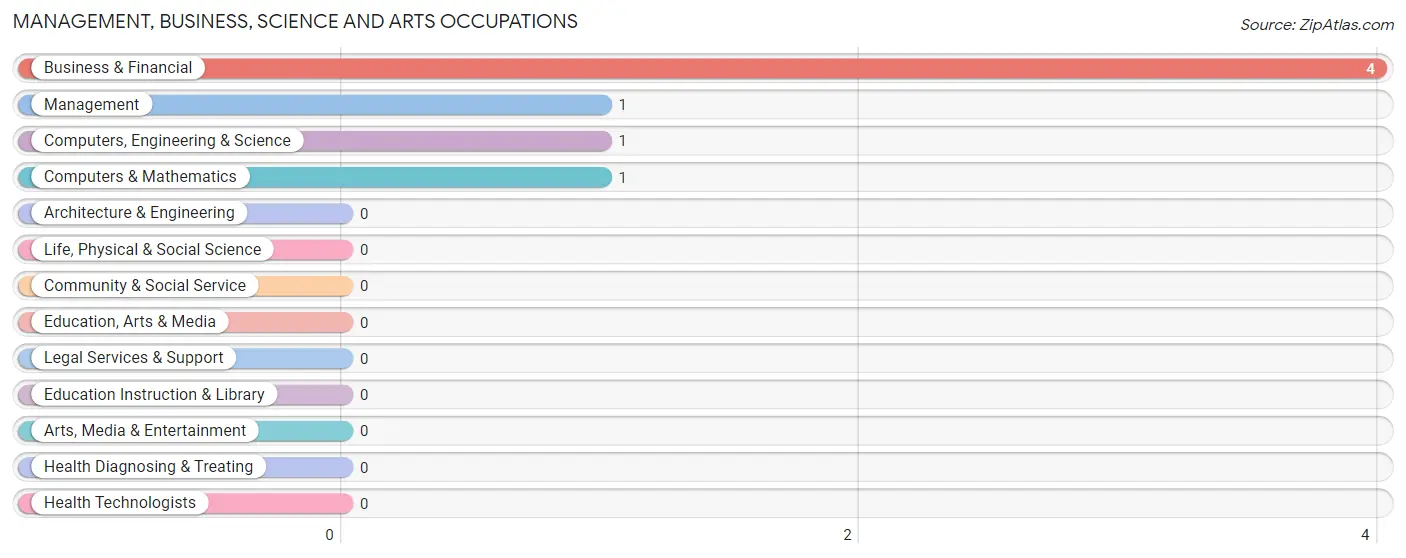
Management, Business, Science and Arts Occupations
The most common Management, Business, Science and Arts occupations in Mill Creek are Business & Financial (4 | 28.6%), Management (1 | 7.1%), Computers, Engineering & Science (1 | 7.1%), and Computers & Mathematics (1 | 7.1%).
Management, Business, Science and Arts Occupations by Sex
Within the Management, Business, Science and Arts occupations in Mill Creek, the most male-oriented occupations are Computers, Engineering & Science (100.0%), and Computers & Mathematics (100.0%), while the most female-oriented occupations are Management (100.0%), and Business & Financial (100.0%).
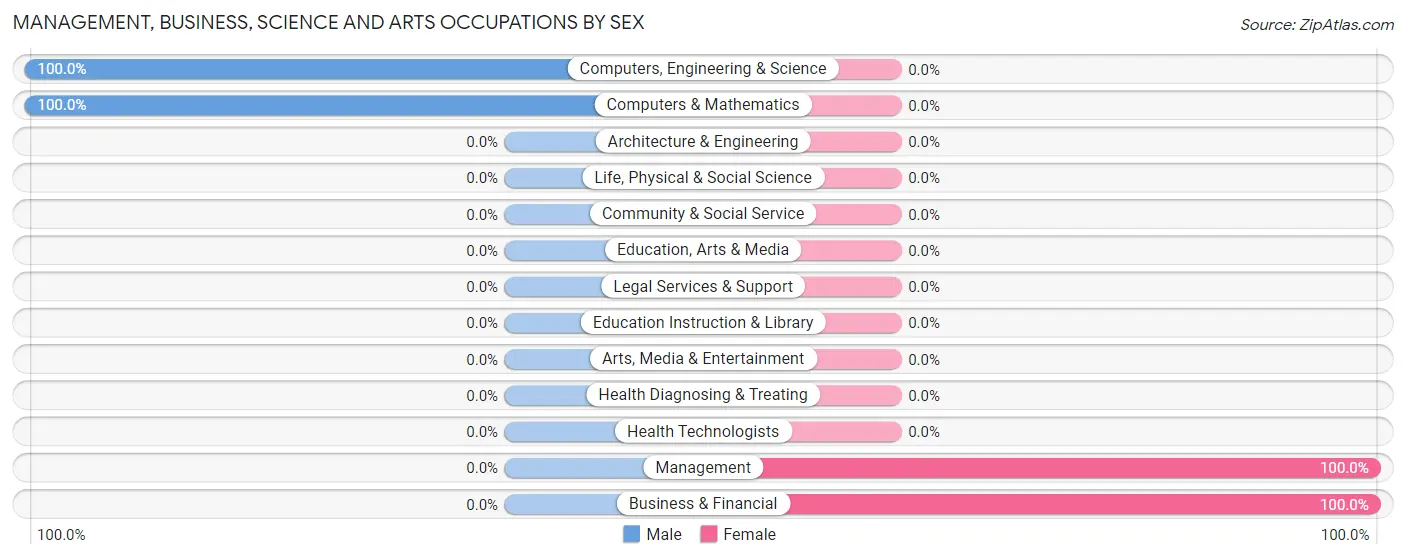
| Occupation | Male | Female |
| Management | 0 (0.0%) | 1 (100.0%) |
| Business & Financial | 0 (0.0%) | 4 (100.0%) |
| Computers, Engineering & Science | 1 (100.0%) | 0 (0.0%) |
| Computers & Mathematics | 1 (100.0%) | 0 (0.0%) |
| Architecture & Engineering | 0 (0.0%) | 0 (0.0%) |
| Life, Physical & Social Science | 0 (0.0%) | 0 (0.0%) |
| Community & Social Service | 0 (0.0%) | 0 (0.0%) |
| Education, Arts & Media | 0 (0.0%) | 0 (0.0%) |
| Legal Services & Support | 0 (0.0%) | 0 (0.0%) |
| Education Instruction & Library | 0 (0.0%) | 0 (0.0%) |
| Arts, Media & Entertainment | 0 (0.0%) | 0 (0.0%) |
| Health Diagnosing & Treating | 0 (0.0%) | 0 (0.0%) |
| Health Technologists | 0 (0.0%) | 0 (0.0%) |
| Total (Category) | 1 (16.7%) | 5 (83.3%) |
| Total (Overall) | 4 (28.6%) | 10 (71.4%) |
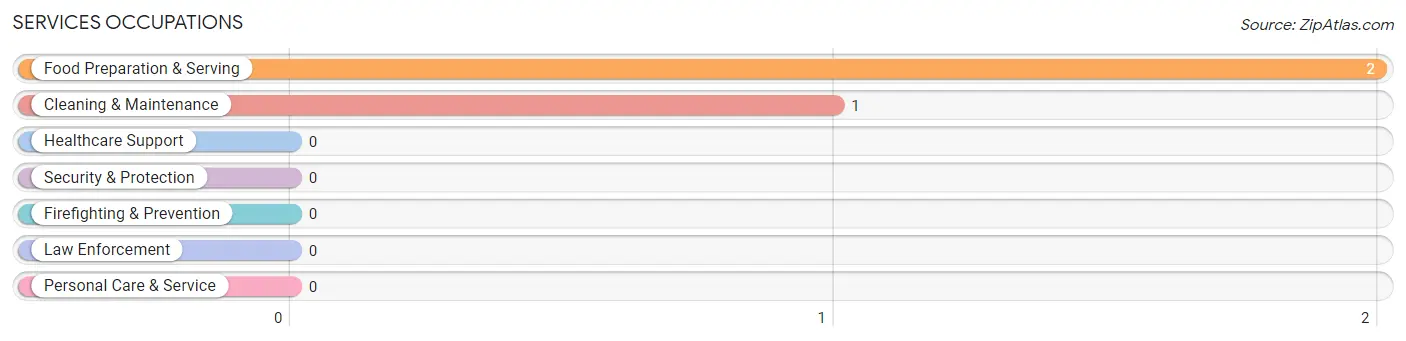
Services Occupations
The most common Services occupations in Mill Creek are Food Preparation & Serving (2 | 14.3%), and Cleaning & Maintenance (1 | 7.1%).
Services Occupations by Sex
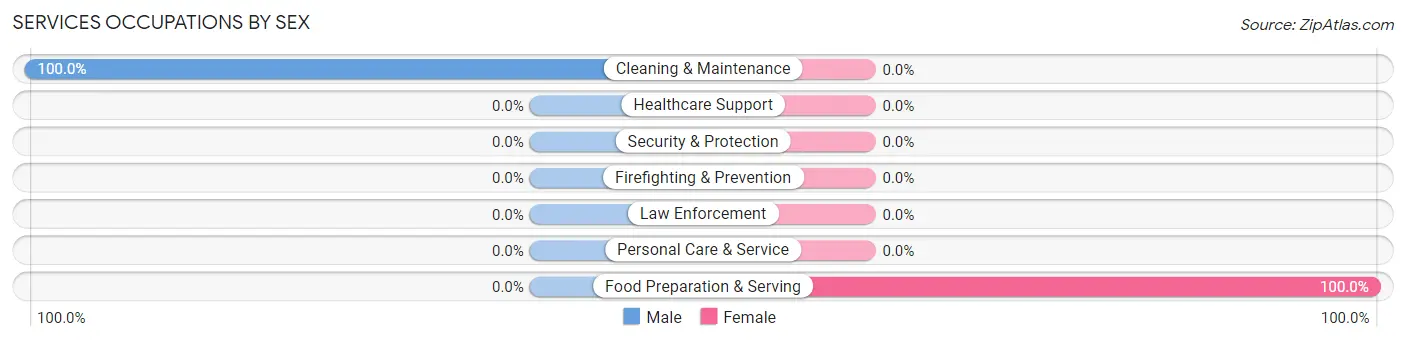
| Occupation | Male | Female |
| Healthcare Support | 0 (0.0%) | 0 (0.0%) |
| Security & Protection | 0 (0.0%) | 0 (0.0%) |
| Firefighting & Prevention | 0 (0.0%) | 0 (0.0%) |
| Law Enforcement | 0 (0.0%) | 0 (0.0%) |
| Food Preparation & Serving | 0 (0.0%) | 2 (100.0%) |
| Cleaning & Maintenance | 1 (100.0%) | 0 (0.0%) |
| Personal Care & Service | 0 (0.0%) | 0 (0.0%) |
| Total (Category) | 1 (33.3%) | 2 (66.7%) |
| Total (Overall) | 4 (28.6%) | 10 (71.4%) |
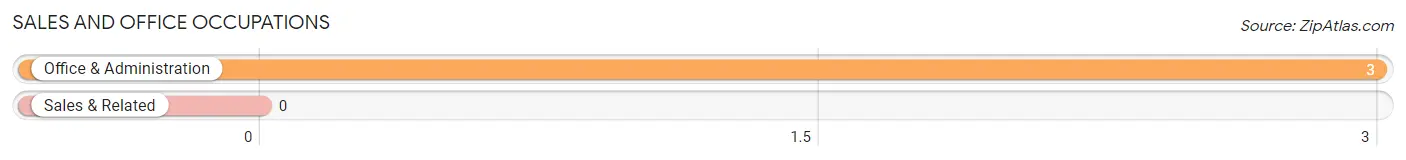
Sales and Office Occupations
The most common Sales and Office occupations in Mill Creek are , and Office & Administration (3 | 21.4%).
Sales and Office Occupations by Sex
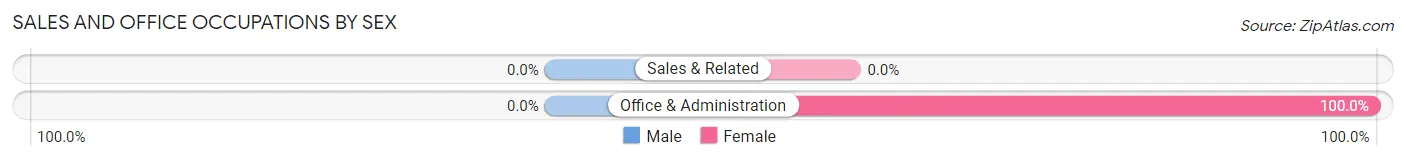
| Occupation | Male | Female |
| Sales & Related | 0 (0.0%) | 0 (0.0%) |
| Office & Administration | 0 (0.0%) | 3 (100.0%) |
| Total (Category) | 0 (0.0%) | 3 (100.0%) |
| Total (Overall) | 4 (28.6%) | 10 (71.4%) |
Natural Resources, Construction and Maintenance Occupations
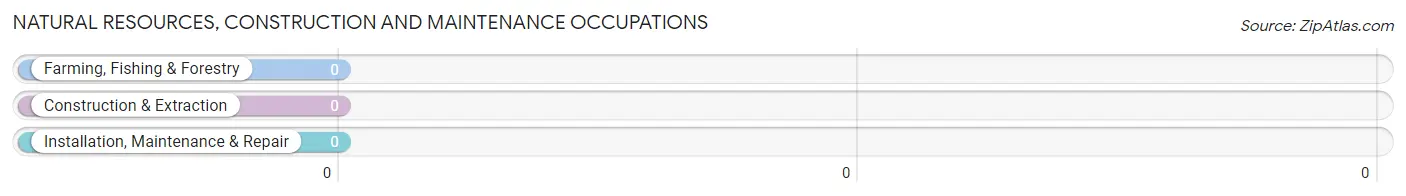
Natural Resources, Construction and Maintenance Occupations by Sex
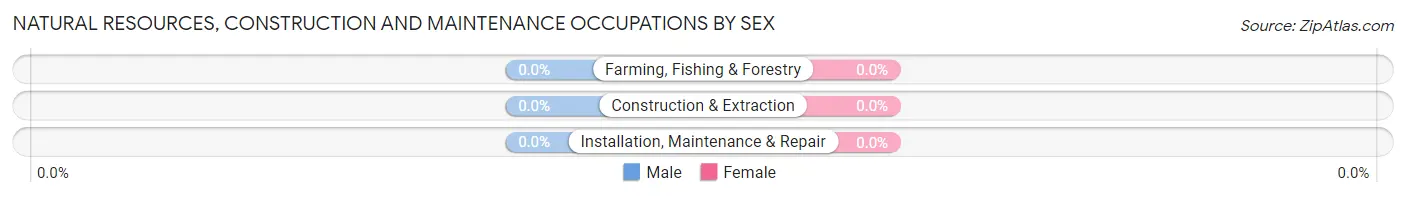
| Occupation | Male | Female |
| Farming, Fishing & Forestry | 0 (0.0%) | 0 (0.0%) |
| Construction & Extraction | 0 (0.0%) | 0 (0.0%) |
| Installation, Maintenance & Repair | 0 (0.0%) | 0 (0.0%) |
| Total (Category) | 0 (0.0%) | 0 (0.0%) |
| Total (Overall) | 4 (28.6%) | 10 (71.4%) |
Production, Transportation and Moving Occupations
The most common Production, Transportation and Moving occupations in Mill Creek are , and Transportation (2 | 14.3%).
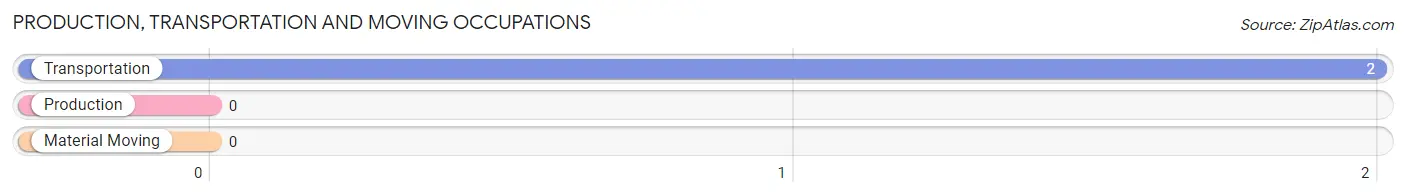
Production, Transportation and Moving Occupations by Sex
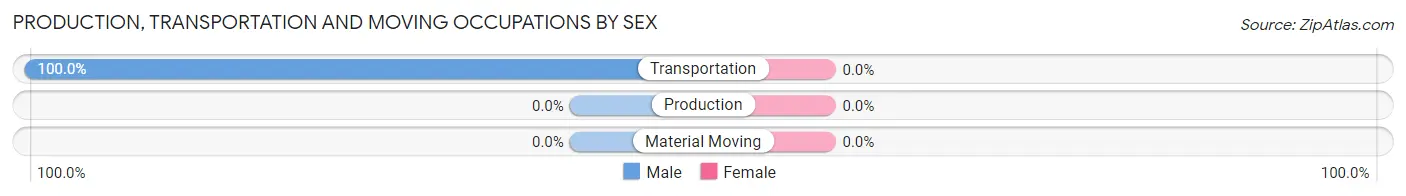
| Occupation | Male | Female |
| Production | 0 (0.0%) | 0 (0.0%) |
| Transportation | 2 (100.0%) | 0 (0.0%) |
| Material Moving | 0 (0.0%) | 0 (0.0%) |
| Total (Category) | 2 (100.0%) | 0 (0.0%) |
| Total (Overall) | 4 (28.6%) | 10 (71.4%) |
Employment Industries by Sex in Mill Creek
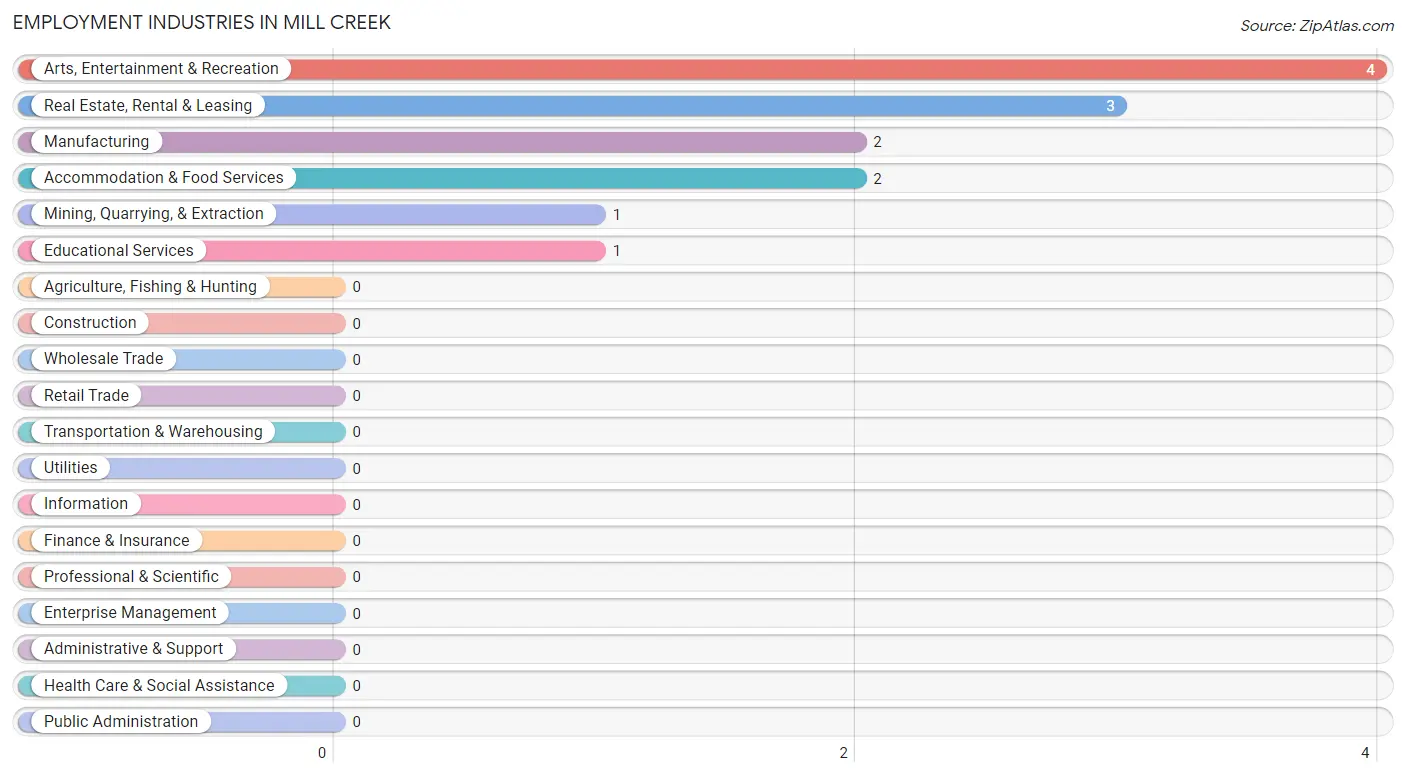
Employment Industries in Mill Creek
The major employment industries in Mill Creek include Arts, Entertainment & Recreation (4 | 28.6%), Real Estate, Rental & Leasing (3 | 21.4%), Manufacturing (2 | 14.3%), Accommodation & Food Services (2 | 14.3%), and Mining, Quarrying, & Extraction (1 | 7.1%).
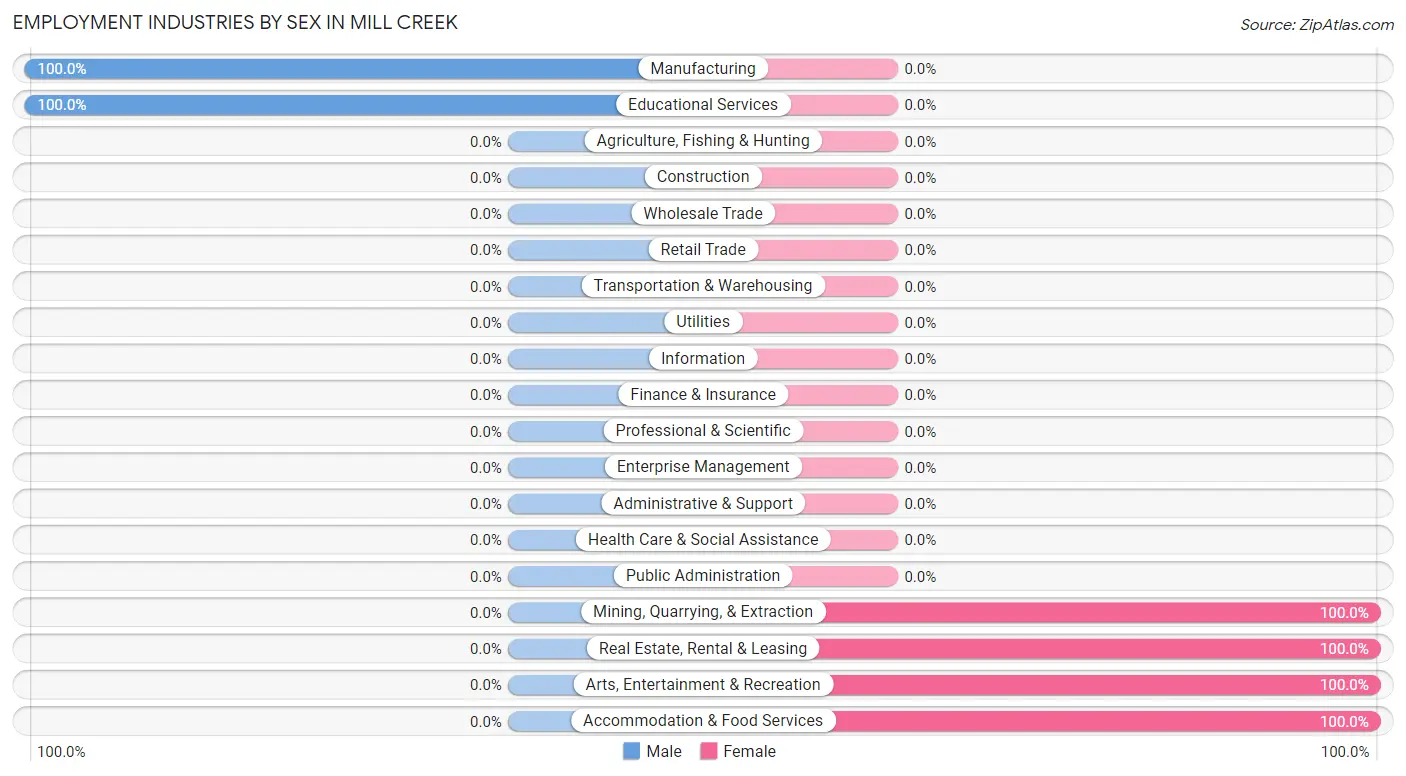
Employment Industries by Sex in Mill Creek
The Mill Creek industries that see more men than women are Manufacturing (100.0%), and Educational Services (100.0%), whereas the industries that tend to have a higher number of women are Mining, Quarrying, & Extraction (100.0%), Real Estate, Rental & Leasing (100.0%), and Arts, Entertainment & Recreation (100.0%).
| Industry | Male | Female |
| Agriculture, Fishing & Hunting | 0 (0.0%) | 0 (0.0%) |
| Mining, Quarrying, & Extraction | 0 (0.0%) | 1 (100.0%) |
| Construction | 0 (0.0%) | 0 (0.0%) |
| Manufacturing | 2 (100.0%) | 0 (0.0%) |
| Wholesale Trade | 0 (0.0%) | 0 (0.0%) |
| Retail Trade | 0 (0.0%) | 0 (0.0%) |
| Transportation & Warehousing | 0 (0.0%) | 0 (0.0%) |
| Utilities | 0 (0.0%) | 0 (0.0%) |
| Information | 0 (0.0%) | 0 (0.0%) |
| Finance & Insurance | 0 (0.0%) | 0 (0.0%) |
| Real Estate, Rental & Leasing | 0 (0.0%) | 3 (100.0%) |
| Professional & Scientific | 0 (0.0%) | 0 (0.0%) |
| Enterprise Management | 0 (0.0%) | 0 (0.0%) |
| Administrative & Support | 0 (0.0%) | 0 (0.0%) |
| Educational Services | 1 (100.0%) | 0 (0.0%) |
| Health Care & Social Assistance | 0 (0.0%) | 0 (0.0%) |
| Arts, Entertainment & Recreation | 0 (0.0%) | 4 (100.0%) |
| Accommodation & Food Services | 0 (0.0%) | 2 (100.0%) |
| Public Administration | 0 (0.0%) | 0 (0.0%) |
| Total | 4 (28.6%) | 10 (71.4%) |
Education in Mill Creek
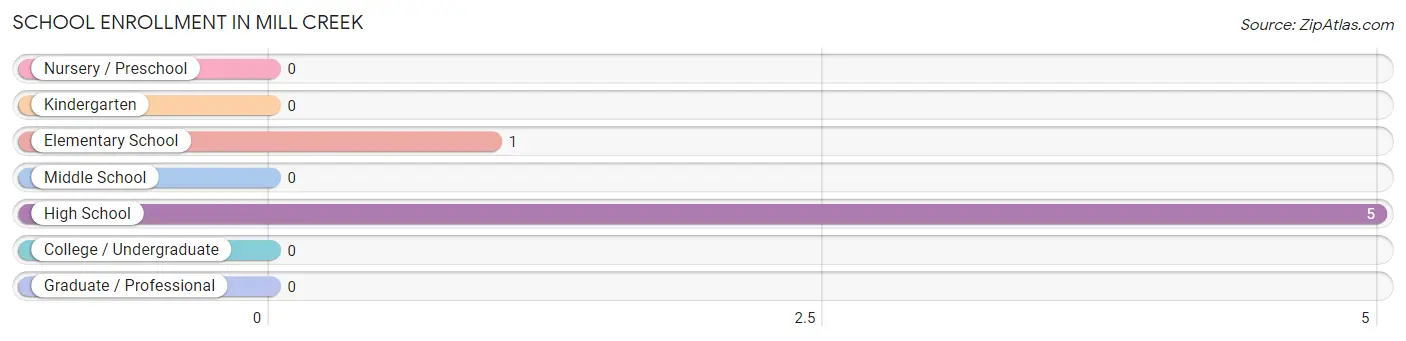
School Enrollment in Mill Creek
The most common levels of schooling among the 6 students in Mill Creek are high school (5 | 83.3%), and elementary school (1 | 16.7%).
| School Level | # Students | % Students |
| Nursery / Preschool | 0 | 0.0% |
| Kindergarten | 0 | 0.0% |
| Elementary School | 1 | 16.7% |
| Middle School | 0 | 0.0% |
| High School | 5 | 83.3% |
| College / Undergraduate | 0 | 0.0% |
| Graduate / Professional | 0 | 0.0% |
| Total | 6 | 100.0% |
School Enrollment by Age by Funding Source in Mill Creek
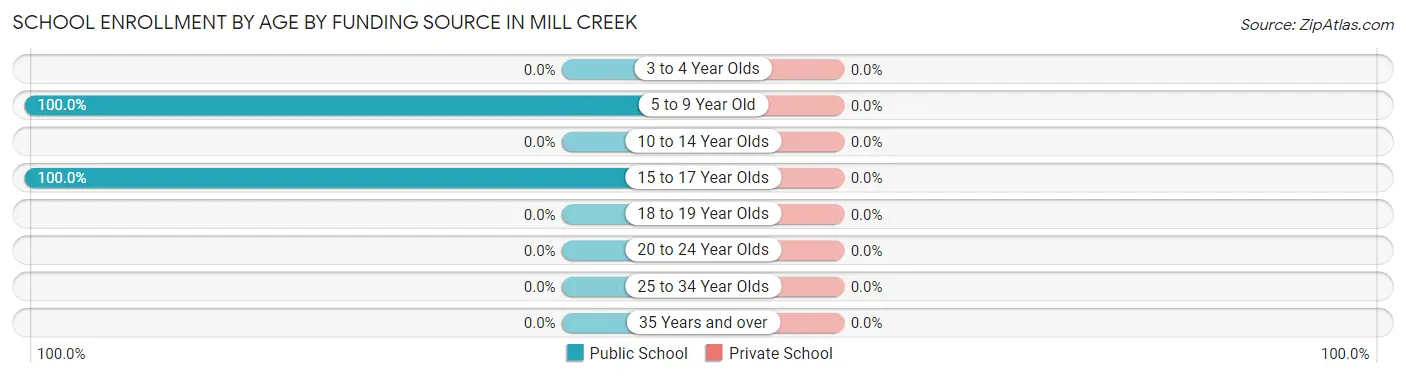
| Age Bracket | Public School | Private School |
| 3 to 4 Year Olds | 0 (0.0%) | 0 (0.0%) |
| 5 to 9 Year Old | 1 (100.0%) | 0 (0.0%) |
| 10 to 14 Year Olds | 0 (0.0%) | 0 (0.0%) |
| 15 to 17 Year Olds | 5 (100.0%) | 0 (0.0%) |
| 18 to 19 Year Olds | 0 (0.0%) | 0 (0.0%) |
| 20 to 24 Year Olds | 0 (0.0%) | 0 (0.0%) |
| 25 to 34 Year Olds | 0 (0.0%) | 0 (0.0%) |
| 35 Years and over | 0 (0.0%) | 0 (0.0%) |
| Total | 6 (100.0%) | 0 (0.0%) |
Educational Attainment by Field of Study in Mill Creek
Education (4 | 40.0%), arts & humanities (4 | 40.0%), computers & mathematics (1 | 10.0%), and bio, nature & agricultural (1 | 10.0%) are the most common fields of study among 10 individuals in Mill Creek who have obtained a bachelor's degree or higher.
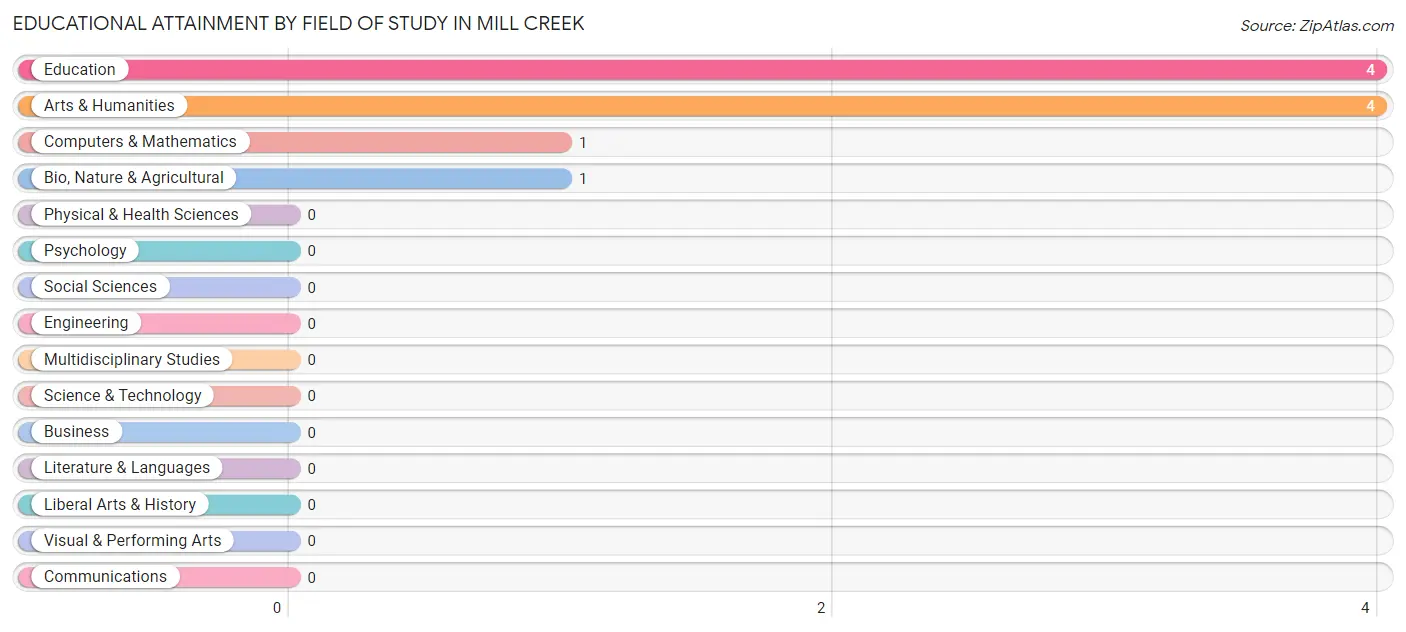
| Field of Study | # Graduates | % Graduates |
| Computers & Mathematics | 1 | 10.0% |
| Bio, Nature & Agricultural | 1 | 10.0% |
| Physical & Health Sciences | 0 | 0.0% |
| Psychology | 0 | 0.0% |
| Social Sciences | 0 | 0.0% |
| Engineering | 0 | 0.0% |
| Multidisciplinary Studies | 0 | 0.0% |
| Science & Technology | 0 | 0.0% |
| Business | 0 | 0.0% |
| Education | 4 | 40.0% |
| Literature & Languages | 0 | 0.0% |
| Liberal Arts & History | 0 | 0.0% |
| Visual & Performing Arts | 0 | 0.0% |
| Communications | 0 | 0.0% |
| Arts & Humanities | 4 | 40.0% |
| Total | 10 | 100.0% |
Transportation & Commute in Mill Creek
Vehicle Availability by Sex in Mill Creek
The most prevalent vehicle ownership categories in Mill Creek are males with 2 vehicles (1, accounting for 50.0%) and females with 2 vehicles (4, making up 10.0%).
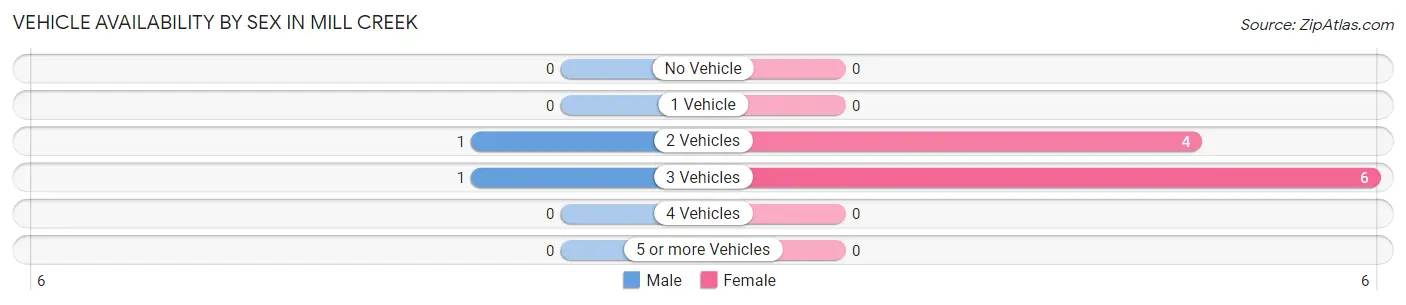
| Vehicles Available | Male | Female |
| No Vehicle | 0 (0.0%) | 0 (0.0%) |
| 1 Vehicle | 0 (0.0%) | 0 (0.0%) |
| 2 Vehicles | 1 (50.0%) | 4 (40.0%) |
| 3 Vehicles | 1 (50.0%) | 6 (60.0%) |
| 4 Vehicles | 0 (0.0%) | 0 (0.0%) |
| 5 or more Vehicles | 0 (0.0%) | 0 (0.0%) |
| Total | 2 (100.0%) | 10 (100.0%) |
Commute Time in Mill Creek
The most frequently occuring commute durations in Mill Creek are 25 to 29 minutes (3 commuters, 37.5%), 45 to 59 minutes (2 commuters, 25.0%), and 15 to 19 minutes (1 commuters, 12.5%).
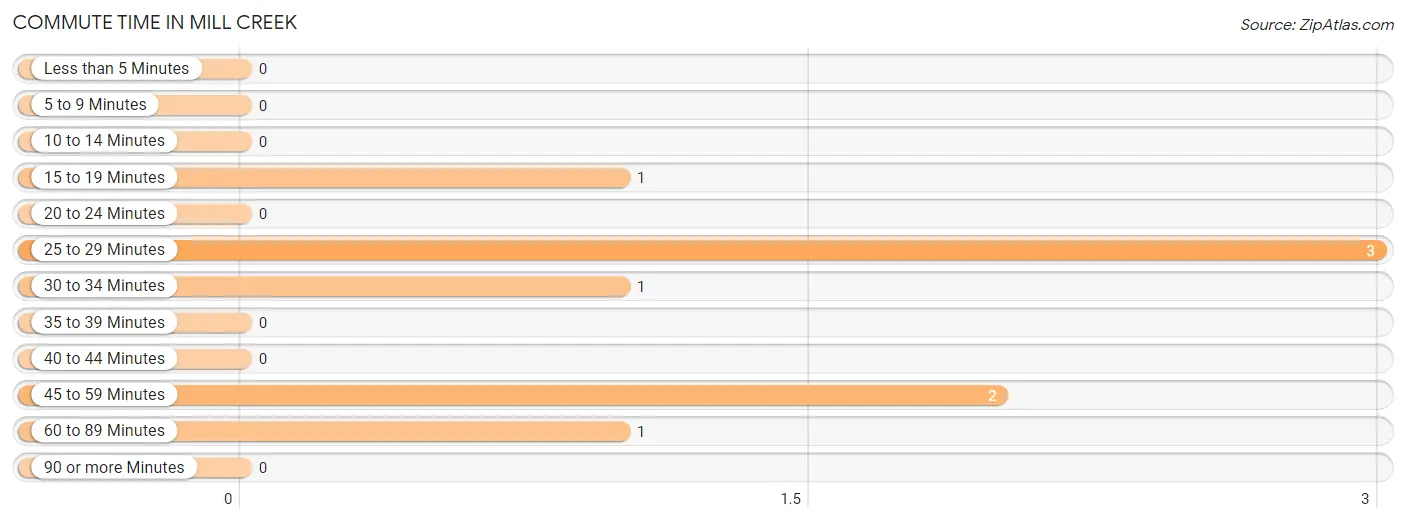
| Commute Time | # Commuters | % Commuters |
| Less than 5 Minutes | 0 | 0.0% |
| 5 to 9 Minutes | 0 | 0.0% |
| 10 to 14 Minutes | 0 | 0.0% |
| 15 to 19 Minutes | 1 | 12.5% |
| 20 to 24 Minutes | 0 | 0.0% |
| 25 to 29 Minutes | 3 | 37.5% |
| 30 to 34 Minutes | 1 | 12.5% |
| 35 to 39 Minutes | 0 | 0.0% |
| 40 to 44 Minutes | 0 | 0.0% |
| 45 to 59 Minutes | 2 | 25.0% |
| 60 to 89 Minutes | 1 | 12.5% |
| 90 or more Minutes | 0 | 0.0% |
Commute Time by Sex in Mill Creek
The most common commute times in Mill Creek are 30 to 34 minutes (1 commuters, 50.0%) for males and 25 to 29 minutes (3 commuters, 50.0%) for females.
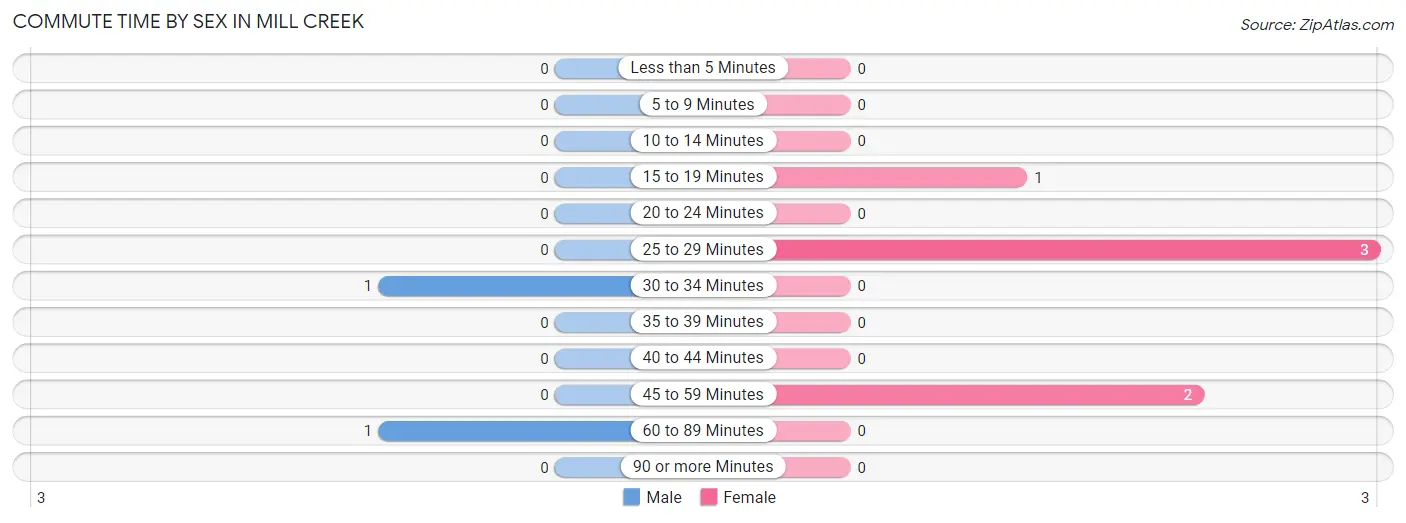
| Commute Time | Male | Female |
| Less than 5 Minutes | 0 (0.0%) | 0 (0.0%) |
| 5 to 9 Minutes | 0 (0.0%) | 0 (0.0%) |
| 10 to 14 Minutes | 0 (0.0%) | 0 (0.0%) |
| 15 to 19 Minutes | 0 (0.0%) | 1 (16.7%) |
| 20 to 24 Minutes | 0 (0.0%) | 0 (0.0%) |
| 25 to 29 Minutes | 0 (0.0%) | 3 (50.0%) |
| 30 to 34 Minutes | 1 (50.0%) | 0 (0.0%) |
| 35 to 39 Minutes | 0 (0.0%) | 0 (0.0%) |
| 40 to 44 Minutes | 0 (0.0%) | 0 (0.0%) |
| 45 to 59 Minutes | 0 (0.0%) | 2 (33.3%) |
| 60 to 89 Minutes | 1 (50.0%) | 0 (0.0%) |
| 90 or more Minutes | 0 (0.0%) | 0 (0.0%) |
Time of Departure to Work by Sex in Mill Creek
The most frequent times of departure to work in Mill Creek are 6:30 AM to 6:59 AM (1, 50.0%) for males and 6:00 AM to 6:29 AM (5, 83.3%) for females.
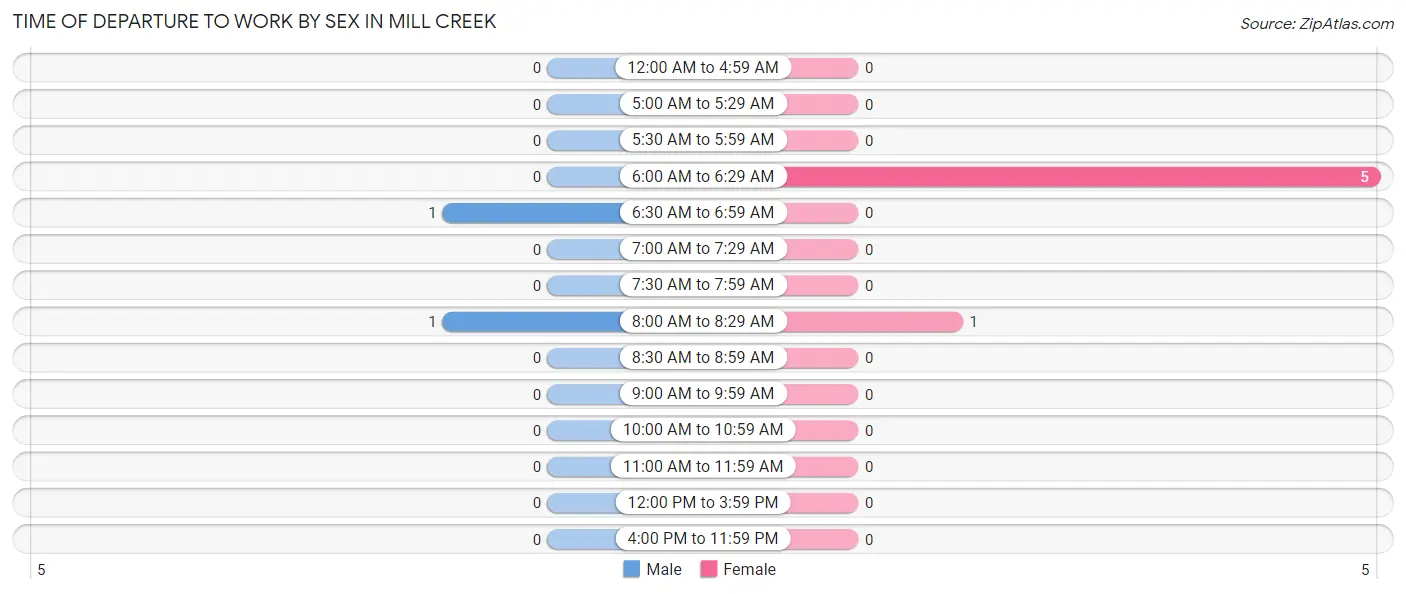
| Time of Departure | Male | Female |
| 12:00 AM to 4:59 AM | 0 (0.0%) | 0 (0.0%) |
| 5:00 AM to 5:29 AM | 0 (0.0%) | 0 (0.0%) |
| 5:30 AM to 5:59 AM | 0 (0.0%) | 0 (0.0%) |
| 6:00 AM to 6:29 AM | 0 (0.0%) | 5 (83.3%) |
| 6:30 AM to 6:59 AM | 1 (50.0%) | 0 (0.0%) |
| 7:00 AM to 7:29 AM | 0 (0.0%) | 0 (0.0%) |
| 7:30 AM to 7:59 AM | 0 (0.0%) | 0 (0.0%) |
| 8:00 AM to 8:29 AM | 1 (50.0%) | 1 (16.7%) |
| 8:30 AM to 8:59 AM | 0 (0.0%) | 0 (0.0%) |
| 9:00 AM to 9:59 AM | 0 (0.0%) | 0 (0.0%) |
| 10:00 AM to 10:59 AM | 0 (0.0%) | 0 (0.0%) |
| 11:00 AM to 11:59 AM | 0 (0.0%) | 0 (0.0%) |
| 12:00 PM to 3:59 PM | 0 (0.0%) | 0 (0.0%) |
| 4:00 PM to 11:59 PM | 0 (0.0%) | 0 (0.0%) |
| Total | 2 (100.0%) | 6 (100.0%) |
Housing Occupancy in Mill Creek
Occupancy by Ownership in Mill Creek
Of the total 16 dwellings in Mill Creek, owner-occupied units account for 16 (100.0%), while renter-occupied units make up 0 (0.0%).
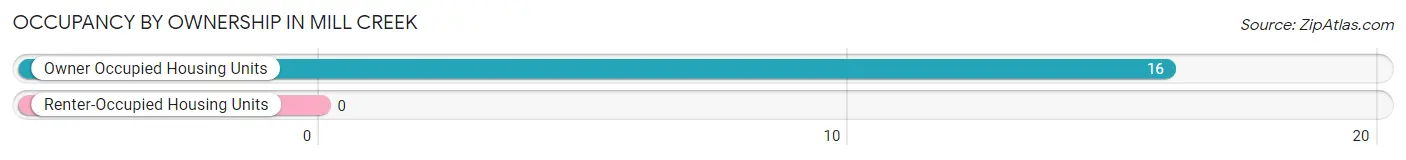
| Occupancy | # Housing Units | % Housing Units |
| Owner Occupied Housing Units | 16 | 100.0% |
| Renter-Occupied Housing Units | 0 | 0.0% |
| Total Occupied Housing Units | 16 | 100.0% |
Occupancy by Household Size in Mill Creek
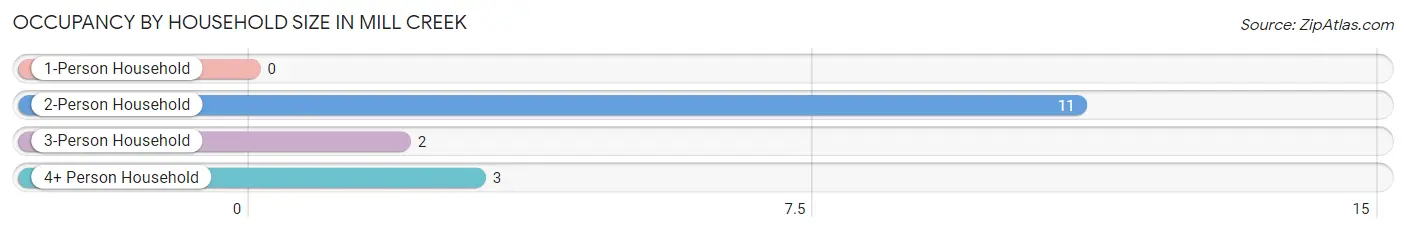
| Household Size | # Housing Units | % Housing Units |
| 1-Person Household | 0 | 0.0% |
| 2-Person Household | 11 | 68.8% |
| 3-Person Household | 2 | 12.5% |
| 4+ Person Household | 3 | 18.8% |
| Total Housing Units | 16 | 100.0% |
Occupancy by Ownership by Household Size in Mill Creek
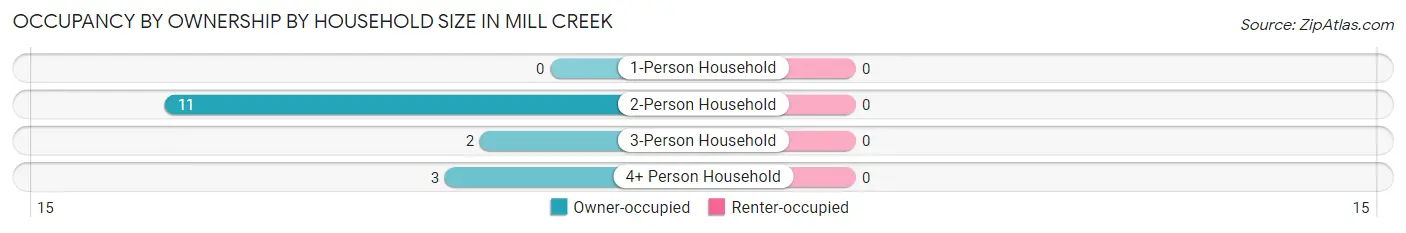
| Household Size | Owner-occupied | Renter-occupied |
| 1-Person Household | 0 (0.0%) | 0 (0.0%) |
| 2-Person Household | 11 (100.0%) | 0 (0.0%) |
| 3-Person Household | 2 (100.0%) | 0 (0.0%) |
| 4+ Person Household | 3 (100.0%) | 0 (0.0%) |
| Total Housing Units | 16 (100.0%) | 0 (0.0%) |
Occupancy by Educational Attainment in Mill Creek
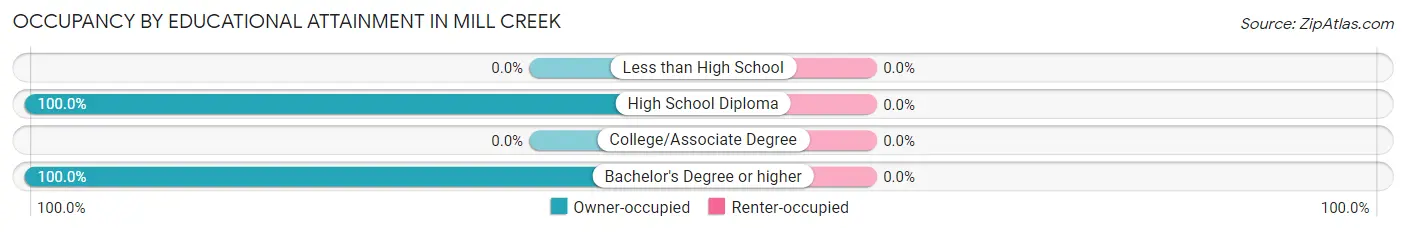
| Household Size | Owner-occupied | Renter-occupied |
| Less than High School | 0 (0.0%) | 0 (0.0%) |
| High School Diploma | 7 (100.0%) | 0 (0.0%) |
| College/Associate Degree | 0 (0.0%) | 0 (0.0%) |
| Bachelor's Degree or higher | 9 (100.0%) | 0 (0.0%) |
Occupancy by Age of Householder in Mill Creek
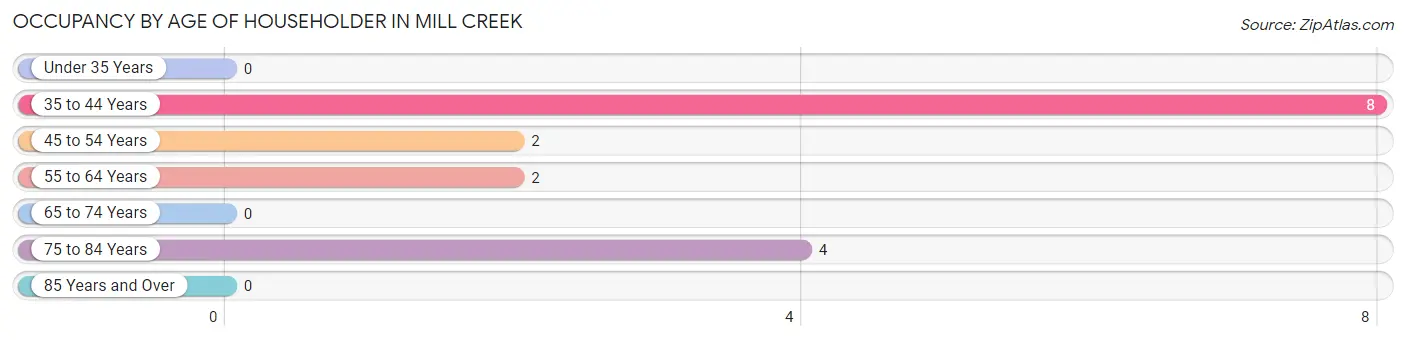
| Age Bracket | # Households | % Households |
| Under 35 Years | 0 | 0.0% |
| 35 to 44 Years | 8 | 50.0% |
| 45 to 54 Years | 2 | 12.5% |
| 55 to 64 Years | 2 | 12.5% |
| 65 to 74 Years | 0 | 0.0% |
| 75 to 84 Years | 4 | 25.0% |
| 85 Years and Over | 0 | 0.0% |
| Total | 16 | 100.0% |
Housing Finances in Mill Creek
Median Income by Occupancy in Mill Creek
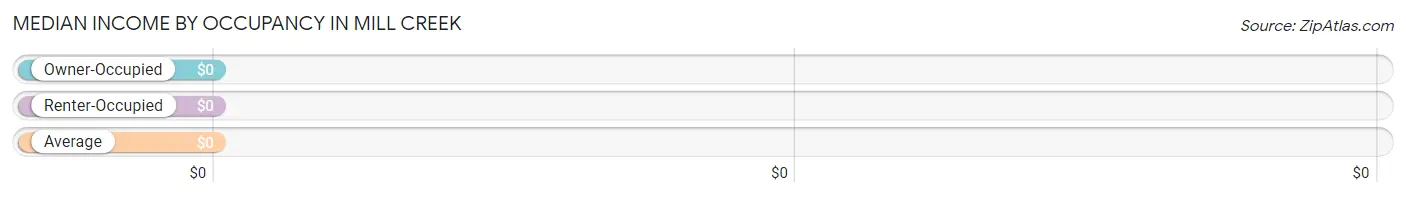
| Occupancy Type | # Households | Median Income |
| Owner-Occupied | 16 (100.0%) | $0 |
| Renter-Occupied | 0 (0.0%) | $0 |
| Average | 16 (100.0%) | $0 |
Occupancy by Householder Income Bracket in Mill Creek
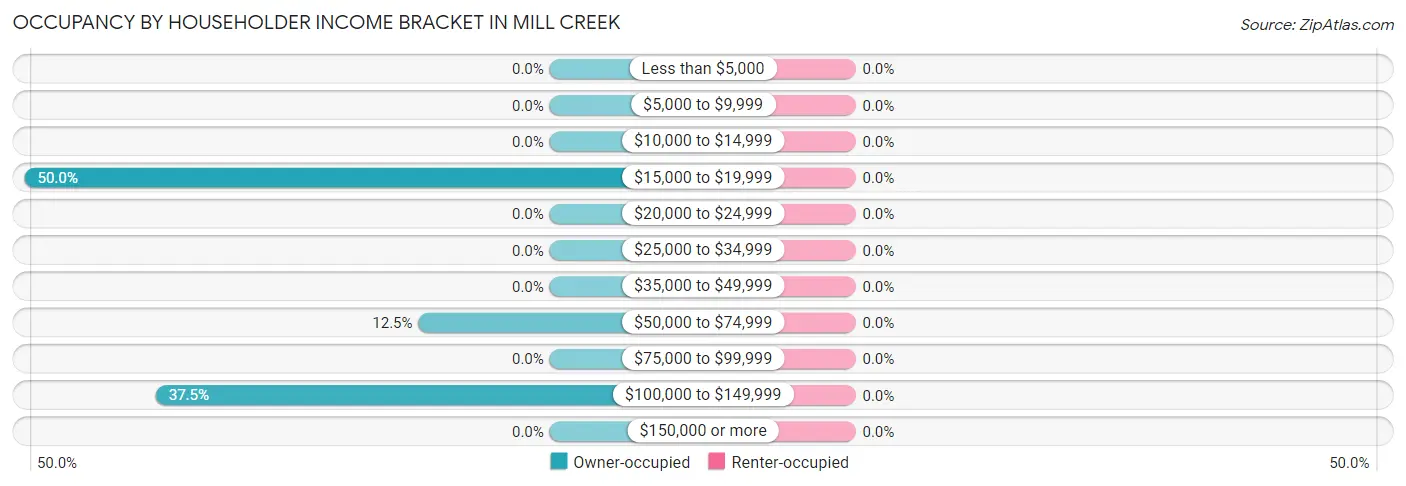
| Income Bracket | Owner-occupied | Renter-occupied |
| Less than $5,000 | 0 (0.0%) | 0 (0.0%) |
| $5,000 to $9,999 | 0 (0.0%) | 0 (0.0%) |
| $10,000 to $14,999 | 0 (0.0%) | 0 (0.0%) |
| $15,000 to $19,999 | 8 (50.0%) | 0 (0.0%) |
| $20,000 to $24,999 | 0 (0.0%) | 0 (0.0%) |
| $25,000 to $34,999 | 0 (0.0%) | 0 (0.0%) |
| $35,000 to $49,999 | 0 (0.0%) | 0 (0.0%) |
| $50,000 to $74,999 | 2 (12.5%) | 0 (0.0%) |
| $75,000 to $99,999 | 0 (0.0%) | 0 (0.0%) |
| $100,000 to $149,999 | 6 (37.5%) | 0 (0.0%) |
| $150,000 or more | 0 (0.0%) | 0 (0.0%) |
| Total | 16 (100.0%) | 0 (0.0%) |
Monthly Housing Cost Tiers in Mill Creek
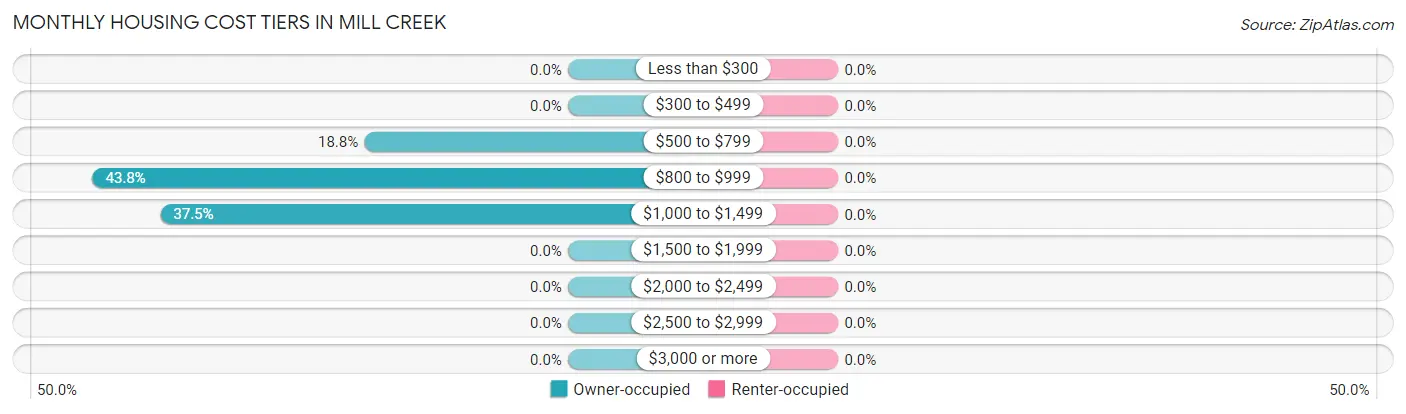
| Monthly Cost | Owner-occupied | Renter-occupied |
| Less than $300 | 0 (0.0%) | 0 (0.0%) |
| $300 to $499 | 0 (0.0%) | 0 (0.0%) |
| $500 to $799 | 3 (18.8%) | 0 (0.0%) |
| $800 to $999 | 7 (43.8%) | 0 (0.0%) |
| $1,000 to $1,499 | 6 (37.5%) | 0 (0.0%) |
| $1,500 to $1,999 | 0 (0.0%) | 0 (0.0%) |
| $2,000 to $2,499 | 0 (0.0%) | 0 (0.0%) |
| $2,500 to $2,999 | 0 (0.0%) | 0 (0.0%) |
| $3,000 or more | 0 (0.0%) | 0 (0.0%) |
| Total | 16 (100.0%) | 0 (0.0%) |
Physical Housing Characteristics in Mill Creek
Housing Structures in Mill Creek
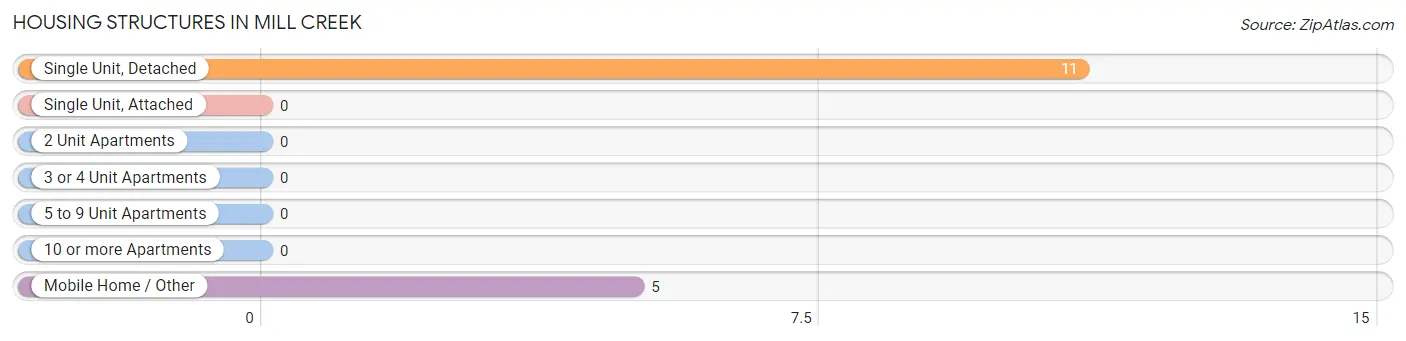
| Structure Type | # Housing Units | % Housing Units |
| Single Unit, Detached | 11 | 68.8% |
| Single Unit, Attached | 0 | 0.0% |
| 2 Unit Apartments | 0 | 0.0% |
| 3 or 4 Unit Apartments | 0 | 0.0% |
| 5 to 9 Unit Apartments | 0 | 0.0% |
| 10 or more Apartments | 0 | 0.0% |
| Mobile Home / Other | 5 | 31.2% |
| Total | 16 | 100.0% |
Housing Structures by Occupancy in Mill Creek
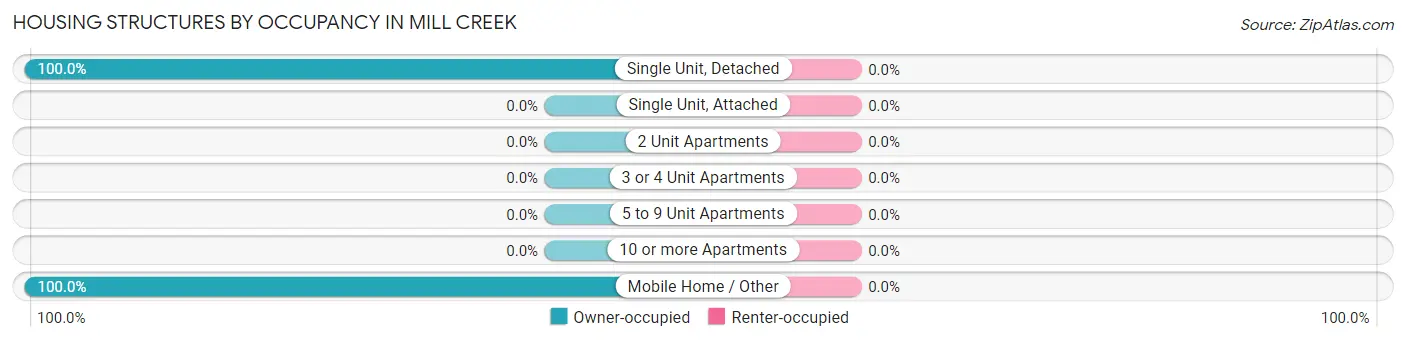
| Structure Type | Owner-occupied | Renter-occupied |
| Single Unit, Detached | 11 (100.0%) | 0 (0.0%) |
| Single Unit, Attached | 0 (0.0%) | 0 (0.0%) |
| 2 Unit Apartments | 0 (0.0%) | 0 (0.0%) |
| 3 or 4 Unit Apartments | 0 (0.0%) | 0 (0.0%) |
| 5 to 9 Unit Apartments | 0 (0.0%) | 0 (0.0%) |
| 10 or more Apartments | 0 (0.0%) | 0 (0.0%) |
| Mobile Home / Other | 5 (100.0%) | 0 (0.0%) |
| Total | 16 (100.0%) | 0 (0.0%) |
Housing Structures by Number of Rooms in Mill Creek
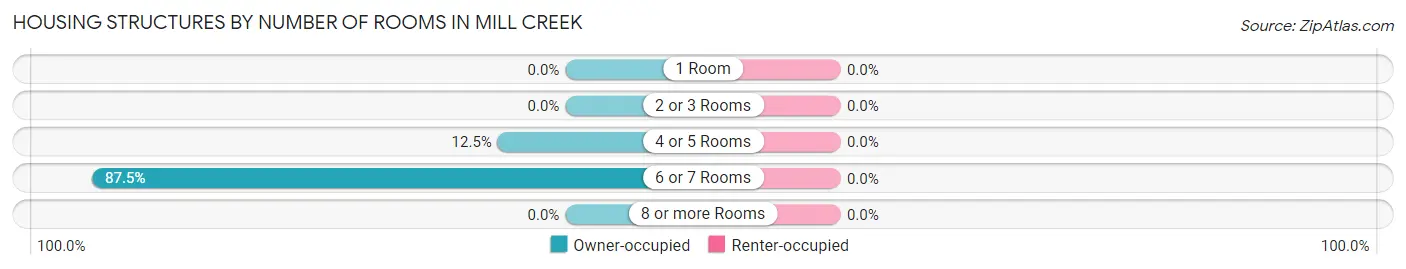
| Number of Rooms | Owner-occupied | Renter-occupied |
| 1 Room | 0 (0.0%) | 0 (0.0%) |
| 2 or 3 Rooms | 0 (0.0%) | 0 (0.0%) |
| 4 or 5 Rooms | 2 (12.5%) | 0 (0.0%) |
| 6 or 7 Rooms | 14 (87.5%) | 0 (0.0%) |
| 8 or more Rooms | 0 (0.0%) | 0 (0.0%) |
| Total | 16 (100.0%) | 0 (0.0%) |
Housing Structure by Heating Type in Mill Creek
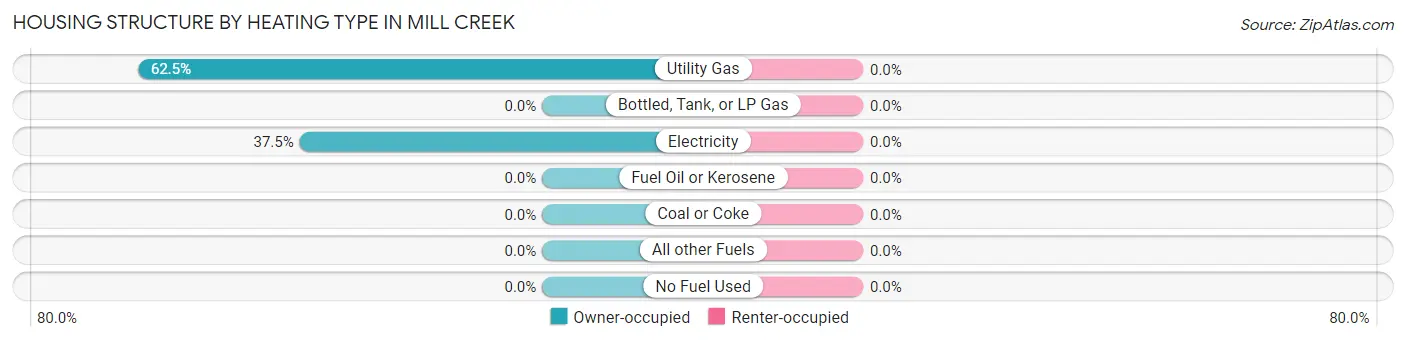
| Heating Type | Owner-occupied | Renter-occupied |
| Utility Gas | 10 (62.5%) | 0 (0.0%) |
| Bottled, Tank, or LP Gas | 0 (0.0%) | 0 (0.0%) |
| Electricity | 6 (37.5%) | 0 (0.0%) |
| Fuel Oil or Kerosene | 0 (0.0%) | 0 (0.0%) |
| Coal or Coke | 0 (0.0%) | 0 (0.0%) |
| All other Fuels | 0 (0.0%) | 0 (0.0%) |
| No Fuel Used | 0 (0.0%) | 0 (0.0%) |
| Total | 16 (100.0%) | 0 (0.0%) |
Household Vehicle Usage in Mill Creek
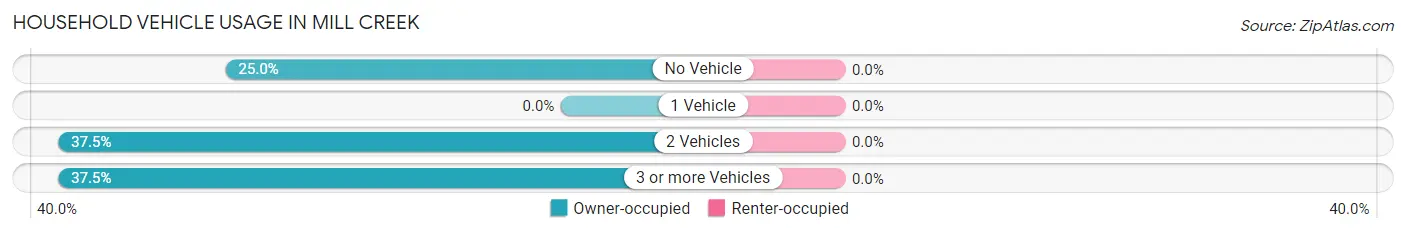
| Vehicles per Household | Owner-occupied | Renter-occupied |
| No Vehicle | 4 (25.0%) | 0 (0.0%) |
| 1 Vehicle | 0 (0.0%) | 0 (0.0%) |
| 2 Vehicles | 6 (37.5%) | 0 (0.0%) |
| 3 or more Vehicles | 6 (37.5%) | 0 (0.0%) |
| Total | 16 (100.0%) | 0 (0.0%) |
Real Estate & Mortgages in Mill Creek
Real Estate and Mortgage Overview in Mill Creek
| Characteristic | Without Mortgage | With Mortgage |
| Housing Units | 6 | 10 |
| Median Property Value | $30,000 | $42,500 |
| Median Household Income | $105,833 | $0 |
| Monthly Housing Costs | $800 | $0 |
| Real Estate Taxes | - | - |
Property Value by Mortgage Status in Mill Creek
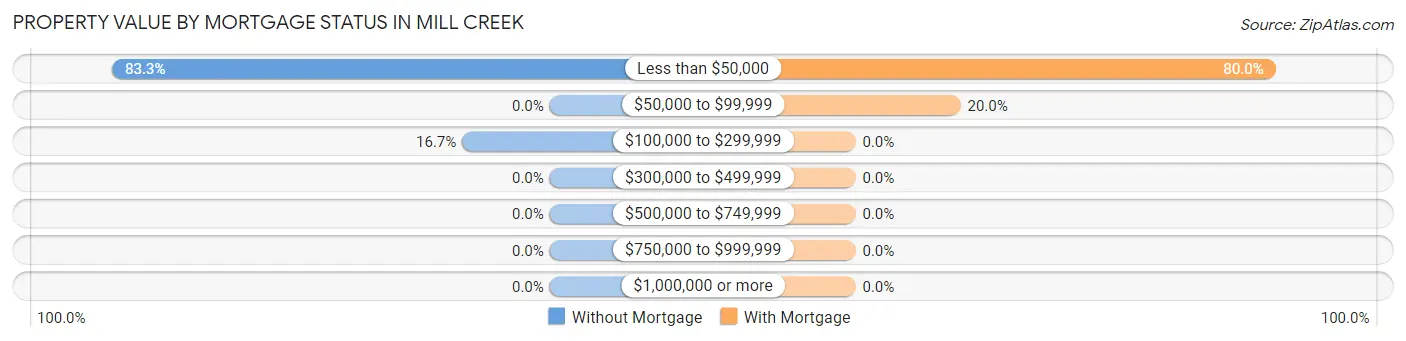
| Property Value | Without Mortgage | With Mortgage |
| Less than $50,000 | 5 (83.3%) | 8 (80.0%) |
| $50,000 to $99,999 | 0 (0.0%) | 2 (20.0%) |
| $100,000 to $299,999 | 1 (16.7%) | 0 (0.0%) |
| $300,000 to $499,999 | 0 (0.0%) | 0 (0.0%) |
| $500,000 to $749,999 | 0 (0.0%) | 0 (0.0%) |
| $750,000 to $999,999 | 0 (0.0%) | 0 (0.0%) |
| $1,000,000 or more | 0 (0.0%) | 0 (0.0%) |
| Total | 6 (100.0%) | 10 (100.0%) |
Household Income by Mortgage Status in Mill Creek
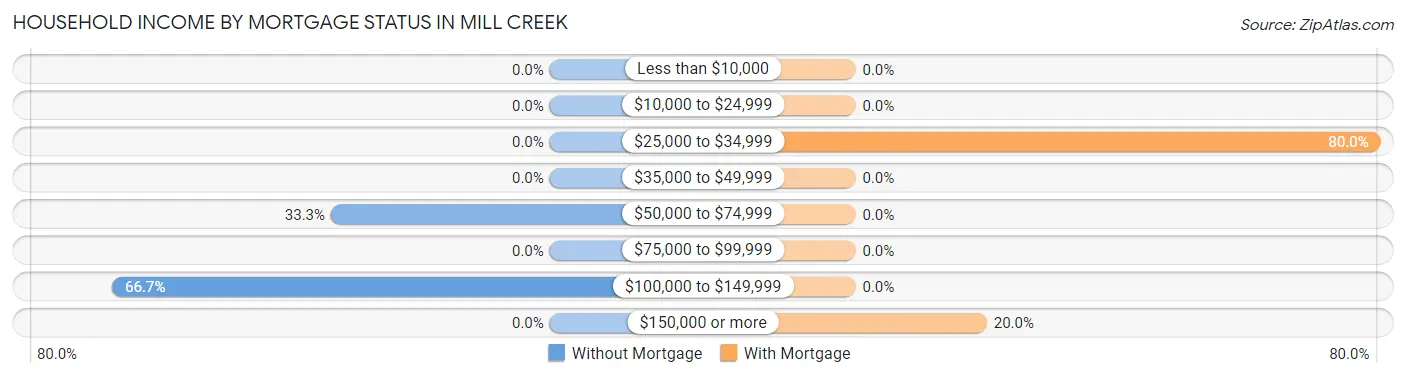
| Household Income | Without Mortgage | With Mortgage |
| Less than $10,000 | 0 (0.0%) | 0 (0.0%) |
| $10,000 to $24,999 | 0 (0.0%) | 0 (0.0%) |
| $25,000 to $34,999 | 0 (0.0%) | 8 (80.0%) |
| $35,000 to $49,999 | 0 (0.0%) | 0 (0.0%) |
| $50,000 to $74,999 | 2 (33.3%) | 0 (0.0%) |
| $75,000 to $99,999 | 0 (0.0%) | 0 (0.0%) |
| $100,000 to $149,999 | 4 (66.7%) | 0 (0.0%) |
| $150,000 or more | 0 (0.0%) | 2 (20.0%) |
| Total | 6 (100.0%) | 10 (100.0%) |
Property Value to Household Income Ratio in Mill Creek
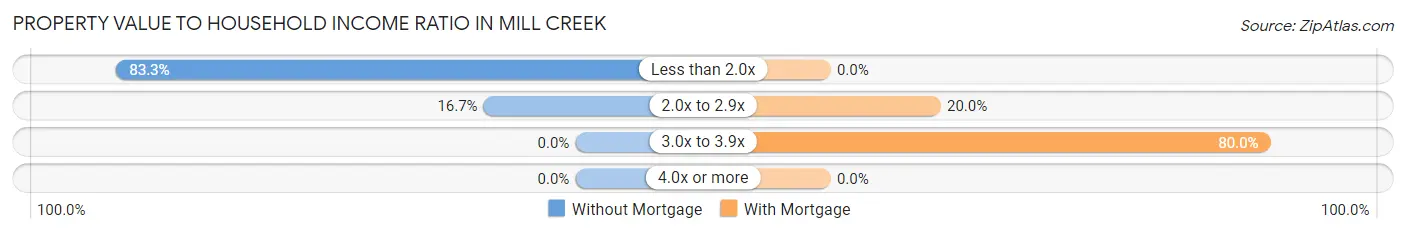
| Value-to-Income Ratio | Without Mortgage | With Mortgage |
| Less than 2.0x | 5 (83.3%) | 0 (0.0%) |
| 2.0x to 2.9x | 1 (16.7%) | 2 (20.0%) |
| 3.0x to 3.9x | 0 (0.0%) | 8 (80.0%) |
| 4.0x or more | 0 (0.0%) | 0 (0.0%) |
| Total | 6 (100.0%) | 10 (100.0%) |
Real Estate Taxes by Mortgage Status in Mill Creek
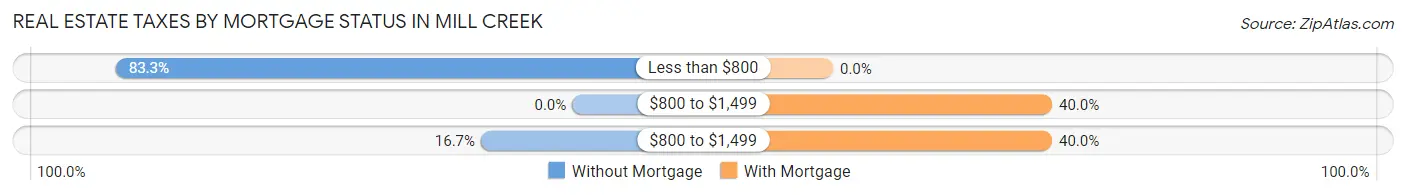
| Property Taxes | Without Mortgage | With Mortgage |
| Less than $800 | 5 (83.3%) | 0 (0.0%) |
| $800 to $1,499 | 0 (0.0%) | 4 (40.0%) |
| $800 to $1,499 | 1 (16.7%) | 4 (40.0%) |
| Total | 6 (100.0%) | 10 (100.0%) |
Health & Disability in Mill Creek
Health Insurance Coverage by Age in Mill Creek
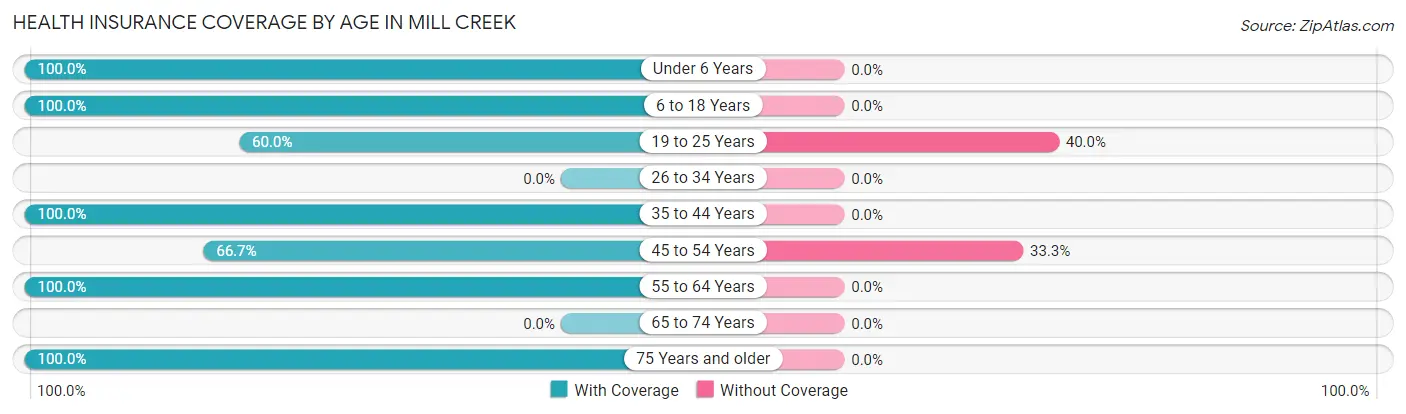
| Age Bracket | With Coverage | Without Coverage |
| Under 6 Years | 1 (100.0%) | 0 (0.0%) |
| 6 to 18 Years | 6 (100.0%) | 0 (0.0%) |
| 19 to 25 Years | 3 (60.0%) | 2 (40.0%) |
| 26 to 34 Years | 0 (0.0%) | 0 (0.0%) |
| 35 to 44 Years | 9 (100.0%) | 0 (0.0%) |
| 45 to 54 Years | 4 (66.7%) | 2 (33.3%) |
| 55 to 64 Years | 2 (100.0%) | 0 (0.0%) |
| 65 to 74 Years | 0 (0.0%) | 0 (0.0%) |
| 75 Years and older | 16 (100.0%) | 0 (0.0%) |
| Total | 41 (91.1%) | 4 (8.9%) |
Health Insurance Coverage by Citizenship Status in Mill Creek
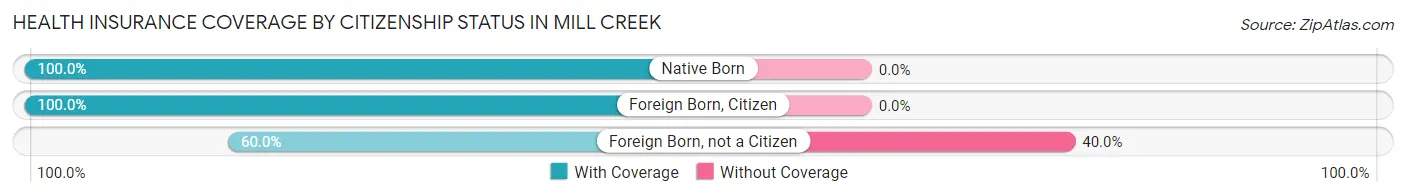
| Citizenship Status | With Coverage | Without Coverage |
| Native Born | 1 (100.0%) | 0 (0.0%) |
| Foreign Born, Citizen | 6 (100.0%) | 0 (0.0%) |
| Foreign Born, not a Citizen | 3 (60.0%) | 2 (40.0%) |
Health Insurance Coverage by Household Income in Mill Creek
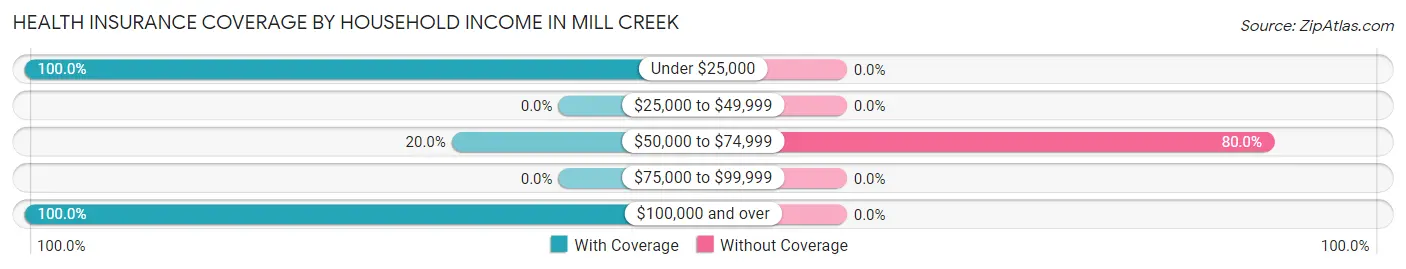
| Household Income | With Coverage | Without Coverage |
| Under $25,000 | 16 (100.0%) | 0 (0.0%) |
| $25,000 to $49,999 | 0 (0.0%) | 0 (0.0%) |
| $50,000 to $74,999 | 1 (20.0%) | 4 (80.0%) |
| $75,000 to $99,999 | 0 (0.0%) | 0 (0.0%) |
| $100,000 and over | 24 (100.0%) | 0 (0.0%) |
Public vs Private Health Insurance Coverage by Age in Mill Creek
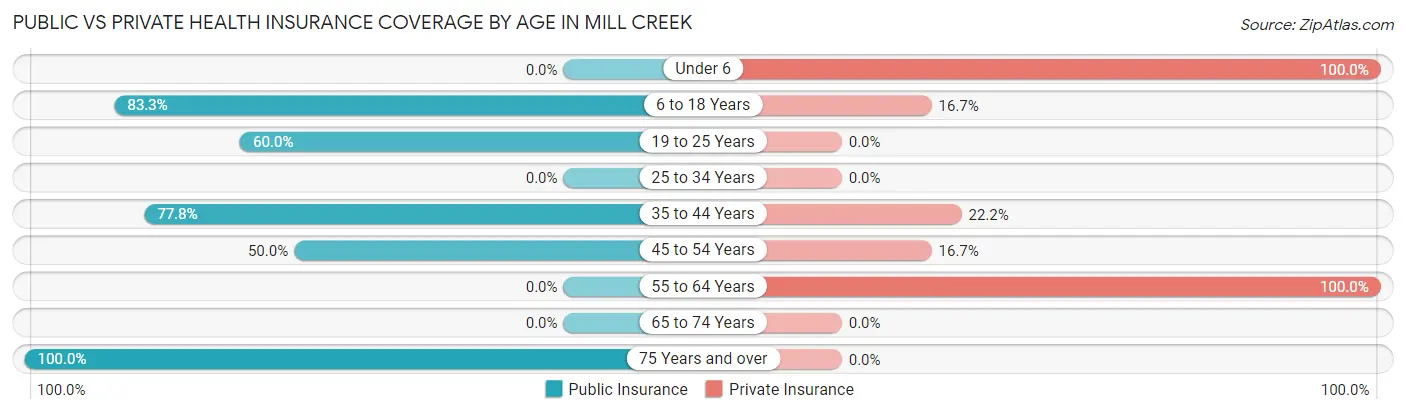
| Age Bracket | Public Insurance | Private Insurance |
| Under 6 | 0 (0.0%) | 1 (100.0%) |
| 6 to 18 Years | 5 (83.3%) | 1 (16.7%) |
| 19 to 25 Years | 3 (60.0%) | 0 (0.0%) |
| 25 to 34 Years | 0 (0.0%) | 0 (0.0%) |
| 35 to 44 Years | 7 (77.8%) | 2 (22.2%) |
| 45 to 54 Years | 3 (50.0%) | 1 (16.7%) |
| 55 to 64 Years | 0 (0.0%) | 2 (100.0%) |
| 65 to 74 Years | 0 (0.0%) | 0 (0.0%) |
| 75 Years and over | 16 (100.0%) | 0 (0.0%) |
| Total | 34 (75.6%) | 7 (15.6%) |
Disability Status by Sex by Age in Mill Creek
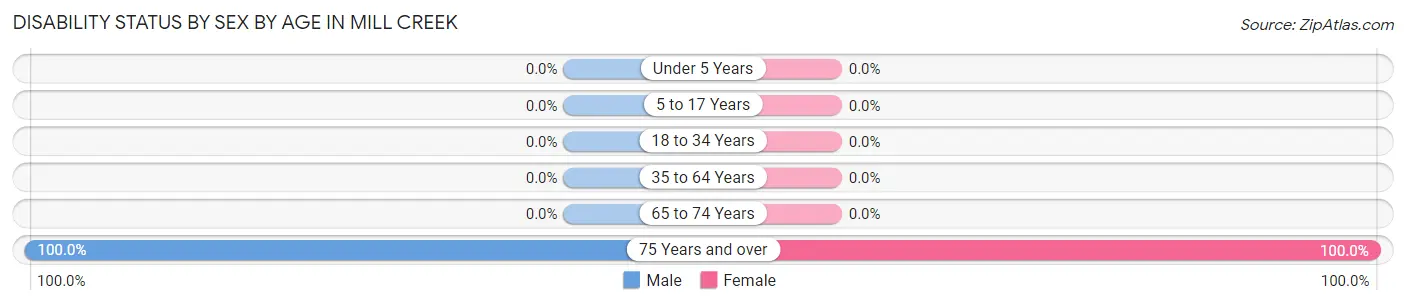
| Age Bracket | Male | Female |
| Under 5 Years | 0 (0.0%) | 0 (0.0%) |
| 5 to 17 Years | 0 (0.0%) | 0 (0.0%) |
| 18 to 34 Years | 0 (0.0%) | 0 (0.0%) |
| 35 to 64 Years | 0 (0.0%) | 0 (0.0%) |
| 65 to 74 Years | 0 (0.0%) | 0 (0.0%) |
| 75 Years and over | 6 (100.0%) | 10 (100.0%) |
Disability Class by Sex by Age in Mill Creek
Disability Class: Hearing Difficulty
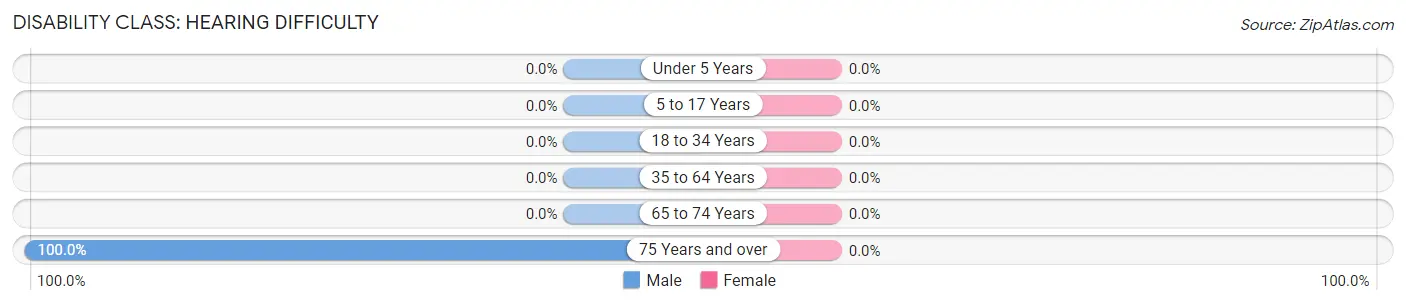
| Age Bracket | Male | Female |
| Under 5 Years | 0 (0.0%) | 0 (0.0%) |
| 5 to 17 Years | 0 (0.0%) | 0 (0.0%) |
| 18 to 34 Years | 0 (0.0%) | 0 (0.0%) |
| 35 to 64 Years | 0 (0.0%) | 0 (0.0%) |
| 65 to 74 Years | 0 (0.0%) | 0 (0.0%) |
| 75 Years and over | 6 (100.0%) | 0 (0.0%) |
Disability Class: Vision Difficulty
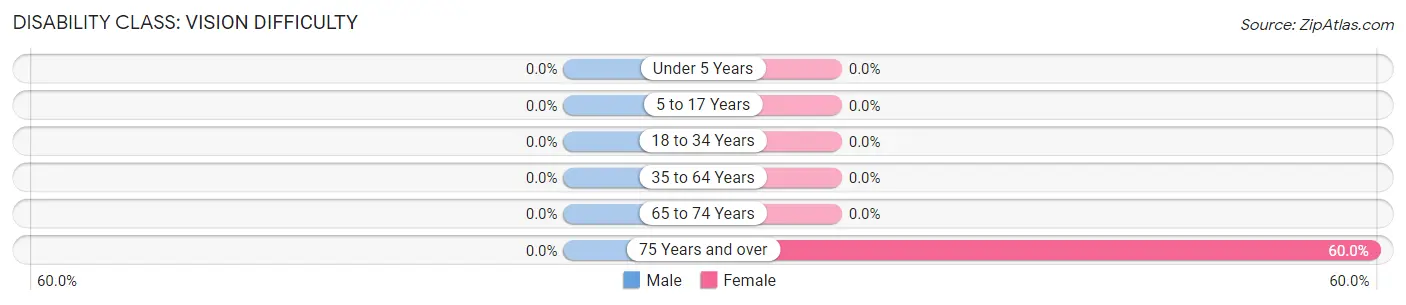
| Age Bracket | Male | Female |
| Under 5 Years | 0 (0.0%) | 0 (0.0%) |
| 5 to 17 Years | 0 (0.0%) | 0 (0.0%) |
| 18 to 34 Years | 0 (0.0%) | 0 (0.0%) |
| 35 to 64 Years | 0 (0.0%) | 0 (0.0%) |
| 65 to 74 Years | 0 (0.0%) | 0 (0.0%) |
| 75 Years and over | 0 (0.0%) | 6 (60.0%) |
Disability Class: Cognitive Difficulty
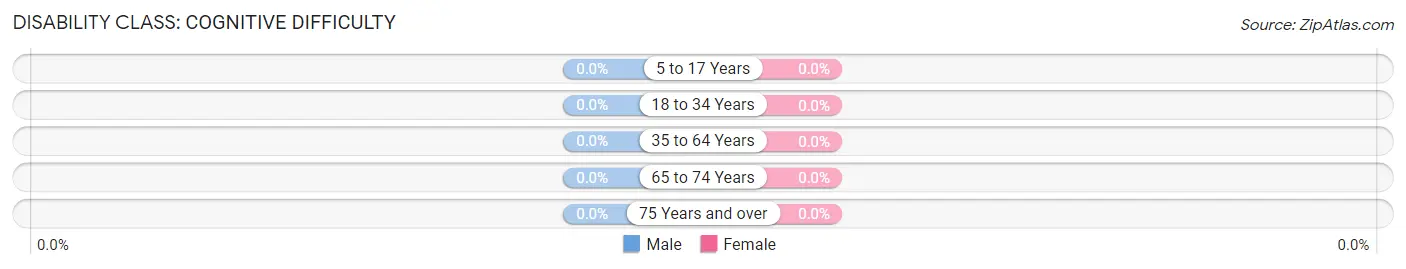
| Age Bracket | Male | Female |
| 5 to 17 Years | 0 (0.0%) | 0 (0.0%) |
| 18 to 34 Years | 0 (0.0%) | 0 (0.0%) |
| 35 to 64 Years | 0 (0.0%) | 0 (0.0%) |
| 65 to 74 Years | 0 (0.0%) | 0 (0.0%) |
| 75 Years and over | 0 (0.0%) | 0 (0.0%) |
Disability Class: Ambulatory Difficulty
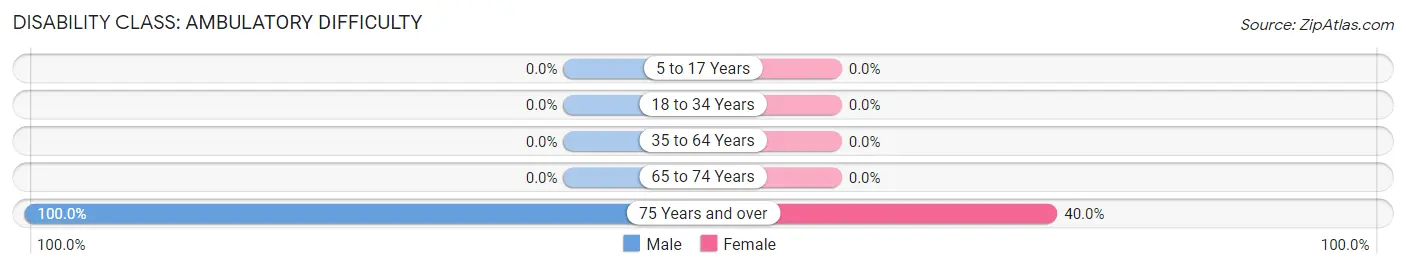
| Age Bracket | Male | Female |
| 5 to 17 Years | 0 (0.0%) | 0 (0.0%) |
| 18 to 34 Years | 0 (0.0%) | 0 (0.0%) |
| 35 to 64 Years | 0 (0.0%) | 0 (0.0%) |
| 65 to 74 Years | 0 (0.0%) | 0 (0.0%) |
| 75 Years and over | 6 (100.0%) | 4 (40.0%) |
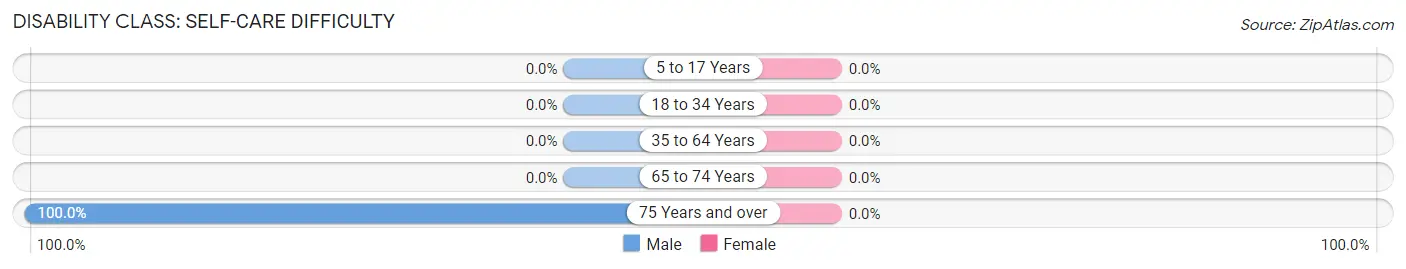
Disability Class: Self-Care Difficulty
| Age Bracket | Male | Female |
| 5 to 17 Years | 0 (0.0%) | 0 (0.0%) |
| 18 to 34 Years | 0 (0.0%) | 0 (0.0%) |
| 35 to 64 Years | 0 (0.0%) | 0 (0.0%) |
| 65 to 74 Years | 0 (0.0%) | 0 (0.0%) |
| 75 Years and over | 6 (100.0%) | 0 (0.0%) |
Technology Access in Mill Creek
Computing Device Access in Mill Creek
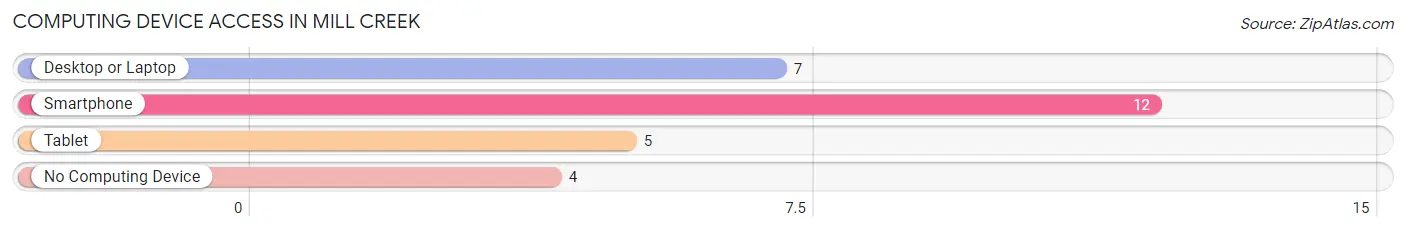
| Device Type | # Households | % Households |
| Desktop or Laptop | 7 | 43.8% |
| Smartphone | 12 | 75.0% |
| Tablet | 5 | 31.2% |
| No Computing Device | 4 | 25.0% |
| Total | 16 | 100.0% |
Internet Access in Mill Creek
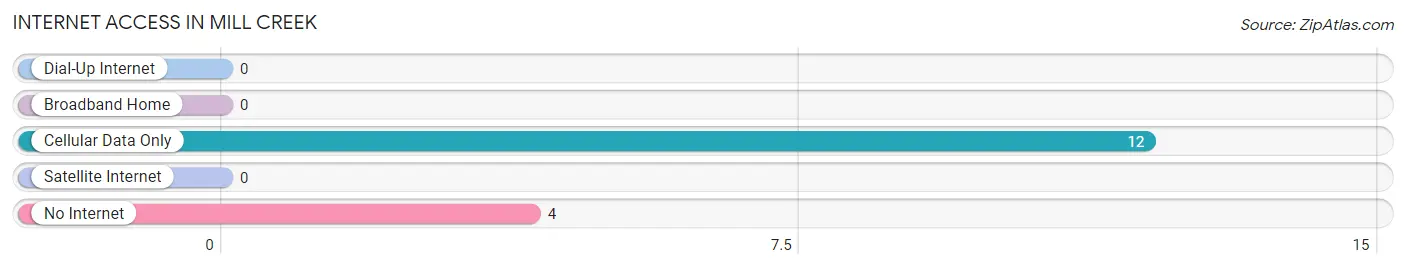
| Internet Type | # Households | % Households |
| Dial-Up Internet | 0 | 0.0% |
| Broadband Home | 0 | 0.0% |
| Cellular Data Only | 12 | 75.0% |
| Satellite Internet | 0 | 0.0% |
| No Internet | 4 | 25.0% |
| Total | 16 | 100.0% |
Mill Creek Summary
Mill Creek is a small unincorporated community located in the northern part of McHenry County, Illinois. It is situated on the banks of the Fox River, about 25 miles northwest of Chicago. The population of Mill Creek was estimated to be around 1,000 in 2020.
History
Mill Creek was first settled in the early 1800s by a group of German immigrants. The settlers built a sawmill and gristmill on the banks of the Fox River, which gave the town its name. The mills provided the settlers with a source of income and helped to establish the town as an important trading center.
In 1836, the first post office was established in Mill Creek. The town was officially incorporated in 1845. During the late 19th century, the town grew rapidly, with the population reaching over 1,000 by 1900.
The town was home to several businesses, including a general store, a blacksmith shop, a hotel, and a saloon. The town also had a school, a church, and a library.
Geography
Mill Creek is located in the northern part of McHenry County, Illinois. It is situated on the banks of the Fox River, about 25 miles northwest of Chicago. The town is surrounded by rolling hills and farmland.
The climate in Mill Creek is typical of the Midwest, with hot summers and cold winters. The average temperature in the summer is around 75 degrees Fahrenheit, while the average temperature in the winter is around 25 degrees Fahrenheit.
Economy
Mill Creek’s economy is largely based on agriculture and tourism. The town is home to several farms, which produce a variety of crops, including corn, soybeans, and wheat. The town also has several wineries, which attract tourists from all over the region.
In addition to agriculture and tourism, Mill Creek is home to several small businesses, including restaurants, shops, and a hardware store. The town also has a post office and a library.
Demographics
As of 2020, the population of Mill Creek was estimated to be around 1,000. The town is predominantly white, with about 95% of the population identifying as Caucasian. The median household income in Mill Creek is around $50,000, and the median home value is around $200,000.
Mill Creek is a small, close-knit community with a strong sense of community. The town is home to several churches, a library, and a post office. The town also has several parks and recreational areas, including a golf course and a swimming pool.
Common Questions
What is Per Capita Income in Mill Creek?
Per Capita income in Mill Creek is $20,651.
What is Inequality or Gini Index in Mill Creek?
Inequality or Gini Index in Mill Creek is 0.38.
What is the Total Population of Mill Creek?
Total Population of Mill Creek is 45.
What is the Total Male Population of Mill Creek?
Total Male Population of Mill Creek is 24.
What is the Total Female Population of Mill Creek?
Total Female Population of Mill Creek is 21.
What is the Ratio of Males per 100 Females in Mill Creek?
There are 114.29 Males per 100 Females in Mill Creek.
What is the Ratio of Females per 100 Males in Mill Creek?
There are 87.50 Females per 100 Males in Mill Creek.
What is the Median Population Age in Mill Creek?
Median Population Age in Mill Creek is 45.5 Years.
What is the Average Family Size in Mill Creek
Average Family Size in Mill Creek is 2.8 People.
What is the Average Household Size in Mill Creek
Average Household Size in Mill Creek is 2.8 People.
How Large is the Labor Force in Mill Creek?
There are 18 People in the Labor Forcein in Mill Creek.
What is the Percentage of People in the Labor Force in Mill Creek?
41.9% of People are in the Labor Force in Mill Creek.
What is the Unemployment Rate in Mill Creek?
Unemployment Rate in Mill Creek is 22.2%.