Zip Codes with the Highest Percentage of Population Employed in Food Preparation & Serving in Illinois
RELATED REPORTS & OPTIONS
Food Preparation & Serving
Illinois
Compare Zip Codes
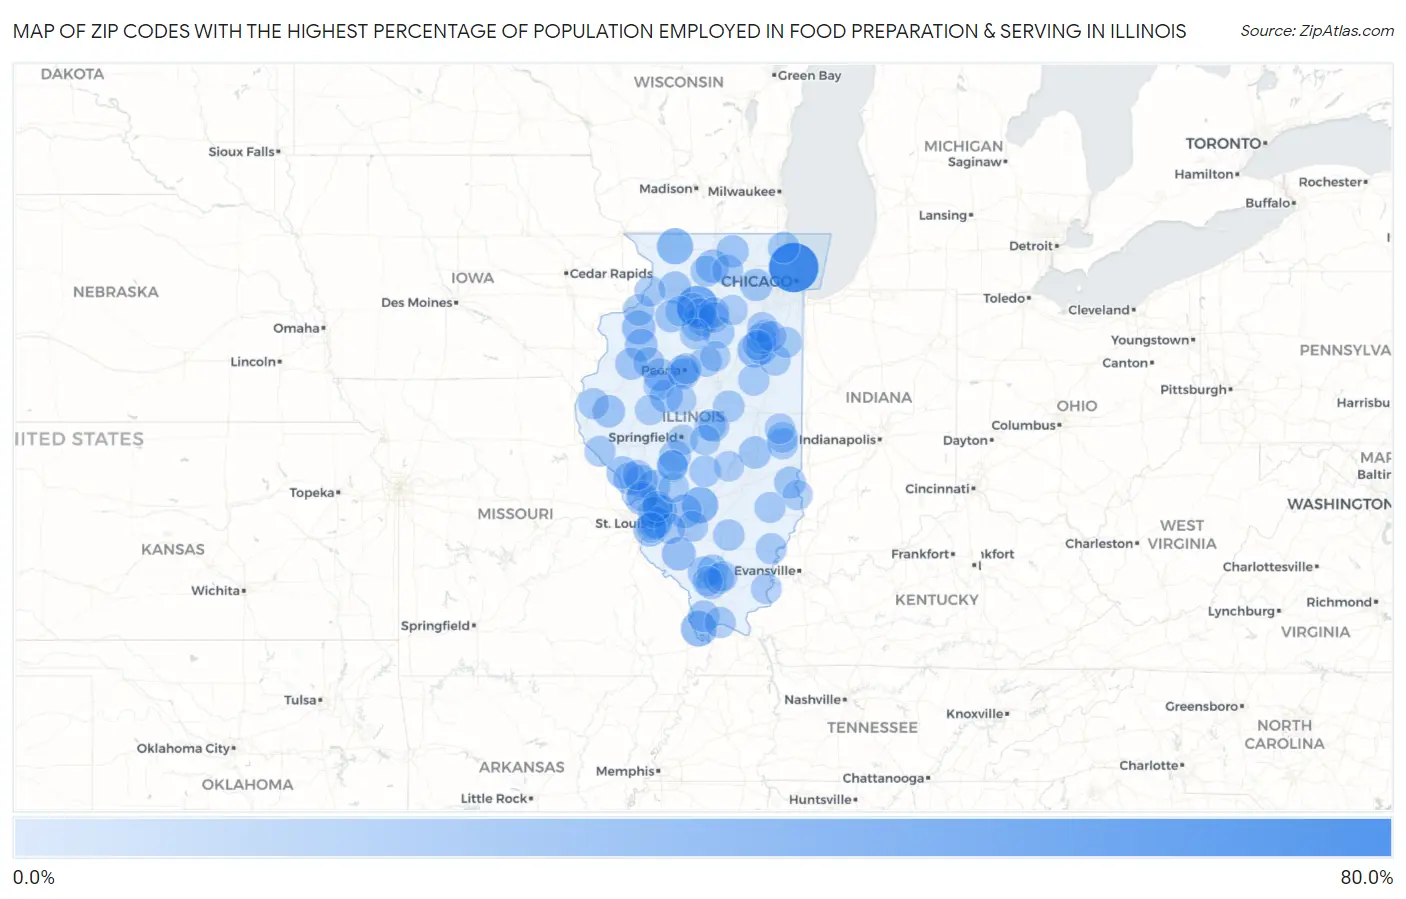
Map of Zip Codes with the Highest Percentage of Population Employed in Food Preparation & Serving in Illinois
0.0%
80.0%
Zip Codes with the Highest Percentage of Population Employed in Food Preparation & Serving in Illinois
| Zip Code | % Employed | vs State | vs National | |
| 1. | 60208 | 69.4% | 5.0%(+64.4)#1 | 5.3%(+64.2)#23 |
| 2. | 61374 | 42.9% | 5.0%(+37.8)#2 | 5.3%(+37.6)#88 |
| 3. | 62284 | 28.5% | 5.0%(+23.5)#3 | 5.3%(+23.2)#240 |
| 4. | 61027 | 27.8% | 5.0%(+22.7)#4 | 5.3%(+22.5)#250 |
| 5. | 62969 | 26.1% | 5.0%(+21.0)#5 | 5.3%(+20.8)#289 |
| 6. | 60934 | 24.0% | 5.0%(+19.0)#6 | 5.3%(+18.7)#339 |
| 7. | 62273 | 21.0% | 5.0%(+16.0)#7 | 5.3%(+15.7)#460 |
| 8. | 62292 | 20.3% | 5.0%(+15.2)#8 | 5.3%(+15.0)#488 |
| 9. | 61468 | 20.2% | 5.0%(+15.2)#9 | 5.3%(+14.9)#490 |
| 10. | 62240 | 19.0% | 5.0%(+14.0)#10 | 5.3%(+13.7)#567 |
| 11. | 61043 | 18.7% | 5.0%(+13.6)#11 | 5.3%(+13.4)#598 |
| 12. | 61567 | 18.0% | 5.0%(+13.0)#12 | 5.3%(+12.7)#659 |
| 13. | 62054 | 17.8% | 5.0%(+12.7)#13 | 5.3%(+12.5)#678 |
| 14. | 62027 | 17.5% | 5.0%(+12.5)#14 | 5.3%(+12.3)#704 |
| 15. | 61553 | 17.5% | 5.0%(+12.5)#15 | 5.3%(+12.2)#707 |
| 16. | 61439 | 17.4% | 5.0%(+12.4)#16 | 5.3%(+12.1)#713 |
| 17. | 62079 | 17.1% | 5.0%(+12.1)#17 | 5.3%(+11.8)#734 |
| 18. | 62346 | 16.7% | 5.0%(+11.6)#18 | 5.3%(+11.4)#782 |
| 19. | 60539 | 16.5% | 5.0%(+11.5)#19 | 5.3%(+11.2)#796 |
| 20. | 61037 | 16.4% | 5.0%(+11.3)#20 | 5.3%(+11.1)#813 |
| 21. | 62053 | 16.3% | 5.0%(+11.3)#21 | 5.3%(+11.0)#823 |
| 22. | 61931 | 16.2% | 5.0%(+11.2)#22 | 5.3%(+10.9)#835 |
| 23. | 61344 | 16.2% | 5.0%(+11.1)#23 | 5.3%(+10.9)#838 |
| 24. | 61038 | 16.1% | 5.0%(+11.1)#24 | 5.3%(+10.8)#845 |
| 25. | 62028 | 16.1% | 5.0%(+11.0)#25 | 5.3%(+10.8)#858 |
| 26. | 61315 | 15.8% | 5.0%(+10.7)#26 | 5.3%(+10.5)#886 |
| 27. | 62201 | 15.6% | 5.0%(+10.5)#27 | 5.3%(+10.3)#907 |
| 28. | 61417 | 15.6% | 5.0%(+10.5)#28 | 5.3%(+10.3)#910 |
| 29. | 62026 | 15.5% | 5.0%(+10.4)#29 | 5.3%(+10.2)#921 |
| 30. | 61328 | 15.4% | 5.0%(+10.4)#30 | 5.3%(+10.1)#933 |
| 31. | 62087 | 15.3% | 5.0%(+10.3)#31 | 5.3%(+10.0)#941 |
| 32. | 62689 | 15.2% | 5.0%(+10.2)#32 | 5.3%(+9.96)#954 |
| 33. | 61359 | 15.1% | 5.0%(+10.0)#33 | 5.3%(+9.77)#975 |
| 34. | 62478 | 14.7% | 5.0%(+9.70)#34 | 5.3%(+9.45)#1,021 |
| 35. | 62204 | 14.7% | 5.0%(+9.70)#35 | 5.3%(+9.45)#1,023 |
| 36. | 62927 | 14.7% | 5.0%(+9.69)#36 | 5.3%(+9.44)#1,025 |
| 37. | 62961 | 14.3% | 5.0%(+9.25)#37 | 5.3%(+9.00)#1,107 |
| 38. | 61605 | 14.3% | 5.0%(+9.23)#38 | 5.3%(+8.98)#1,109 |
| 39. | 61735 | 14.2% | 5.0%(+9.12)#39 | 5.3%(+8.86)#1,136 |
| 40. | 61239 | 14.0% | 5.0%(+8.93)#40 | 5.3%(+8.68)#1,171 |
| 41. | 60088 | 13.8% | 5.0%(+8.80)#41 | 5.3%(+8.54)#1,198 |
| 42. | 62076 | 13.8% | 5.0%(+8.76)#42 | 5.3%(+8.51)#1,209 |
| 43. | 62048 | 13.8% | 5.0%(+8.74)#43 | 5.3%(+8.49)#1,214 |
| 44. | 62889 | 13.8% | 5.0%(+8.73)#44 | 5.3%(+8.48)#1,218 |
| 45. | 60919 | 13.6% | 5.0%(+8.59)#45 | 5.3%(+8.33)#1,253 |
| 46. | 61332 | 13.3% | 5.0%(+8.30)#46 | 5.3%(+8.05)#1,309 |
| 47. | 61015 | 13.3% | 5.0%(+8.22)#47 | 5.3%(+7.96)#1,329 |
| 48. | 61610 | 13.0% | 5.0%(+8.01)#48 | 5.3%(+7.76)#1,384 |
| 49. | 61773 | 13.0% | 5.0%(+7.93)#49 | 5.3%(+7.68)#1,399 |
| 50. | 62941 | 12.9% | 5.0%(+7.88)#50 | 5.3%(+7.63)#1,412 |
| 51. | 62543 | 12.9% | 5.0%(+7.87)#51 | 5.3%(+7.62)#1,417 |
| 52. | 60930 | 12.9% | 5.0%(+7.83)#52 | 5.3%(+7.58)#1,425 |
| 53. | 61337 | 12.6% | 5.0%(+7.57)#53 | 5.3%(+7.32)#1,489 |
| 54. | 62380 | 12.5% | 5.0%(+7.47)#54 | 5.3%(+7.21)#1,517 |
| 55. | 62219 | 12.4% | 5.0%(+7.41)#55 | 5.3%(+7.16)#1,534 |
| 56. | 61458 | 12.3% | 5.0%(+7.30)#56 | 5.3%(+7.05)#1,557 |
| 57. | 62672 | 12.3% | 5.0%(+7.25)#57 | 5.3%(+6.99)#1,573 |
| 58. | 60111 | 12.2% | 5.0%(+7.19)#58 | 5.3%(+6.94)#1,593 |
| 59. | 61917 | 12.2% | 5.0%(+7.16)#59 | 5.3%(+6.91)#1,595 |
| 60. | 61561 | 12.2% | 5.0%(+7.16)#60 | 5.3%(+6.91)#1,602 |
| 61. | 62356 | 12.2% | 5.0%(+7.13)#61 | 5.3%(+6.88)#1,610 |
| 62. | 60910 | 12.1% | 5.0%(+7.08)#62 | 5.3%(+6.82)#1,626 |
| 63. | 61932 | 12.1% | 5.0%(+7.02)#63 | 5.3%(+6.77)#1,643 |
| 64. | 62865 | 12.0% | 5.0%(+7.00)#64 | 5.3%(+6.75)#1,652 |
| 65. | 62844 | 12.0% | 5.0%(+6.99)#65 | 5.3%(+6.74)#1,656 |
| 66. | 62573 | 12.0% | 5.0%(+6.97)#66 | 5.3%(+6.72)#1,660 |
| 67. | 62425 | 12.0% | 5.0%(+6.96)#67 | 5.3%(+6.71)#1,671 |
| 68. | 61230 | 12.0% | 5.0%(+6.93)#68 | 5.3%(+6.68)#1,677 |
| 69. | 62915 | 12.0% | 5.0%(+6.93)#69 | 5.3%(+6.68)#1,682 |
| 70. | 62022 | 11.9% | 5.0%(+6.82)#70 | 5.3%(+6.57)#1,717 |
| 71. | 60935 | 11.8% | 5.0%(+6.79)#71 | 5.3%(+6.53)#1,730 |
| 72. | 61524 | 11.8% | 5.0%(+6.73)#72 | 5.3%(+6.48)#1,749 |
| 73. | 61603 | 11.6% | 5.0%(+6.60)#73 | 5.3%(+6.35)#1,803 |
| 74. | 61301 | 11.6% | 5.0%(+6.53)#74 | 5.3%(+6.28)#1,824 |
| 75. | 60961 | 11.5% | 5.0%(+6.50)#75 | 5.3%(+6.25)#1,834 |
| 76. | 62225 | 11.5% | 5.0%(+6.43)#76 | 5.3%(+6.18)#1,854 |
| 77. | 60408 | 11.3% | 5.0%(+6.25)#77 | 5.3%(+6.00)#1,921 |
| 78. | 61372 | 11.2% | 5.0%(+6.15)#78 | 5.3%(+5.90)#1,964 |
| 79. | 60913 | 11.2% | 5.0%(+6.15)#79 | 5.3%(+5.90)#1,967 |
| 80. | 62841 | 11.1% | 5.0%(+6.08)#80 | 5.3%(+5.83)#2,004 |
| 81. | 62984 | 11.1% | 5.0%(+6.02)#81 | 5.3%(+5.77)#2,030 |
| 82. | 62095 | 10.9% | 5.0%(+5.90)#82 | 5.3%(+5.65)#2,086 |
| 83. | 61810 | 10.9% | 5.0%(+5.84)#83 | 5.3%(+5.58)#2,126 |
| 84. | 62703 | 10.9% | 5.0%(+5.83)#84 | 5.3%(+5.58)#2,130 |
| 85. | 62896 | 10.7% | 5.0%(+5.69)#85 | 5.3%(+5.44)#2,194 |
| 86. | 61760 | 10.7% | 5.0%(+5.67)#86 | 5.3%(+5.41)#2,208 |
| 87. | 62023 | 10.6% | 5.0%(+5.60)#87 | 5.3%(+5.35)#2,238 |
| 88. | 61560 | 10.6% | 5.0%(+5.57)#88 | 5.3%(+5.32)#2,262 |
| 89. | 62565 | 10.6% | 5.0%(+5.56)#89 | 5.3%(+5.31)#2,264 |
| 90. | 62924 | 10.6% | 5.0%(+5.55)#90 | 5.3%(+5.30)#2,274 |
| 91. | 62016 | 10.6% | 5.0%(+5.54)#91 | 5.3%(+5.29)#2,286 |
| 92. | 61338 | 10.5% | 5.0%(+5.49)#92 | 5.3%(+5.24)#2,317 |
| 93. | 62547 | 10.4% | 5.0%(+5.39)#93 | 5.3%(+5.14)#2,362 |
| 94. | 62682 | 10.4% | 5.0%(+5.33)#94 | 5.3%(+5.08)#2,392 |
| 95. | 62206 | 10.3% | 5.0%(+5.29)#95 | 5.3%(+5.04)#2,409 |
| 96. | 62451 | 10.3% | 5.0%(+5.27)#96 | 5.3%(+5.02)#2,424 |
| 97. | 60920 | 10.3% | 5.0%(+5.26)#97 | 5.3%(+5.01)#2,428 |
| 98. | 62640 | 10.3% | 5.0%(+5.23)#98 | 5.3%(+4.97)#2,447 |
| 99. | 62617 | 10.2% | 5.0%(+5.12)#99 | 5.3%(+4.87)#2,520 |
| 100. | 60549 | 10.1% | 5.0%(+5.07)#100 | 5.3%(+4.82)#2,553 |
Common Questions
What are the Top 10 Zip Codes with the Highest Percentage of Population Employed in Food Preparation & Serving in Illinois?
Top 10 Zip Codes with the Highest Percentage of Population Employed in Food Preparation & Serving in Illinois are:
What zip code has the Highest Percentage of Population Employed in Food Preparation & Serving in Illinois?
60208 has the Highest Percentage of Population Employed in Food Preparation & Serving in Illinois with 69.4%.
What is the Percentage of Population Employed in Food Preparation & Serving in the State of Illinois?
Percentage of Population Employed in Food Preparation & Serving in Illinois is 5.0%.
What is the Percentage of Population Employed in Food Preparation & Serving in the United States?
Percentage of Population Employed in Food Preparation & Serving in the United States is 5.3%.