Zip Codes with the Highest Percentage of Population Employed in Food Preparation & Serving in Naperville, IL
RELATED REPORTS & OPTIONS
Food Preparation & Serving
Naperville
Compare Zip Codes
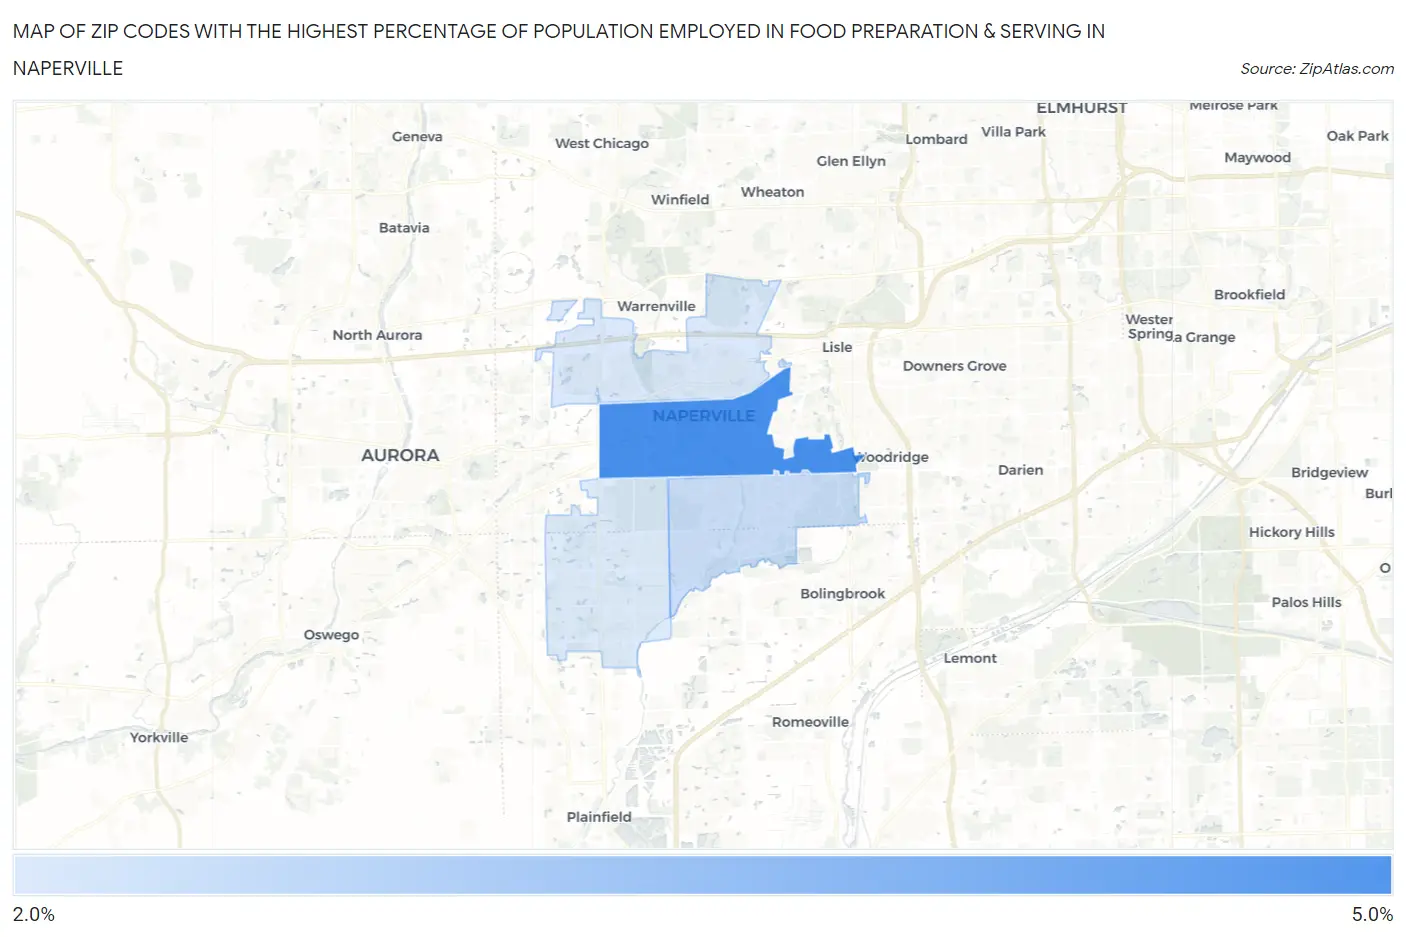
Map of Zip Codes with the Highest Percentage of Population Employed in Food Preparation & Serving in Naperville
2.9%
4.6%
Zip Codes with the Highest Percentage of Population Employed in Food Preparation & Serving in Naperville, IL
| Zip Code | % Employed | vs State | vs National | |
| 1. | 60540 | 4.6% | 5.0%(-0.449)#635 | 5.3%(-0.700)#14,667 |
| 2. | 60565 | 3.1% | 5.0%(-1.91)#898 | 5.3%(-2.17)#20,790 |
| 3. | 60563 | 2.9% | 5.0%(-2.09)#938 | 5.3%(-2.34)#21,457 |
| 4. | 60564 | 2.9% | 5.0%(-2.12)#946 | 5.3%(-2.37)#21,596 |
1
Common Questions
What are the Top 3 Zip Codes with the Highest Percentage of Population Employed in Food Preparation & Serving in Naperville, IL?
Top 3 Zip Codes with the Highest Percentage of Population Employed in Food Preparation & Serving in Naperville, IL are:
What zip code has the Highest Percentage of Population Employed in Food Preparation & Serving in Naperville, IL?
60540 has the Highest Percentage of Population Employed in Food Preparation & Serving in Naperville, IL with 4.6%.
What is the Percentage of Population Employed in Food Preparation & Serving in Naperville, IL?
Percentage of Population Employed in Food Preparation & Serving in Naperville is 3.6%.
What is the Percentage of Population Employed in Food Preparation & Serving in Illinois?
Percentage of Population Employed in Food Preparation & Serving in Illinois is 5.0%.
What is the Percentage of Population Employed in Food Preparation & Serving in the United States?
Percentage of Population Employed in Food Preparation & Serving in the United States is 5.3%.