Sauget, IL Map & Demographics
Sauget Map
Sauget Overview
$42,474
PER CAPITA INCOME
$59,643
AVG FAMILY INCOME
$58,684
AVG HOUSEHOLD INCOME
33.9%
WAGE / INCOME GAP [ % ]
66.1¢/ $1
WAGE / INCOME GAP [ $ ]
0.53
INEQUALITY / GINI INDEX
270
TOTAL POPULATION
136
MALE POPULATION
134
FEMALE POPULATION
101.49
MALES / 100 FEMALES
98.53
FEMALES / 100 MALES
55.7
MEDIAN AGE
2.7
AVG FAMILY SIZE
2.0
AVG HOUSEHOLD SIZE
97
LABOR FORCE [ PEOPLE ]
40.4%
PERCENT IN LABOR FORCE
26.8%
UNEMPLOYMENT RATE
Sauget Area Codes
Income in Sauget
Income Overview in Sauget
Per Capita Income in Sauget is $42,474, while median incomes of families and households are $59,643 and $58,684 respectively.
| Characteristic | Number | Measure |
| Per Capita Income | 270 | $42,474 |
| Median Family Income | 62 | $59,643 |
| Mean Family Income | 62 | $123,442 |
| Median Household Income | 136 | $58,684 |
| Mean Household Income | 136 | $81,224 |
| Income Deficit | 62 | $0 |
| Wage / Income Gap (%) | 270 | 33.86% |
| Wage / Income Gap ($) | 270 | 66.14¢ per $1 |
| Gini / Inequality Index | 270 | 0.53 |
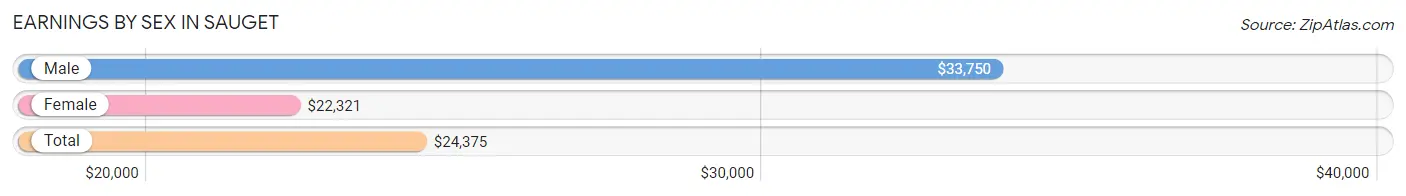
Earnings by Sex in Sauget
Average Earnings in Sauget are $24,375, $33,750 for men and $22,321 for women, a difference of 33.9%.
| Sex | Number | Average Earnings |
| Male | 68 (58.1%) | $33,750 |
| Female | 49 (41.9%) | $22,321 |
| Total | 117 (100.0%) | $24,375 |
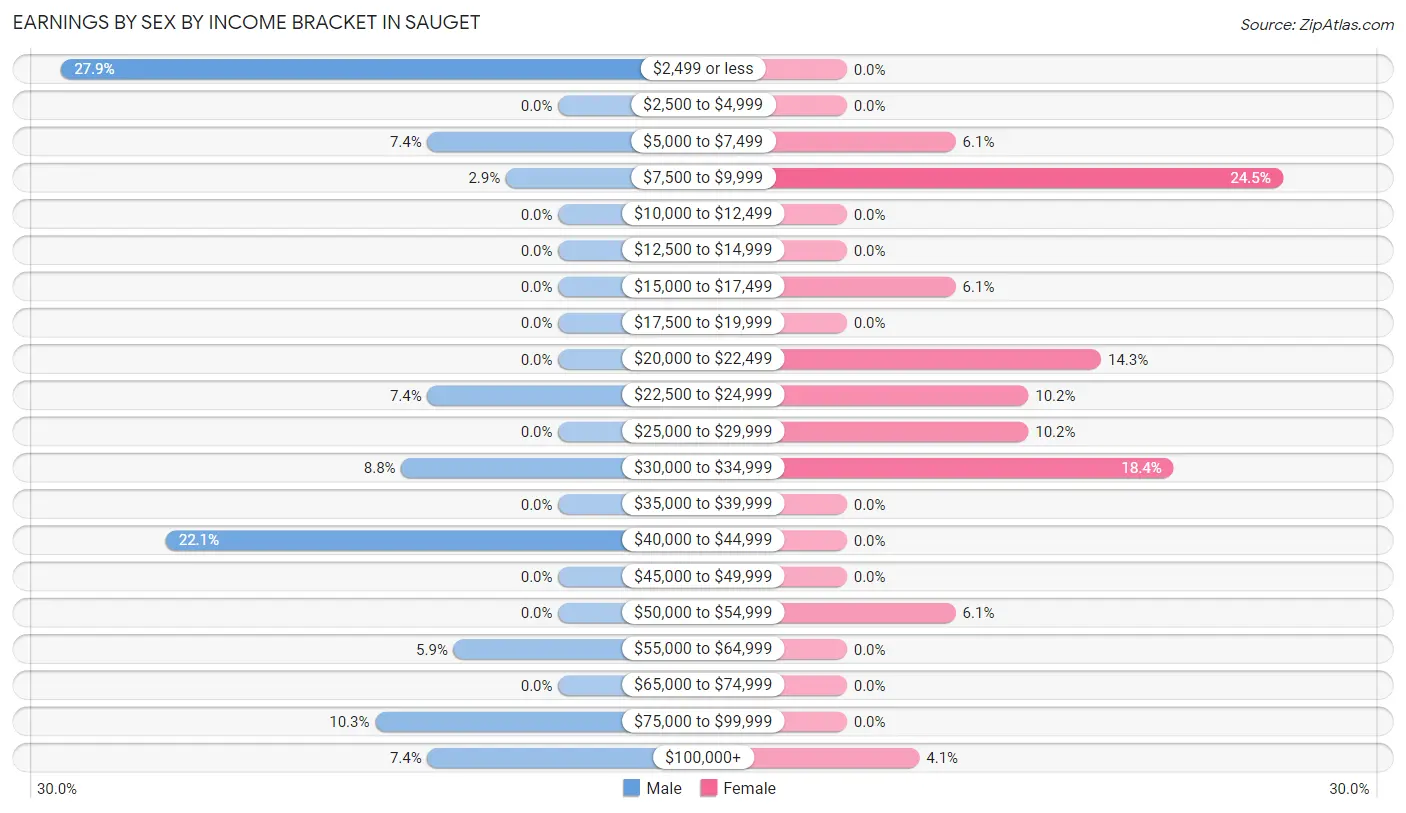
Earnings by Sex by Income Bracket in Sauget
The most common earnings brackets in Sauget are $2,499 or less for men (19 | 27.9%) and $7,500 to $9,999 for women (12 | 24.5%).
| Income | Male | Female |
| $2,499 or less | 19 (27.9%) | 0 (0.0%) |
| $2,500 to $4,999 | 0 (0.0%) | 0 (0.0%) |
| $5,000 to $7,499 | 5 (7.3%) | 3 (6.1%) |
| $7,500 to $9,999 | 2 (2.9%) | 12 (24.5%) |
| $10,000 to $12,499 | 0 (0.0%) | 0 (0.0%) |
| $12,500 to $14,999 | 0 (0.0%) | 0 (0.0%) |
| $15,000 to $17,499 | 0 (0.0%) | 3 (6.1%) |
| $17,500 to $19,999 | 0 (0.0%) | 0 (0.0%) |
| $20,000 to $22,499 | 0 (0.0%) | 7 (14.3%) |
| $22,500 to $24,999 | 5 (7.3%) | 5 (10.2%) |
| $25,000 to $29,999 | 0 (0.0%) | 5 (10.2%) |
| $30,000 to $34,999 | 6 (8.8%) | 9 (18.4%) |
| $35,000 to $39,999 | 0 (0.0%) | 0 (0.0%) |
| $40,000 to $44,999 | 15 (22.1%) | 0 (0.0%) |
| $45,000 to $49,999 | 0 (0.0%) | 0 (0.0%) |
| $50,000 to $54,999 | 0 (0.0%) | 3 (6.1%) |
| $55,000 to $64,999 | 4 (5.9%) | 0 (0.0%) |
| $65,000 to $74,999 | 0 (0.0%) | 0 (0.0%) |
| $75,000 to $99,999 | 7 (10.3%) | 0 (0.0%) |
| $100,000+ | 5 (7.3%) | 2 (4.1%) |
| Total | 68 (100.0%) | 49 (100.0%) |
Earnings by Sex by Educational Attainment in Sauget
| Educational Attainment | Male Income | Female Income |
| Less than High School | - | - |
| High School Diploma | - | - |
| College or Associate's Degree | - | - |
| Bachelor's Degree | - | - |
| Graduate Degree | - | - |
| Total | $42,639 | $0 |
Family Income in Sauget
Family Income Brackets in Sauget
According to the Sauget family income data, there are 34 families falling into the $50,000 to $74,999 income range, which is the most common income bracket and makes up 54.8% of all families.

| Income Bracket | # Families | % Families |
| Less than $10,000 | 0 | 0.0% |
| $10,000 to $14,999 | 0 | 0.0% |
| $15,000 to $24,999 | 1 | 1.6% |
| $25,000 to $34,999 | 5 | 8.1% |
| $35,000 to $49,999 | 10 | 16.1% |
| $50,000 to $74,999 | 34 | 54.8% |
| $75,000 to $99,999 | 2 | 3.2% |
| $100,000 to $149,999 | 5 | 8.1% |
| $150,000 to $199,999 | 3 | 4.8% |
| $200,000+ | 2 | 3.2% |
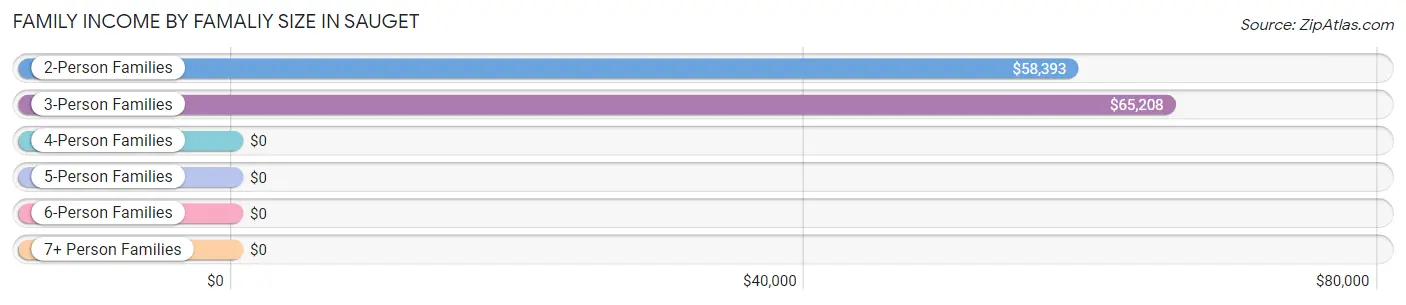
Family Income by Famaliy Size in Sauget
3-person families (22 | 35.5%) account for the highest median family income in Sauget with $65,208 per family, while 2-person families (37 | 59.7%) have the highest median income of $29,196 per family member.
| Income Bracket | # Families | Median Income |
| 2-Person Families | 37 (59.7%) | $58,393 |
| 3-Person Families | 22 (35.5%) | $65,208 |
| 4-Person Families | 3 (4.8%) | $0 |
| 5-Person Families | 0 (0.0%) | $0 |
| 6-Person Families | 0 (0.0%) | $0 |
| 7+ Person Families | 0 (0.0%) | $0 |
| Total | 62 (100.0%) | $59,643 |
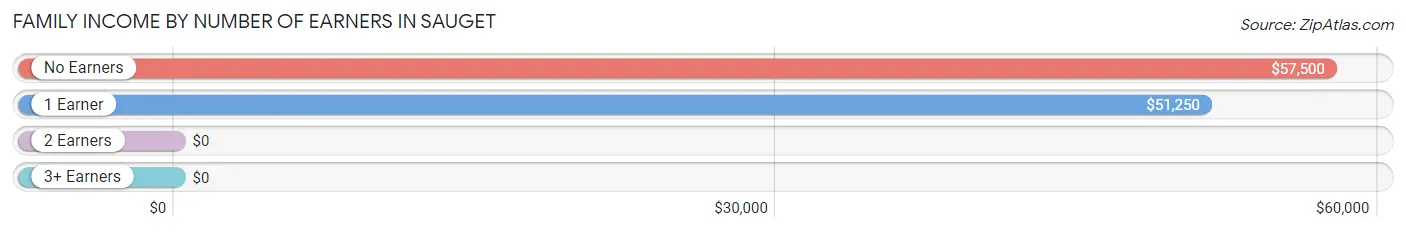
Family Income by Number of Earners in Sauget
| Number of Earners | # Families | Median Income |
| No Earners | 16 (25.8%) | $57,500 |
| 1 Earner | 31 (50.0%) | $51,250 |
| 2 Earners | 15 (24.2%) | $0 |
| 3+ Earners | 0 (0.0%) | $0 |
| Total | 62 (100.0%) | $59,643 |
Household Income in Sauget
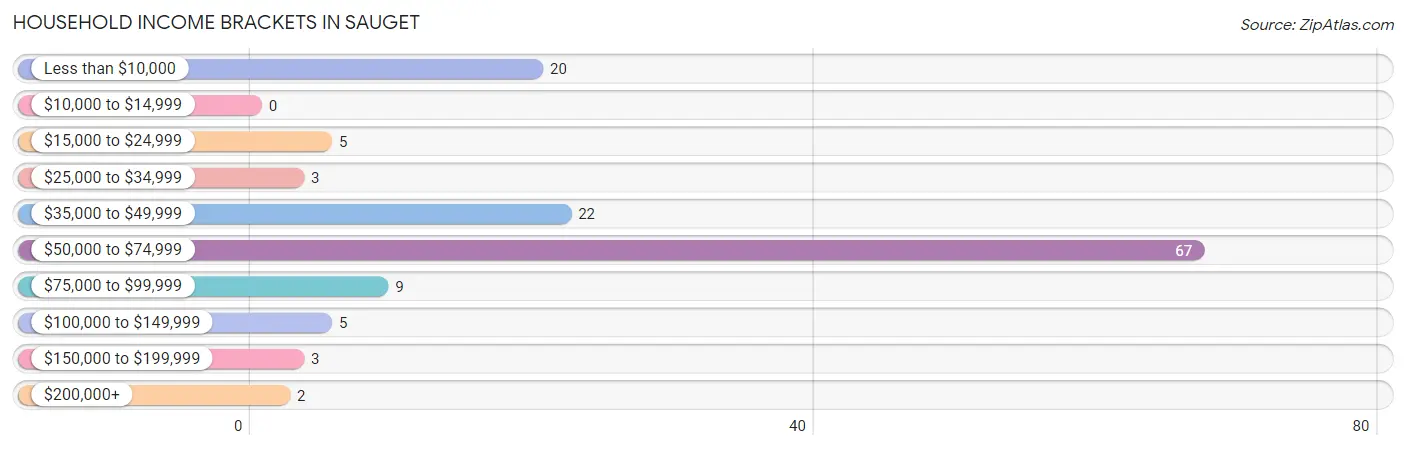
Household Income Brackets in Sauget
With 67 households falling in the category, the $50,000 to $74,999 income range is the most frequent in Sauget, accounting for 49.3% of all households.
| Income Bracket | # Households | % Households |
| Less than $10,000 | 20 | 14.7% |
| $10,000 to $14,999 | 0 | 0.0% |
| $15,000 to $24,999 | 5 | 3.7% |
| $25,000 to $34,999 | 3 | 2.2% |
| $35,000 to $49,999 | 22 | 16.2% |
| $50,000 to $74,999 | 67 | 49.3% |
| $75,000 to $99,999 | 9 | 6.6% |
| $100,000 to $149,999 | 5 | 3.7% |
| $150,000 to $199,999 | 3 | 2.2% |
| $200,000+ | 2 | 1.5% |
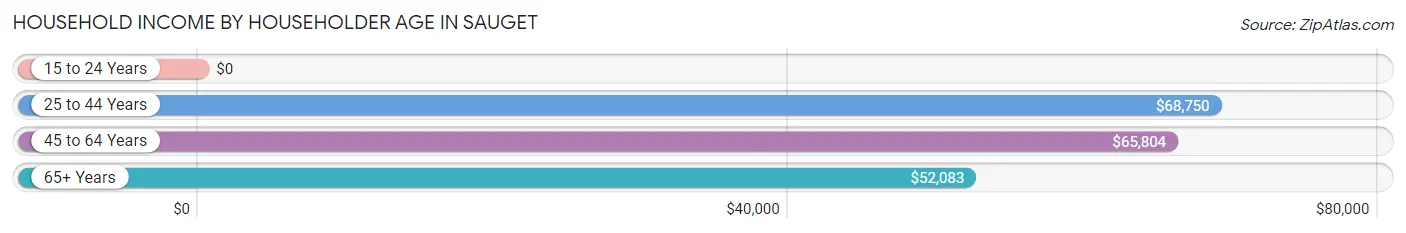
Household Income by Householder Age in Sauget
The median household income in Sauget is $58,684, with the highest median household income of $68,750 found in the 25 to 44 years age bracket for the primary householder. A total of 26 households (19.1%) fall into this category. Meanwhile, the 15 to 24 years age bracket for the primary householder has the lowest median household income of $0, with 10 households (7.3%) in this group.
| Income Bracket | # Households | Median Income |
| 15 to 24 Years | 10 (7.3%) | $0 |
| 25 to 44 Years | 26 (19.1%) | $68,750 |
| 45 to 64 Years | 29 (21.3%) | $65,804 |
| 65+ Years | 71 (52.2%) | $52,083 |
| Total | 136 (100.0%) | $58,684 |
Poverty in Sauget
Income Below Poverty by Sex and Age in Sauget
With 3.7% poverty level for males and 17.2% for females among the residents of Sauget, 25 to 34 year old males and 45 to 54 year old females are the most vulnerable to poverty, with 5 males (18.5%) and 3 females (60.0%) in their respective age groups living below the poverty level.
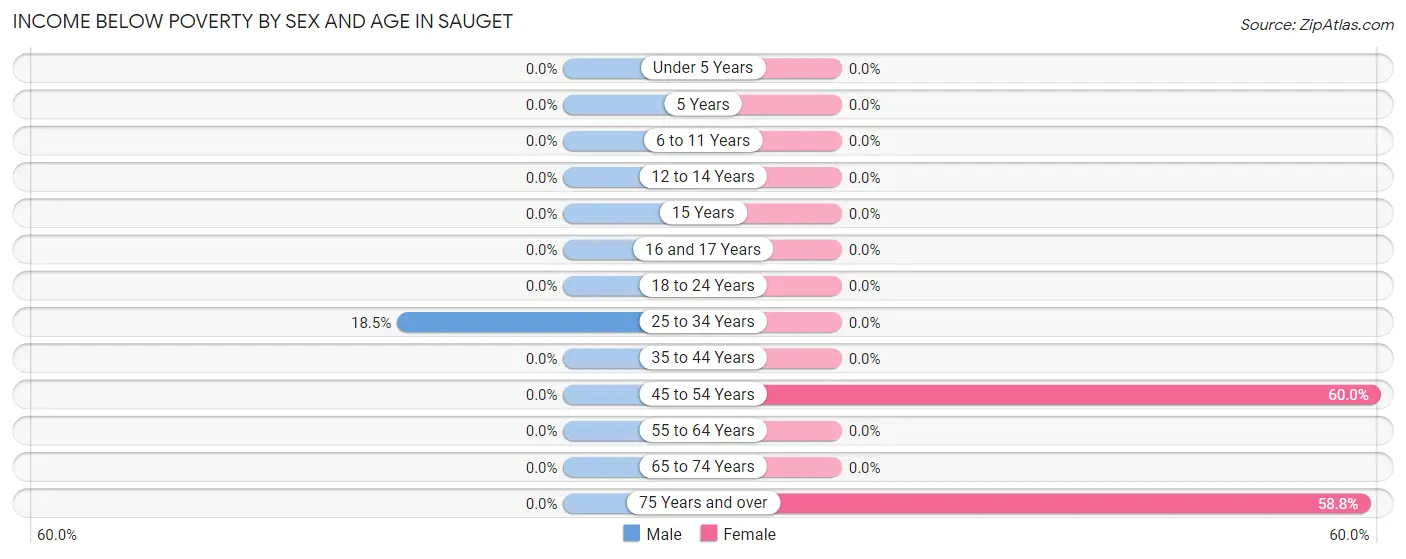
| Age Bracket | Male | Female |
| Under 5 Years | 0 (0.0%) | 0 (0.0%) |
| 5 Years | 0 (0.0%) | 0 (0.0%) |
| 6 to 11 Years | 0 (0.0%) | 0 (0.0%) |
| 12 to 14 Years | 0 (0.0%) | 0 (0.0%) |
| 15 Years | 0 (0.0%) | 0 (0.0%) |
| 16 and 17 Years | 0 (0.0%) | 0 (0.0%) |
| 18 to 24 Years | 0 (0.0%) | 0 (0.0%) |
| 25 to 34 Years | 5 (18.5%) | 0 (0.0%) |
| 35 to 44 Years | 0 (0.0%) | 0 (0.0%) |
| 45 to 54 Years | 0 (0.0%) | 3 (60.0%) |
| 55 to 64 Years | 0 (0.0%) | 0 (0.0%) |
| 65 to 74 Years | 0 (0.0%) | 0 (0.0%) |
| 75 Years and over | 0 (0.0%) | 20 (58.8%) |
| Total | 5 (3.7%) | 23 (17.2%) |
Income Above Poverty by Sex and Age in Sauget
According to the poverty statistics in Sauget, males aged under 5 years and females aged under 5 years are the age groups that are most secure financially, with 100.0% of males and 100.0% of females in these age groups living above the poverty line.
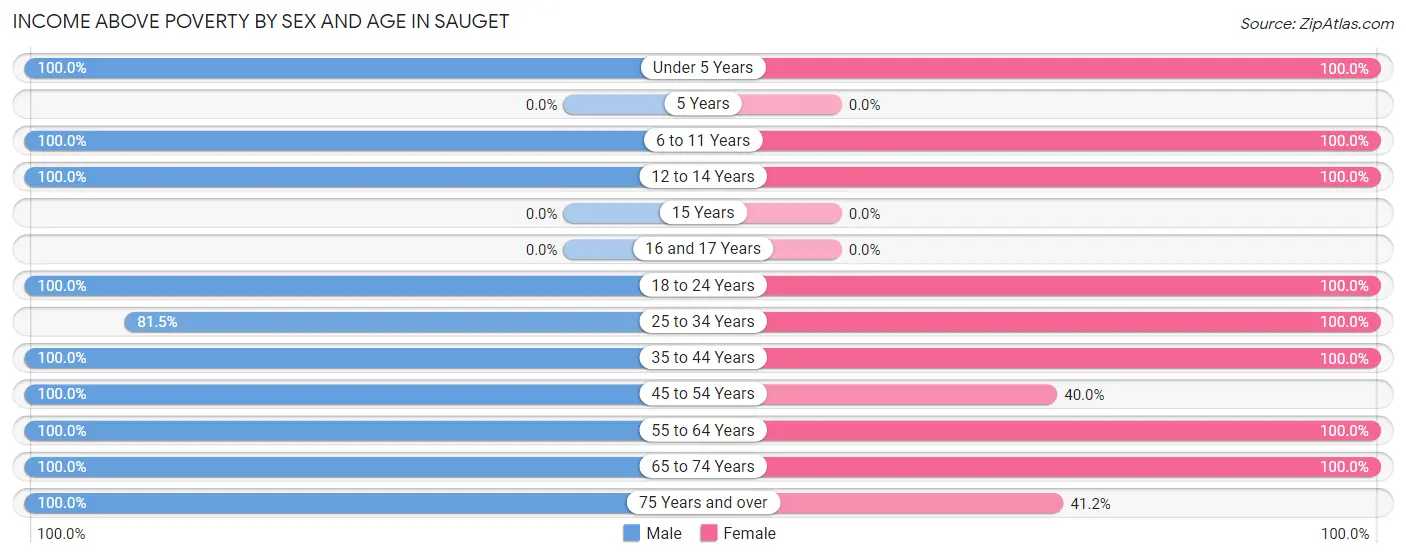
| Age Bracket | Male | Female |
| Under 5 Years | 3 (100.0%) | 6 (100.0%) |
| 5 Years | 0 (0.0%) | 0 (0.0%) |
| 6 to 11 Years | 3 (100.0%) | 9 (100.0%) |
| 12 to 14 Years | 6 (100.0%) | 3 (100.0%) |
| 15 Years | 0 (0.0%) | 0 (0.0%) |
| 16 and 17 Years | 0 (0.0%) | 0 (0.0%) |
| 18 to 24 Years | 23 (100.0%) | 13 (100.0%) |
| 25 to 34 Years | 22 (81.5%) | 3 (100.0%) |
| 35 to 44 Years | 17 (100.0%) | 3 (100.0%) |
| 45 to 54 Years | 4 (100.0%) | 2 (40.0%) |
| 55 to 64 Years | 26 (100.0%) | 28 (100.0%) |
| 65 to 74 Years | 19 (100.0%) | 30 (100.0%) |
| 75 Years and over | 8 (100.0%) | 14 (41.2%) |
| Total | 131 (96.3%) | 111 (82.8%) |
Income Below Poverty Among Married-Couple Families in Sauget
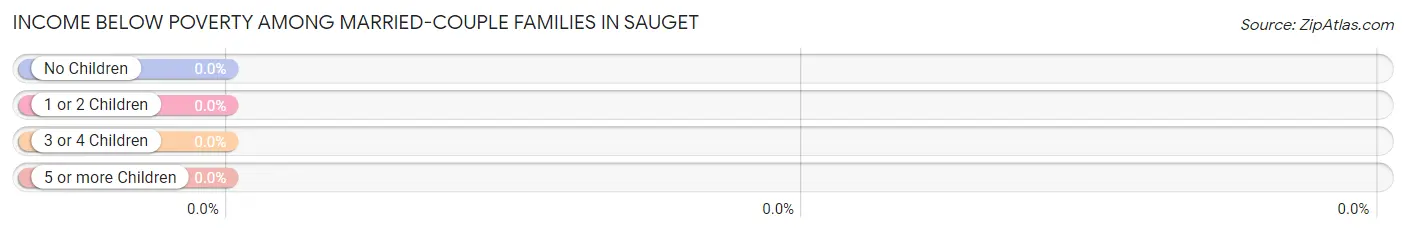
| Children | Above Poverty | Below Poverty |
| No Children | 38 (100.0%) | 0 (0.0%) |
| 1 or 2 Children | 3 (100.0%) | 0 (0.0%) |
| 3 or 4 Children | 0 (0.0%) | 0 (0.0%) |
| 5 or more Children | 0 (0.0%) | 0 (0.0%) |
| Total | 41 (100.0%) | 0 (0.0%) |
Income Below Poverty Among Single-Parent Households in Sauget
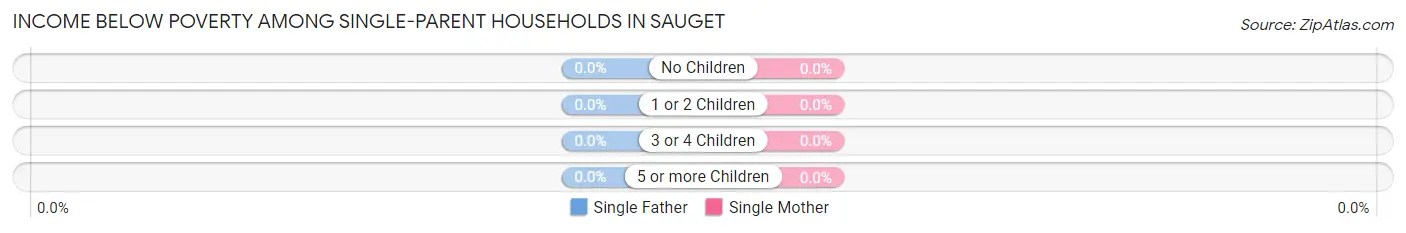
| Children | Single Father | Single Mother |
| No Children | 0 (0.0%) | 0 (0.0%) |
| 1 or 2 Children | 0 (0.0%) | 0 (0.0%) |
| 3 or 4 Children | 0 (0.0%) | 0 (0.0%) |
| 5 or more Children | 0 (0.0%) | 0 (0.0%) |
| Total | 0 (0.0%) | 0 (0.0%) |
Income Below Poverty Among Married-Couple vs Single-Parent Households in Sauget
| Children | Married-Couple Families | Single-Parent Households |
| No Children | 0 (0.0%) | 0 (0.0%) |
| 1 or 2 Children | 0 (0.0%) | 0 (0.0%) |
| 3 or 4 Children | 0 (0.0%) | 0 (0.0%) |
| 5 or more Children | 0 (0.0%) | 0 (0.0%) |
| Total | 0 (0.0%) | 0 (0.0%) |
Race in Sauget
The most populous races in Sauget are White / Caucasian (250 | 92.6%), Two or more Races (16 | 5.9%), and Black / African American (3 | 1.1%).
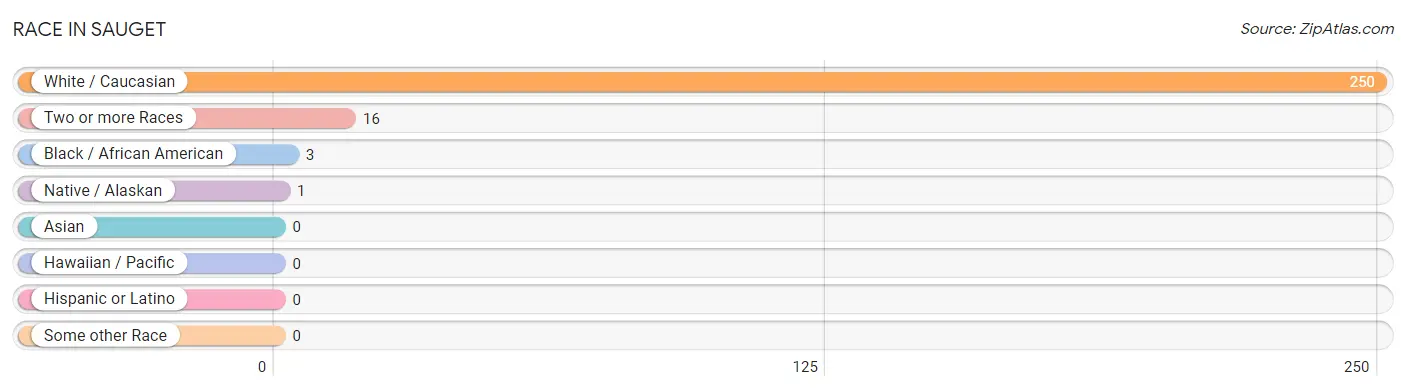
| Race | # Population | % Population |
| Asian | 0 | 0.0% |
| Black / African American | 3 | 1.1% |
| Hawaiian / Pacific | 0 | 0.0% |
| Hispanic or Latino | 0 | 0.0% |
| Native / Alaskan | 1 | 0.4% |
| White / Caucasian | 250 | 92.6% |
| Two or more Races | 16 | 5.9% |
| Some other Race | 0 | 0.0% |
| Total | 270 | 100.0% |
Ancestry in Sauget
The most populous ancestries reported in Sauget are German (50 | 18.5%), Irish (49 | 18.1%), English (18 | 6.7%), American (17 | 6.3%), and Croatian (9 | 3.3%), together accounting for 53.0% of all Sauget residents.
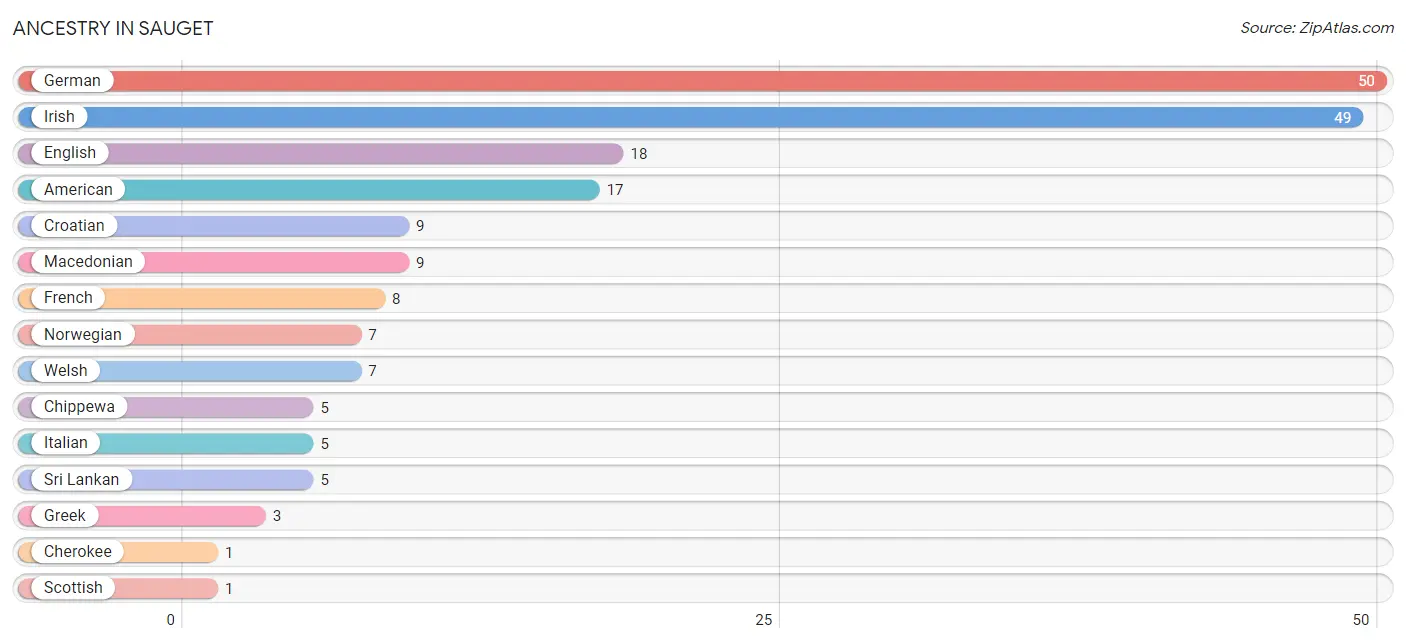
| Ancestry | # Population | % Population |
| American | 17 | 6.3% |
| Cherokee | 1 | 0.4% |
| Chippewa | 5 | 1.8% |
| Croatian | 9 | 3.3% |
| English | 18 | 6.7% |
| French | 8 | 3.0% |
| German | 50 | 18.5% |
| Greek | 3 | 1.1% |
| Irish | 49 | 18.1% |
| Italian | 5 | 1.8% |
| Macedonian | 9 | 3.3% |
| Norwegian | 7 | 2.6% |
| Scottish | 1 | 0.4% |
| Sri Lankan | 5 | 1.8% |
| Welsh | 7 | 2.6% | View All 15 Rows |
Immigrants in Sauget

| Immigration Origin | # Population | % Population | View All 0 Rows |
Sex and Age in Sauget
Sex and Age in Sauget
The most populous age groups in Sauget are 20 to 24 Years (19 | 14.0%) for men and 70 to 74 Years (28 | 20.9%) for women.
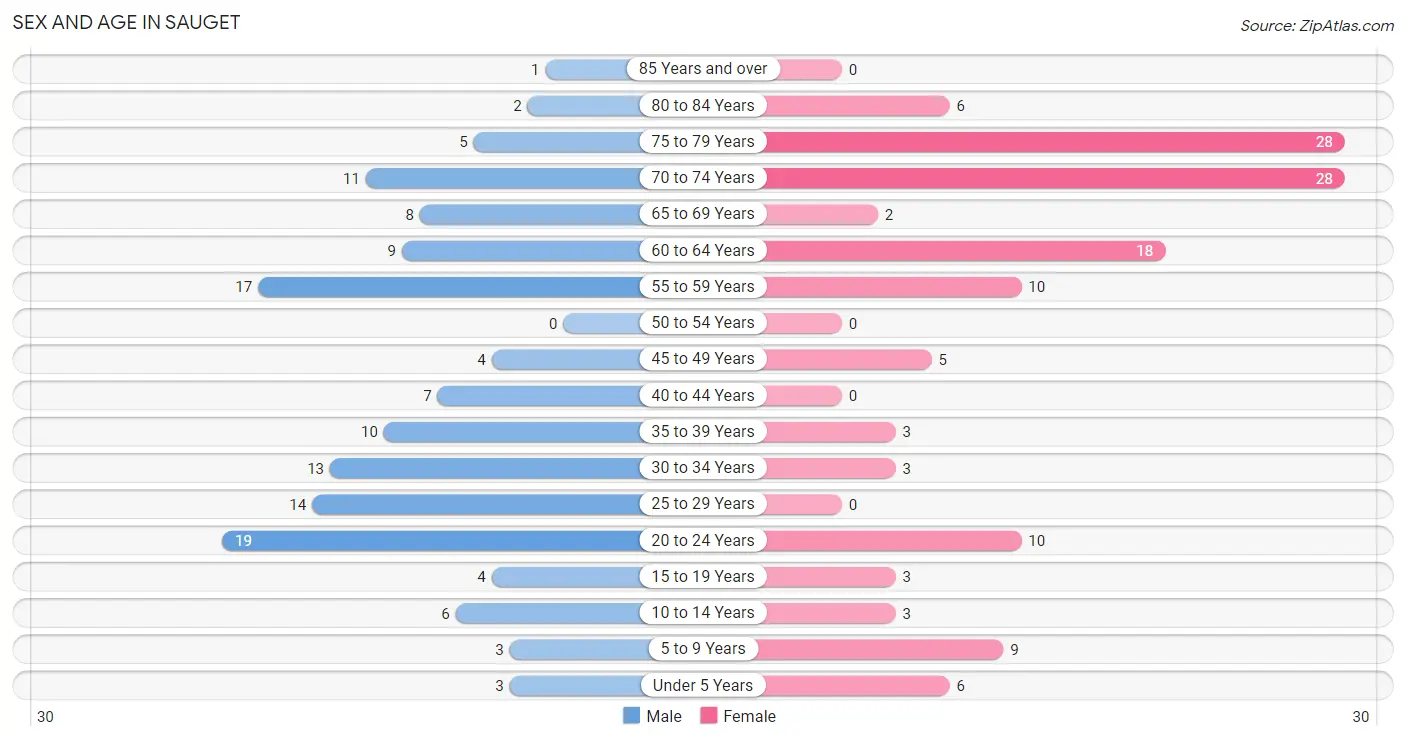
| Age Bracket | Male | Female |
| Under 5 Years | 3 (2.2%) | 6 (4.5%) |
| 5 to 9 Years | 3 (2.2%) | 9 (6.7%) |
| 10 to 14 Years | 6 (4.4%) | 3 (2.2%) |
| 15 to 19 Years | 4 (2.9%) | 3 (2.2%) |
| 20 to 24 Years | 19 (14.0%) | 10 (7.5%) |
| 25 to 29 Years | 14 (10.3%) | 0 (0.0%) |
| 30 to 34 Years | 13 (9.6%) | 3 (2.2%) |
| 35 to 39 Years | 10 (7.3%) | 3 (2.2%) |
| 40 to 44 Years | 7 (5.1%) | 0 (0.0%) |
| 45 to 49 Years | 4 (2.9%) | 5 (3.7%) |
| 50 to 54 Years | 0 (0.0%) | 0 (0.0%) |
| 55 to 59 Years | 17 (12.5%) | 10 (7.5%) |
| 60 to 64 Years | 9 (6.6%) | 18 (13.4%) |
| 65 to 69 Years | 8 (5.9%) | 2 (1.5%) |
| 70 to 74 Years | 11 (8.1%) | 28 (20.9%) |
| 75 to 79 Years | 5 (3.7%) | 28 (20.9%) |
| 80 to 84 Years | 2 (1.5%) | 6 (4.5%) |
| 85 Years and over | 1 (0.7%) | 0 (0.0%) |
| Total | 136 (100.0%) | 134 (100.0%) |
Families and Households in Sauget
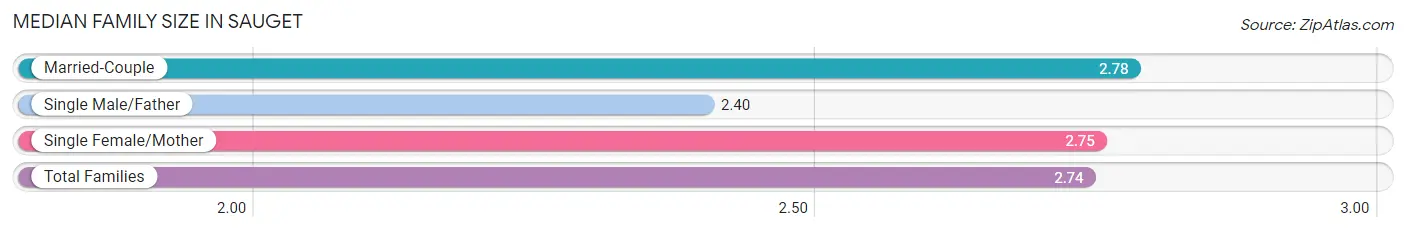
Median Family Size in Sauget
The median family size in Sauget is 2.74 persons per family, with married-couple families (41 | 66.1%) accounting for the largest median family size of 2.78 persons per family. On the other hand, single male/father families (5 | 8.1%) represent the smallest median family size with 2.40 persons per family.
| Family Type | # Families | Family Size |
| Married-Couple | 41 (66.1%) | 2.78 |
| Single Male/Father | 5 (8.1%) | 2.40 |
| Single Female/Mother | 16 (25.8%) | 2.75 |
| Total Families | 62 (100.0%) | 2.74 |
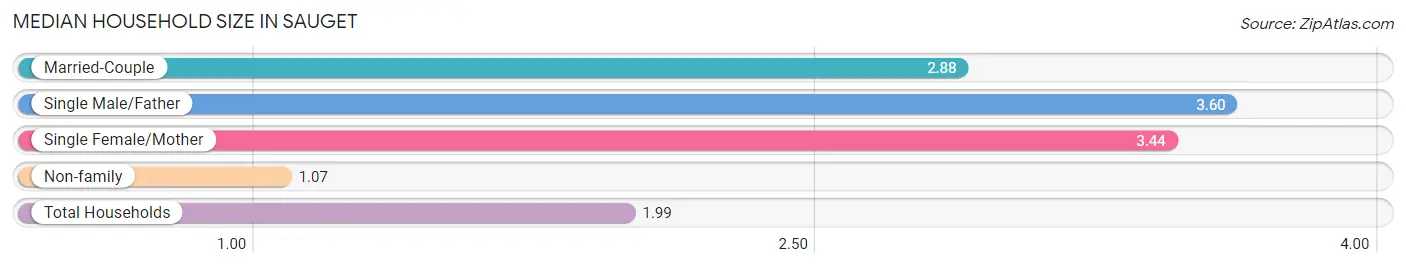
Median Household Size in Sauget
The median household size in Sauget is 1.99 persons per household, with single male/father households (5 | 3.7%) accounting for the largest median household size of 3.6 persons per household. non-family households (74 | 54.4%) represent the smallest median household size with 1.07 persons per household.
| Household Type | # Households | Household Size |
| Married-Couple | 41 (30.1%) | 2.88 |
| Single Male/Father | 5 (3.7%) | 3.60 |
| Single Female/Mother | 16 (11.8%) | 3.44 |
| Non-family | 74 (54.4%) | 1.07 |
| Total Households | 136 (100.0%) | 1.99 |
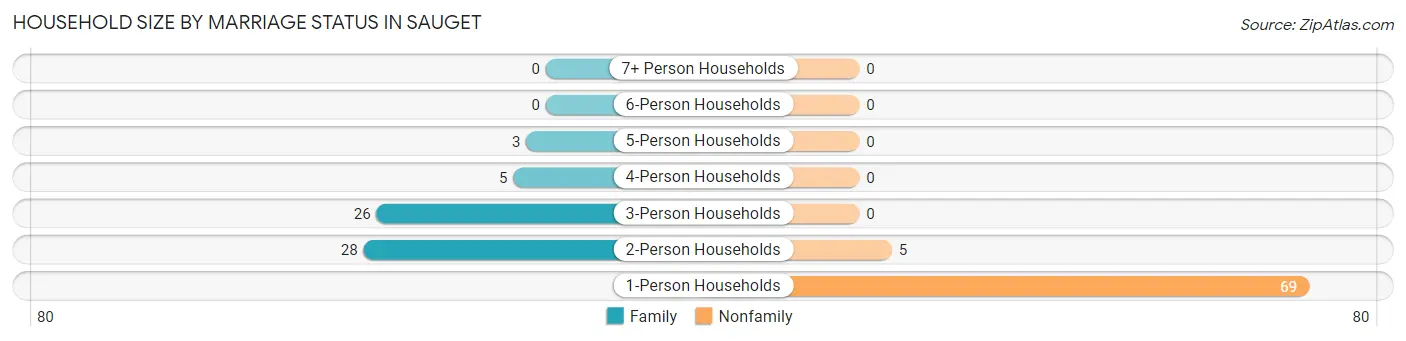
Household Size by Marriage Status in Sauget
Out of a total of 136 households in Sauget, 62 (45.6%) are family households, while 74 (54.4%) are nonfamily households. The most numerous type of family households are 2-person households, comprising 28, and the most common type of nonfamily households are 1-person households, comprising 69.
| Household Size | Family Households | Nonfamily Households |
| 1-Person Households | - | 69 (50.7%) |
| 2-Person Households | 28 (20.6%) | 5 (3.7%) |
| 3-Person Households | 26 (19.1%) | 0 (0.0%) |
| 4-Person Households | 5 (3.7%) | 0 (0.0%) |
| 5-Person Households | 3 (2.2%) | 0 (0.0%) |
| 6-Person Households | 0 (0.0%) | 0 (0.0%) |
| 7+ Person Households | 0 (0.0%) | 0 (0.0%) |
| Total | 62 (45.6%) | 74 (54.4%) |
Female Fertility in Sauget
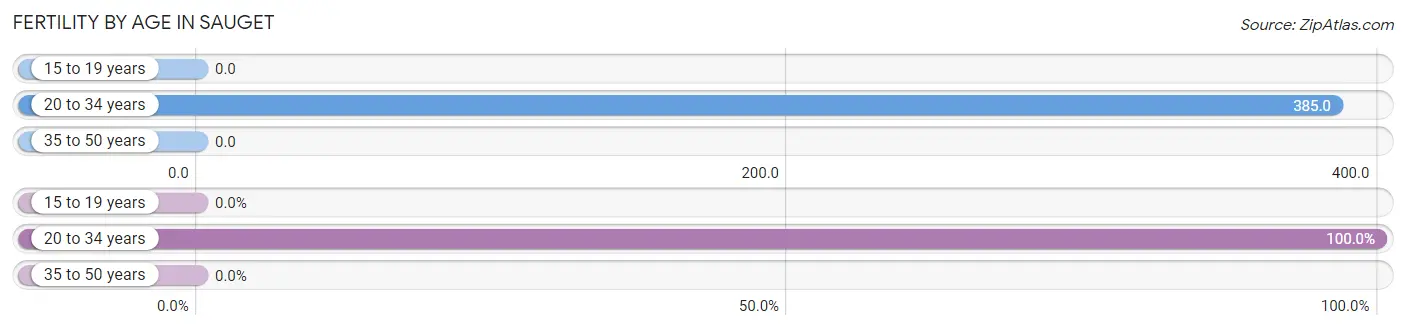
Fertility by Age in Sauget
Average fertility rate in Sauget is 208.0 births per 1,000 women. Women in the age bracket of 20 to 34 years have the highest fertility rate with 385.0 births per 1,000 women. Women in the age bracket of 20 to 34 years acount for 100.0% of all women with births.
| Age Bracket | Women with Births | Births / 1,000 Women |
| 15 to 19 years | 0 (0.0%) | 0.0 |
| 20 to 34 years | 5 (100.0%) | 385.0 |
| 35 to 50 years | 0 (0.0%) | 0.0 |
| Total | 5 (100.0%) | 208.0 |
Fertility by Age by Marriage Status in Sauget
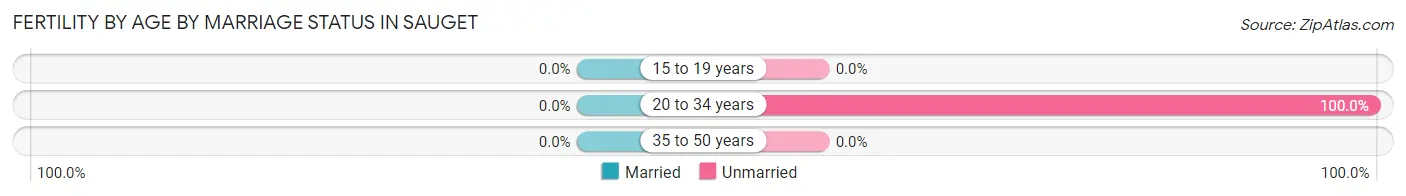
| Age Bracket | Married | Unmarried |
| 15 to 19 years | 0 (0.0%) | 0 (0.0%) |
| 20 to 34 years | 0 (0.0%) | 5 (100.0%) |
| 35 to 50 years | 0 (0.0%) | 0 (0.0%) |
| Total | 0 (0.0%) | 5 (100.0%) |
Fertility by Education in Sauget
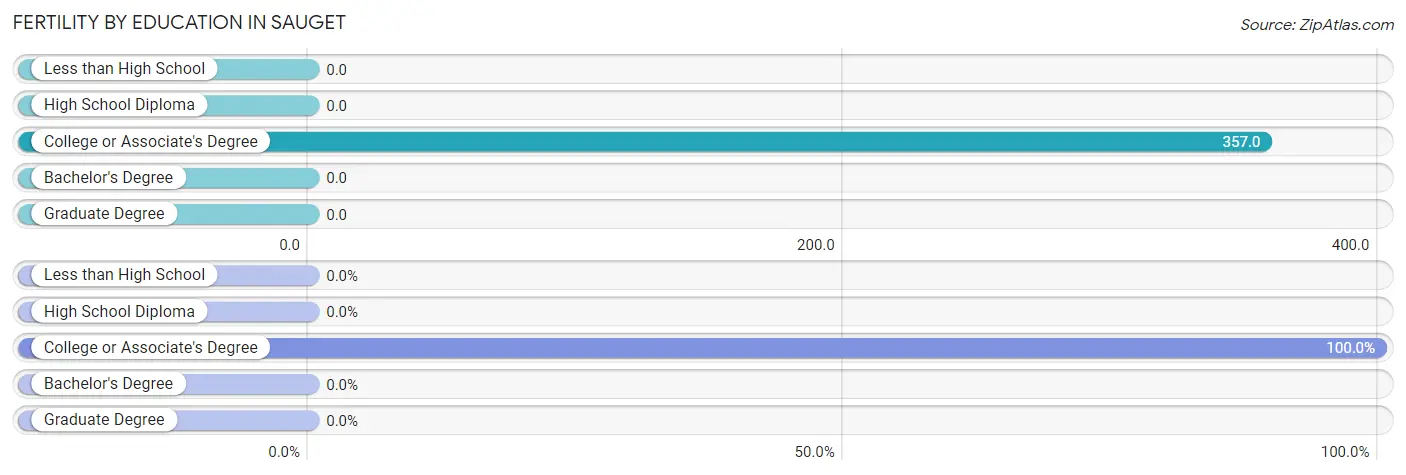
| Educational Attainment | Women with Births | Births / 1,000 Women |
| Less than High School | 0 (0.0%) | 0.0 |
| High School Diploma | 0 (0.0%) | 0.0 |
| College or Associate's Degree | 5 (100.0%) | 357.0 |
| Bachelor's Degree | 0 (0.0%) | 0.0 |
| Graduate Degree | 0 (0.0%) | 0.0 |
| Total | 5 (100.0%) | 208.0 |
Fertility by Education by Marriage Status in Sauget
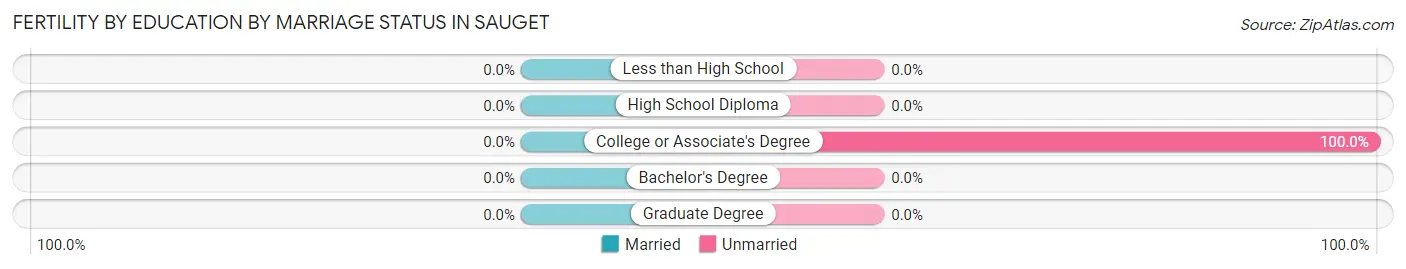
| Educational Attainment | Married | Unmarried |
| Less than High School | 0 (0.0%) | 0 (0.0%) |
| High School Diploma | 0 (0.0%) | 0 (0.0%) |
| College or Associate's Degree | 0 (0.0%) | 5 (100.0%) |
| Bachelor's Degree | 0 (0.0%) | 0 (0.0%) |
| Graduate Degree | 0 (0.0%) | 0 (0.0%) |
| Total | 0 (0.0%) | 5 (100.0%) |
Employment Characteristics in Sauget
Employment by Class of Employer in Sauget
Among the 71 employed individuals in Sauget, private company employees (48 | 67.6%), local government employees (12 | 16.9%), and self-employed (not incorporated) (6 | 8.5%) make up the most common classes of employment.
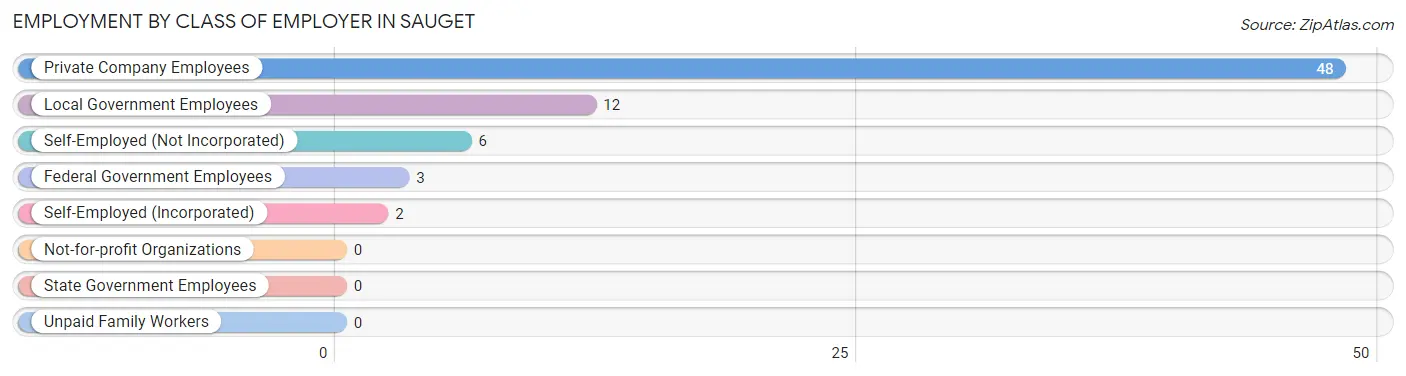
| Employer Class | # Employees | % Employees |
| Private Company Employees | 48 | 67.6% |
| Self-Employed (Incorporated) | 2 | 2.8% |
| Self-Employed (Not Incorporated) | 6 | 8.5% |
| Not-for-profit Organizations | 0 | 0.0% |
| Local Government Employees | 12 | 16.9% |
| State Government Employees | 0 | 0.0% |
| Federal Government Employees | 3 | 4.2% |
| Unpaid Family Workers | 0 | 0.0% |
| Total | 71 | 100.0% |
Employment Status by Age in Sauget
According to the labor force statistics for Sauget, out of the total population over 16 years of age (240), 40.4% or 97 individuals are in the labor force, with 26.8% or 26 of them unemployed. The age group with the highest labor force participation rate is 25 to 29 years, with 100.0% or 14 individuals in the labor force. Within the labor force, the 60 to 64 years age range has the highest percentage of unemployed individuals, with 90.0% or 18 of them being unemployed.
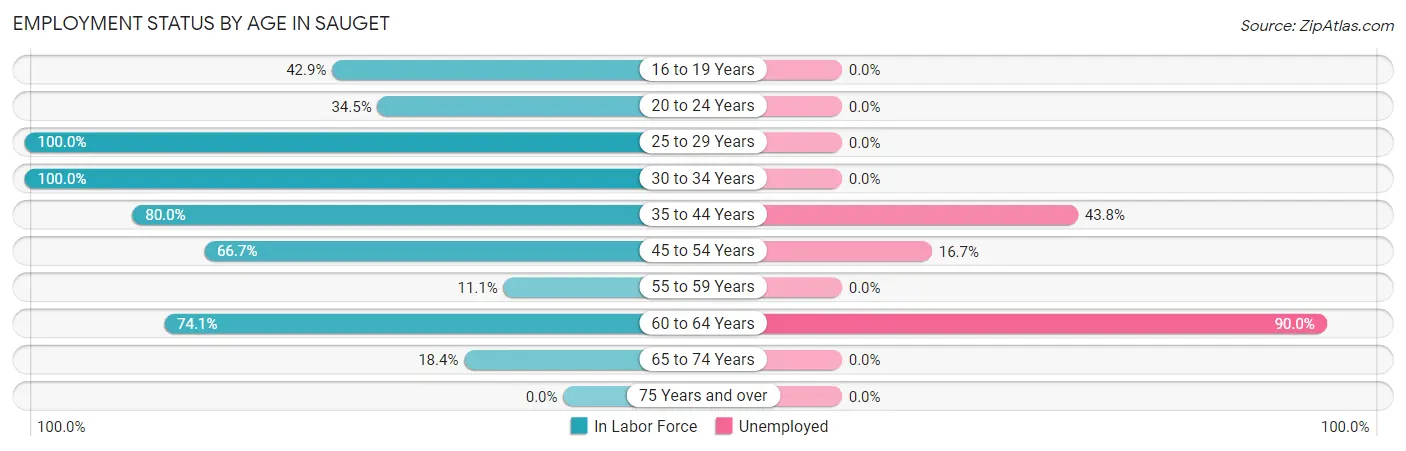
| Age Bracket | In Labor Force | Unemployed |
| 16 to 19 Years | 3 (42.9%) | 0 (0.0%) |
| 20 to 24 Years | 10 (34.5%) | 0 (0.0%) |
| 25 to 29 Years | 14 (100.0%) | 0 (0.0%) |
| 30 to 34 Years | 16 (100.0%) | 0 (0.0%) |
| 35 to 44 Years | 16 (80.0%) | 7 (43.8%) |
| 45 to 54 Years | 6 (66.7%) | 1 (16.7%) |
| 55 to 59 Years | 3 (11.1%) | 0 (0.0%) |
| 60 to 64 Years | 20 (74.1%) | 18 (90.0%) |
| 65 to 74 Years | 9 (18.4%) | 0 (0.0%) |
| 75 Years and over | 0 (0.0%) | 0 (0.0%) |
| Total | 97 (40.4%) | 26 (26.8%) |
Employment Status by Educational Attainment in Sauget
According to labor force statistics for Sauget, 66.4% of individuals (75) out of the total population between 25 and 64 years of age (113) are in the labor force, with 34.7% or 26 of them being unemployed. The group with the highest labor force participation rate are those with the educational attainment of bachelor's degree or higher, with 100.0% or 2 individuals in the labor force. Within the labor force, individuals with high school diploma education have the highest percentage of unemployment, with 59.4% or 19 of them being unemployed.
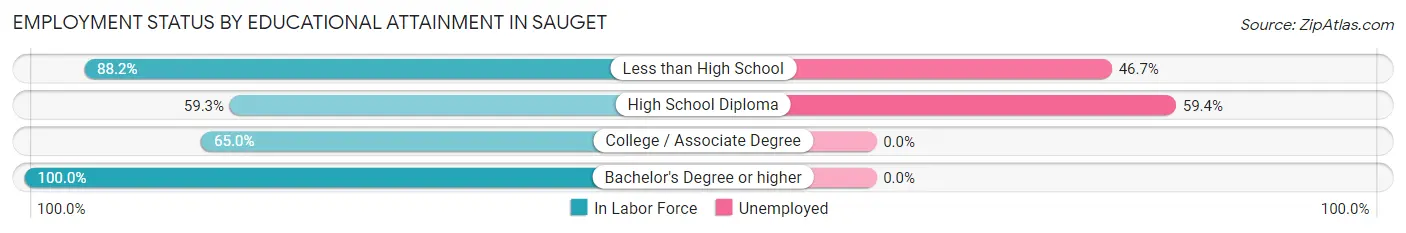
| Educational Attainment | In Labor Force | Unemployed |
| Less than High School | 15 (88.2%) | 8 (46.7%) |
| High School Diploma | 32 (59.3%) | 32 (59.4%) |
| College / Associate Degree | 26 (65.0%) | 0 (0.0%) |
| Bachelor's Degree or higher | 2 (100.0%) | 0 (0.0%) |
| Total | 75 (66.4%) | 39 (34.7%) |
Employment Occupations by Sex in Sauget
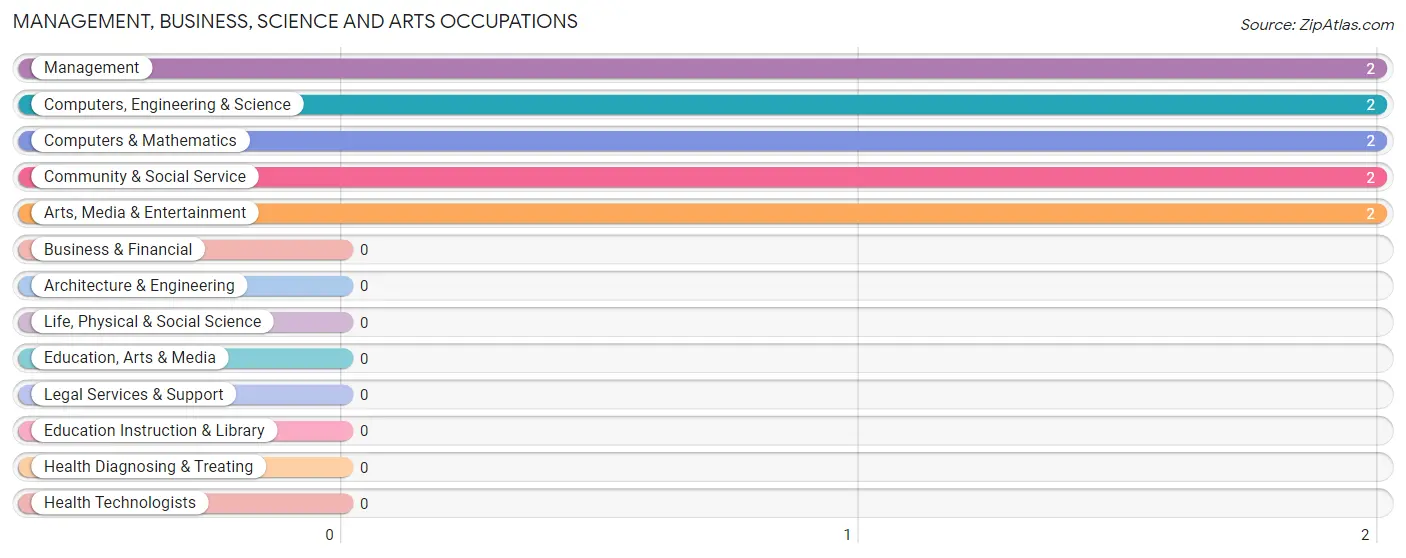
Management, Business, Science and Arts Occupations
The most common Management, Business, Science and Arts occupations in Sauget are Management (2 | 2.8%), Computers, Engineering & Science (2 | 2.8%), Computers & Mathematics (2 | 2.8%), Community & Social Service (2 | 2.8%), and Arts, Media & Entertainment (2 | 2.8%).
Management, Business, Science and Arts Occupations by Sex
Within the Management, Business, Science and Arts occupations in Sauget, the most male-oriented occupations are Management (100.0%), Community & Social Service (100.0%), and Arts, Media & Entertainment (100.0%), while the most female-oriented occupations are Computers, Engineering & Science (100.0%), and Computers & Mathematics (100.0%).
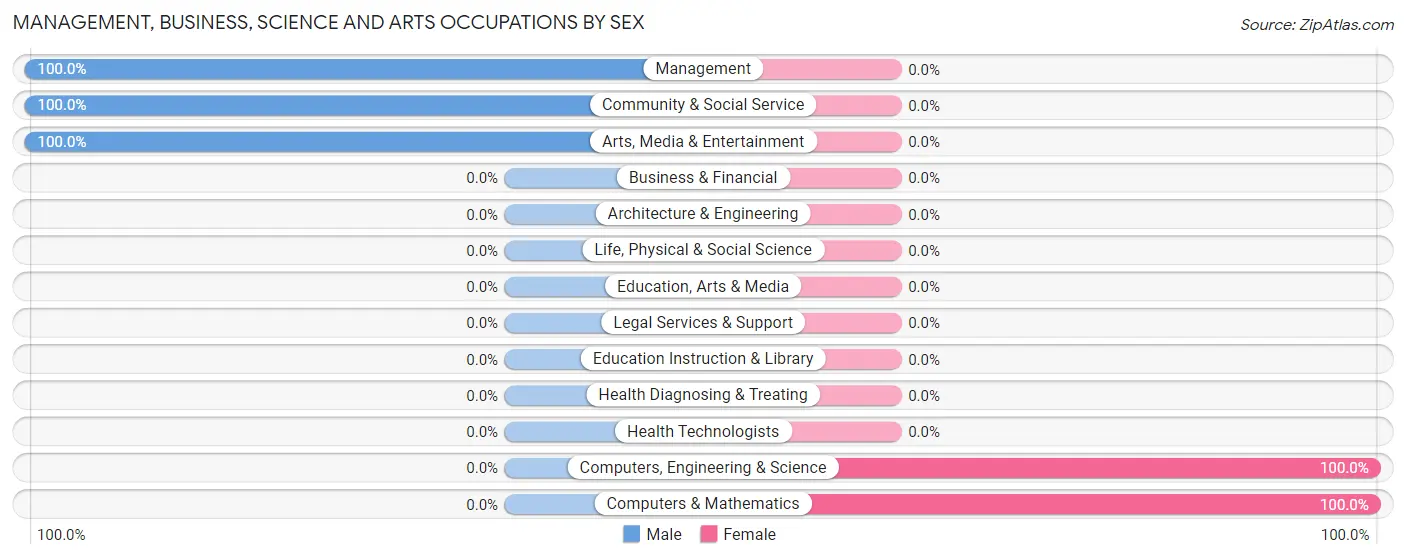
| Occupation | Male | Female |
| Management | 2 (100.0%) | 0 (0.0%) |
| Business & Financial | 0 (0.0%) | 0 (0.0%) |
| Computers, Engineering & Science | 0 (0.0%) | 2 (100.0%) |
| Computers & Mathematics | 0 (0.0%) | 2 (100.0%) |
| Architecture & Engineering | 0 (0.0%) | 0 (0.0%) |
| Life, Physical & Social Science | 0 (0.0%) | 0 (0.0%) |
| Community & Social Service | 2 (100.0%) | 0 (0.0%) |
| Education, Arts & Media | 0 (0.0%) | 0 (0.0%) |
| Legal Services & Support | 0 (0.0%) | 0 (0.0%) |
| Education Instruction & Library | 0 (0.0%) | 0 (0.0%) |
| Arts, Media & Entertainment | 2 (100.0%) | 0 (0.0%) |
| Health Diagnosing & Treating | 0 (0.0%) | 0 (0.0%) |
| Health Technologists | 0 (0.0%) | 0 (0.0%) |
| Total (Category) | 4 (66.7%) | 2 (33.3%) |
| Total (Overall) | 40 (56.3%) | 31 (43.7%) |
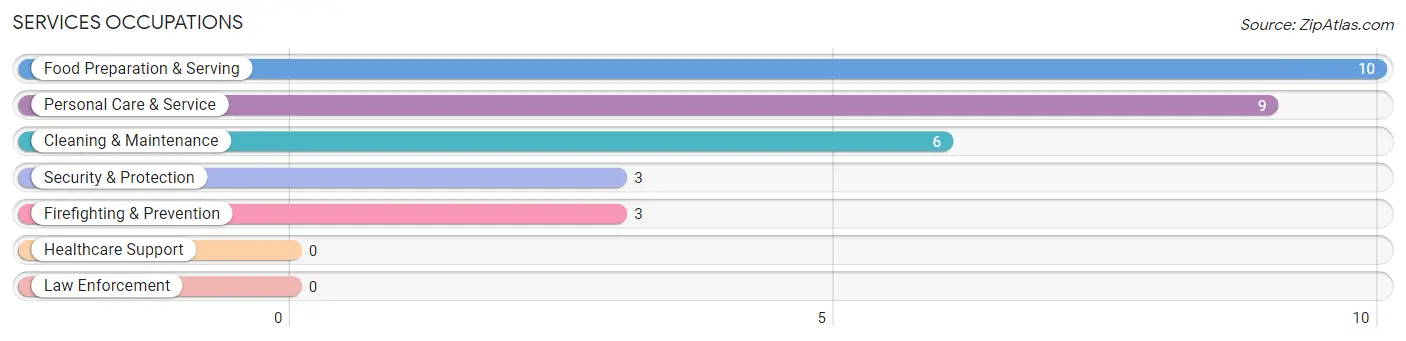
Services Occupations
The most common Services occupations in Sauget are Food Preparation & Serving (10 | 14.1%), Personal Care & Service (9 | 12.7%), Cleaning & Maintenance (6 | 8.5%), Security & Protection (3 | 4.2%), and Firefighting & Prevention (3 | 4.2%).
Services Occupations by Sex
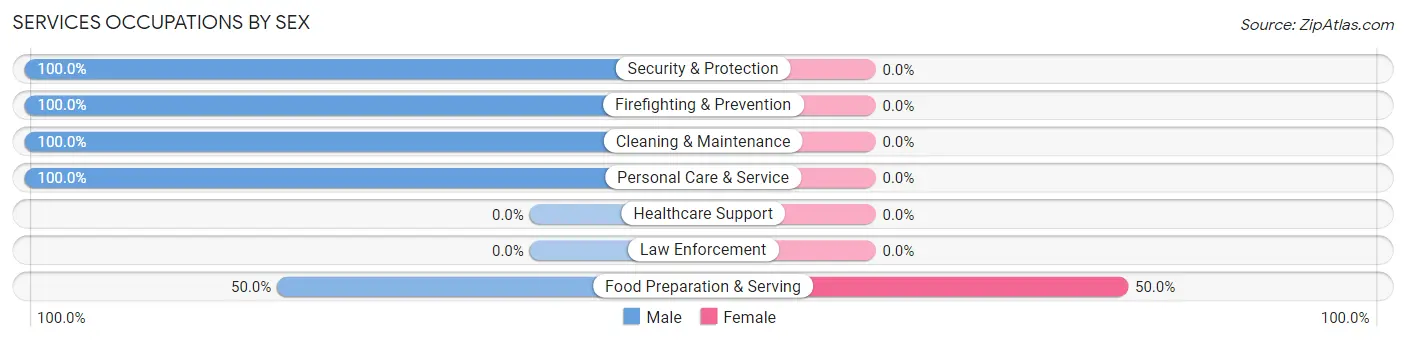
| Occupation | Male | Female |
| Healthcare Support | 0 (0.0%) | 0 (0.0%) |
| Security & Protection | 3 (100.0%) | 0 (0.0%) |
| Firefighting & Prevention | 3 (100.0%) | 0 (0.0%) |
| Law Enforcement | 0 (0.0%) | 0 (0.0%) |
| Food Preparation & Serving | 5 (50.0%) | 5 (50.0%) |
| Cleaning & Maintenance | 6 (100.0%) | 0 (0.0%) |
| Personal Care & Service | 9 (100.0%) | 0 (0.0%) |
| Total (Category) | 23 (82.1%) | 5 (17.9%) |
| Total (Overall) | 40 (56.3%) | 31 (43.7%) |
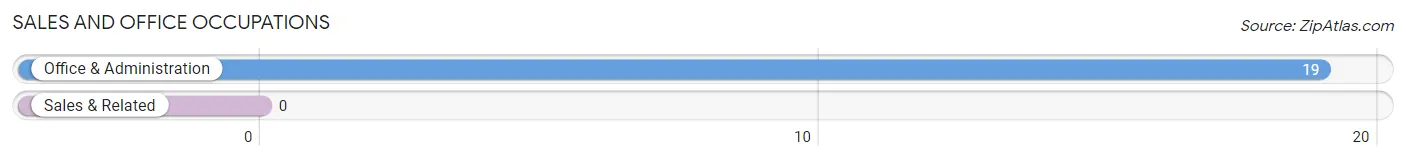
Sales and Office Occupations
The most common Sales and Office occupations in Sauget are , and Office & Administration (19 | 26.8%).
Sales and Office Occupations by Sex
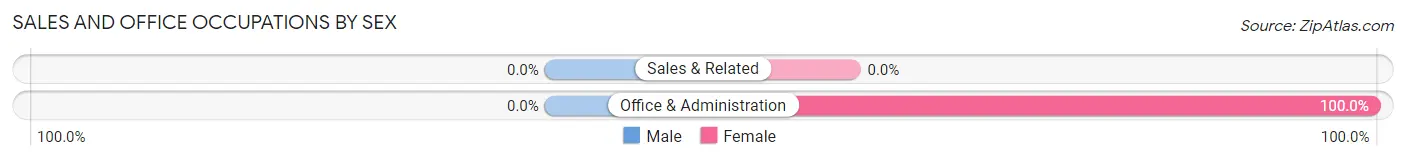
| Occupation | Male | Female |
| Sales & Related | 0 (0.0%) | 0 (0.0%) |
| Office & Administration | 0 (0.0%) | 19 (100.0%) |
| Total (Category) | 0 (0.0%) | 19 (100.0%) |
| Total (Overall) | 40 (56.3%) | 31 (43.7%) |
Natural Resources, Construction and Maintenance Occupations
The most common Natural Resources, Construction and Maintenance occupations in Sauget are , and Construction & Extraction (4 | 5.6%).
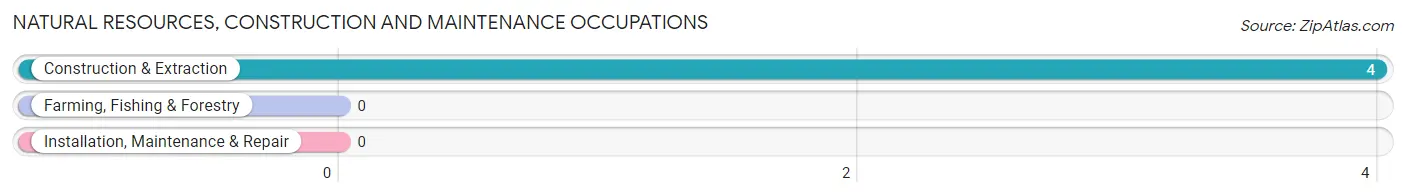
Natural Resources, Construction and Maintenance Occupations by Sex
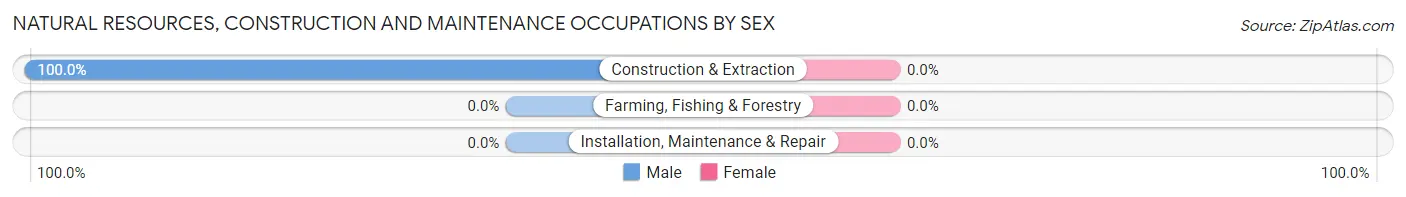
| Occupation | Male | Female |
| Farming, Fishing & Forestry | 0 (0.0%) | 0 (0.0%) |
| Construction & Extraction | 4 (100.0%) | 0 (0.0%) |
| Installation, Maintenance & Repair | 0 (0.0%) | 0 (0.0%) |
| Total (Category) | 4 (100.0%) | 0 (0.0%) |
| Total (Overall) | 40 (56.3%) | 31 (43.7%) |
Production, Transportation and Moving Occupations
The most common Production, Transportation and Moving occupations in Sauget are , and Material Moving (14 | 19.7%).
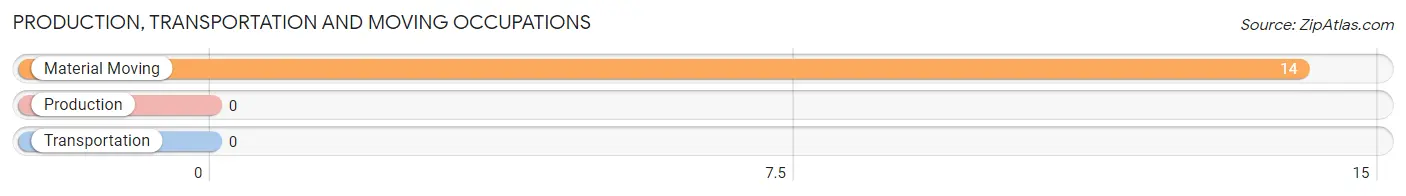
Production, Transportation and Moving Occupations by Sex
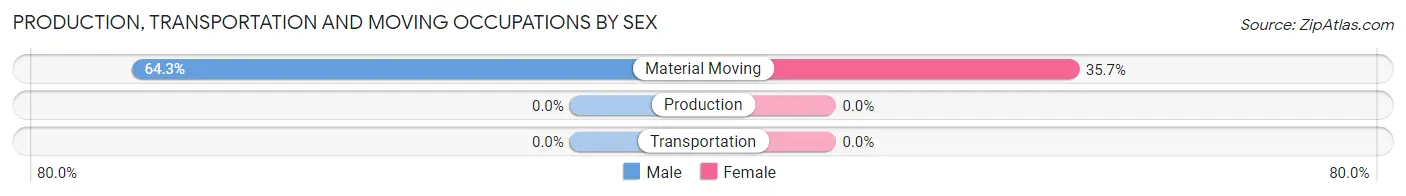
| Occupation | Male | Female |
| Production | 0 (0.0%) | 0 (0.0%) |
| Transportation | 0 (0.0%) | 0 (0.0%) |
| Material Moving | 9 (64.3%) | 5 (35.7%) |
| Total (Category) | 9 (64.3%) | 5 (35.7%) |
| Total (Overall) | 40 (56.3%) | 31 (43.7%) |
Employment Industries by Sex in Sauget
Employment Industries in Sauget
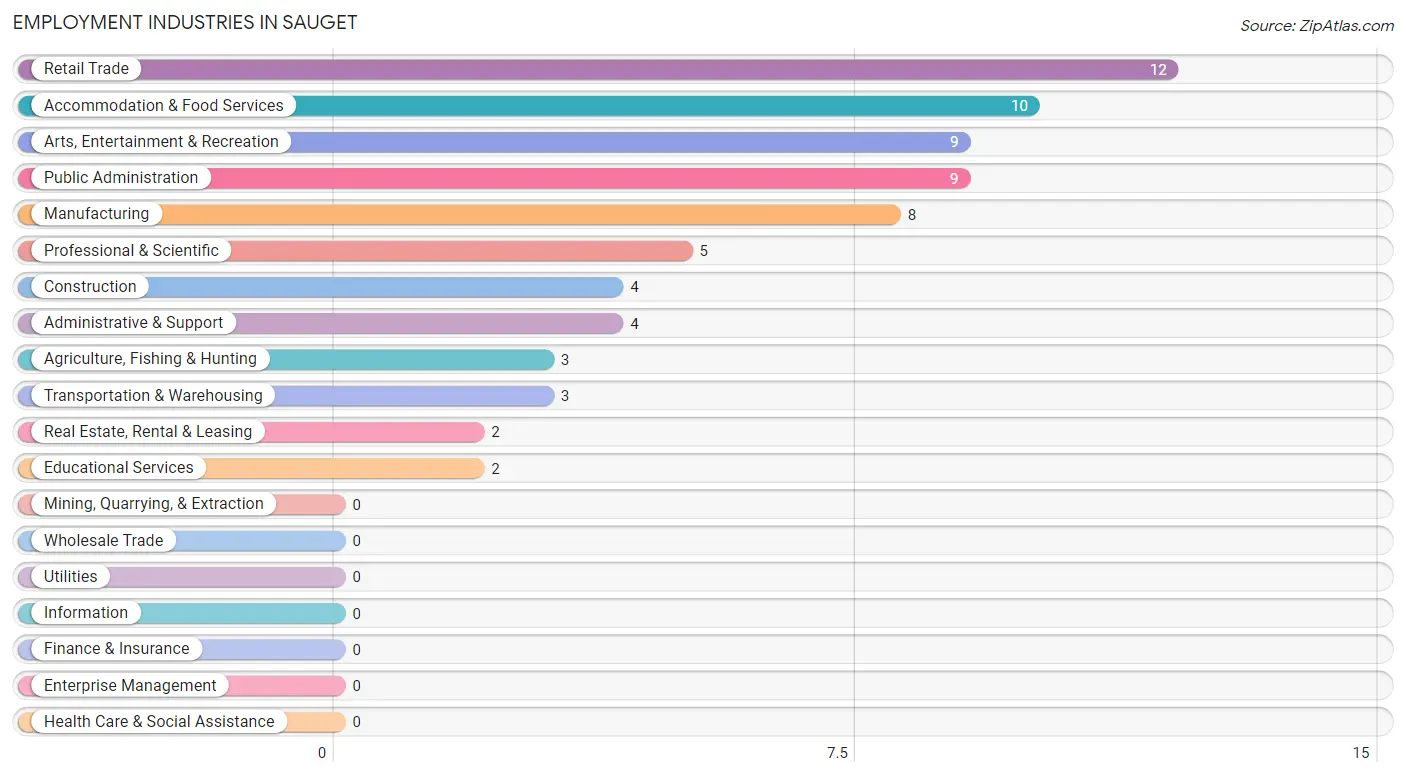
The major employment industries in Sauget include Retail Trade (12 | 16.9%), Accommodation & Food Services (10 | 14.1%), Arts, Entertainment & Recreation (9 | 12.7%), Public Administration (9 | 12.7%), and Manufacturing (8 | 11.3%).
Employment Industries by Sex in Sauget
The Sauget industries that see more men than women are Construction (100.0%), Transportation & Warehousing (100.0%), and Real Estate, Rental & Leasing (100.0%), whereas the industries that tend to have a higher number of women are Agriculture, Fishing & Hunting (100.0%), Retail Trade (100.0%), and Public Administration (66.7%).
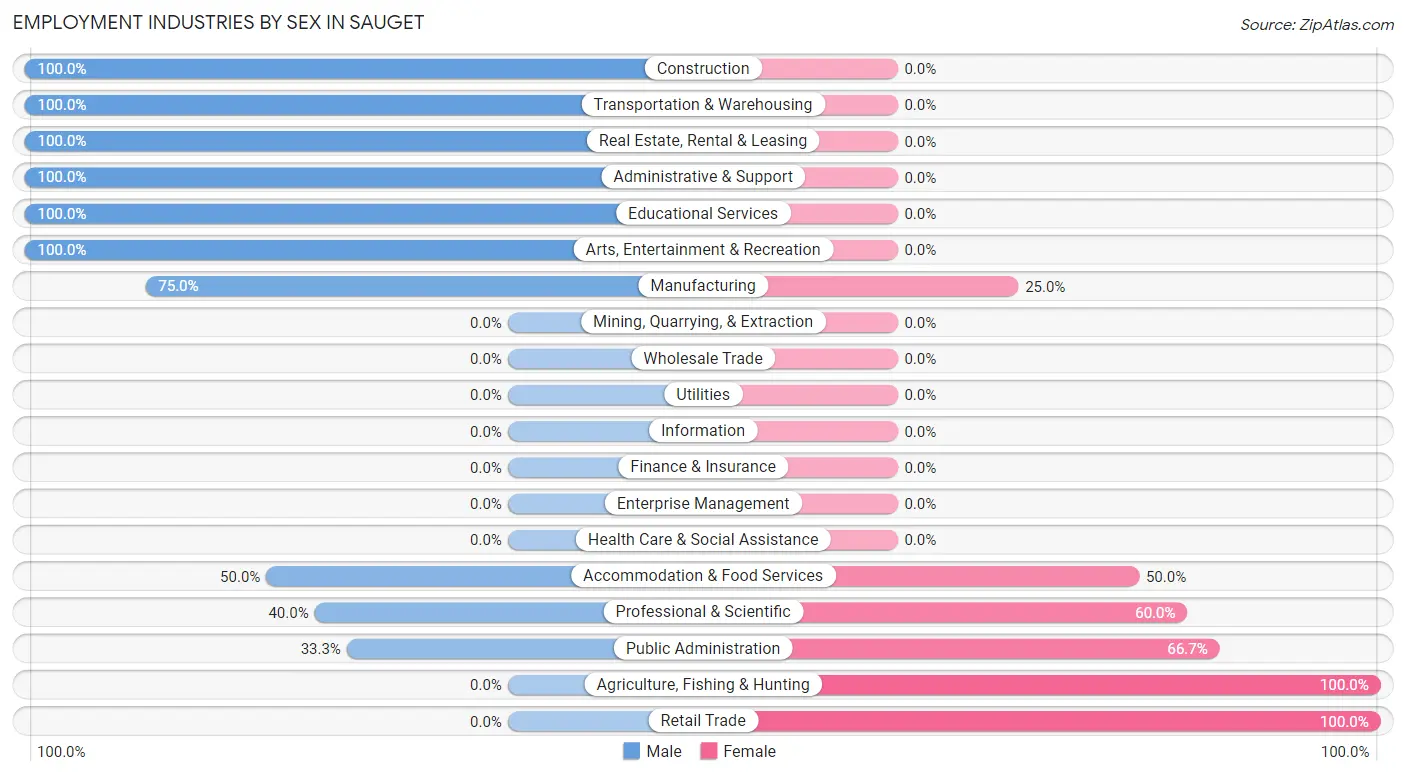
| Industry | Male | Female |
| Agriculture, Fishing & Hunting | 0 (0.0%) | 3 (100.0%) |
| Mining, Quarrying, & Extraction | 0 (0.0%) | 0 (0.0%) |
| Construction | 4 (100.0%) | 0 (0.0%) |
| Manufacturing | 6 (75.0%) | 2 (25.0%) |
| Wholesale Trade | 0 (0.0%) | 0 (0.0%) |
| Retail Trade | 0 (0.0%) | 12 (100.0%) |
| Transportation & Warehousing | 3 (100.0%) | 0 (0.0%) |
| Utilities | 0 (0.0%) | 0 (0.0%) |
| Information | 0 (0.0%) | 0 (0.0%) |
| Finance & Insurance | 0 (0.0%) | 0 (0.0%) |
| Real Estate, Rental & Leasing | 2 (100.0%) | 0 (0.0%) |
| Professional & Scientific | 2 (40.0%) | 3 (60.0%) |
| Enterprise Management | 0 (0.0%) | 0 (0.0%) |
| Administrative & Support | 4 (100.0%) | 0 (0.0%) |
| Educational Services | 2 (100.0%) | 0 (0.0%) |
| Health Care & Social Assistance | 0 (0.0%) | 0 (0.0%) |
| Arts, Entertainment & Recreation | 9 (100.0%) | 0 (0.0%) |
| Accommodation & Food Services | 5 (50.0%) | 5 (50.0%) |
| Public Administration | 3 (33.3%) | 6 (66.7%) |
| Total | 40 (56.3%) | 31 (43.7%) |
Education in Sauget
School Enrollment in Sauget
The most common levels of schooling among the 44 students in Sauget are college / undergraduate (20 | 45.5%), elementary school (12 | 27.3%), and middle school (9 | 20.4%).
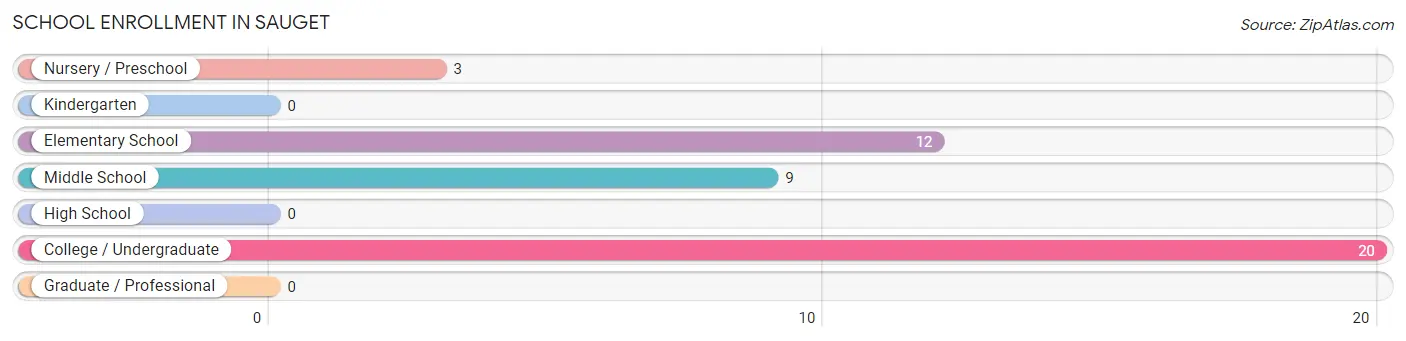
| School Level | # Students | % Students |
| Nursery / Preschool | 3 | 6.8% |
| Kindergarten | 0 | 0.0% |
| Elementary School | 12 | 27.3% |
| Middle School | 9 | 20.4% |
| High School | 0 | 0.0% |
| College / Undergraduate | 20 | 45.5% |
| Graduate / Professional | 0 | 0.0% |
| Total | 44 | 100.0% |
School Enrollment by Age by Funding Source in Sauget
Out of a total of 44 students who are enrolled in schools in Sauget, 6 (13.6%) attend a private institution, while the remaining 38 (86.4%) are enrolled in public schools. The age group of 5 to 9 year old has the highest likelihood of being enrolled in private schools, with 6 (50.0% in the age bracket) enrolled. Conversely, the age group of 3 to 4 year olds has the lowest likelihood of being enrolled in a private school, with 3 (100.0% in the age bracket) attending a public institution.
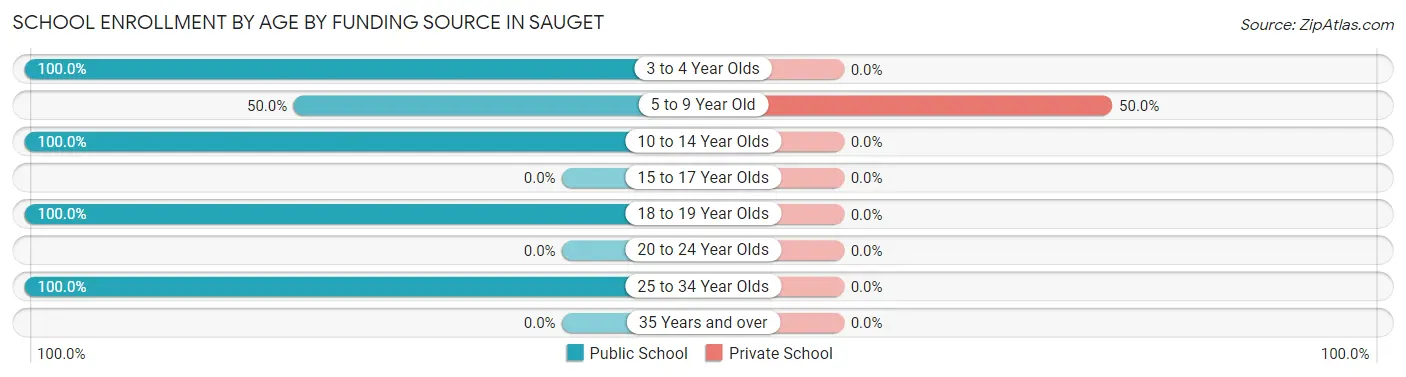
| Age Bracket | Public School | Private School |
| 3 to 4 Year Olds | 3 (100.0%) | 0 (0.0%) |
| 5 to 9 Year Old | 6 (50.0%) | 6 (50.0%) |
| 10 to 14 Year Olds | 9 (100.0%) | 0 (0.0%) |
| 15 to 17 Year Olds | 0 (0.0%) | 0 (0.0%) |
| 18 to 19 Year Olds | 3 (100.0%) | 0 (0.0%) |
| 20 to 24 Year Olds | 0 (0.0%) | 0 (0.0%) |
| 25 to 34 Year Olds | 17 (100.0%) | 0 (0.0%) |
| 35 Years and over | 0 (0.0%) | 0 (0.0%) |
| Total | 38 (86.4%) | 6 (13.6%) |
Educational Attainment by Field of Study in Sauget
Computers & mathematics (2 | 33.3%), social sciences (2 | 33.3%), and communications (2 | 33.3%) are the most common fields of study among 6 individuals in Sauget who have obtained a bachelor's degree or higher.
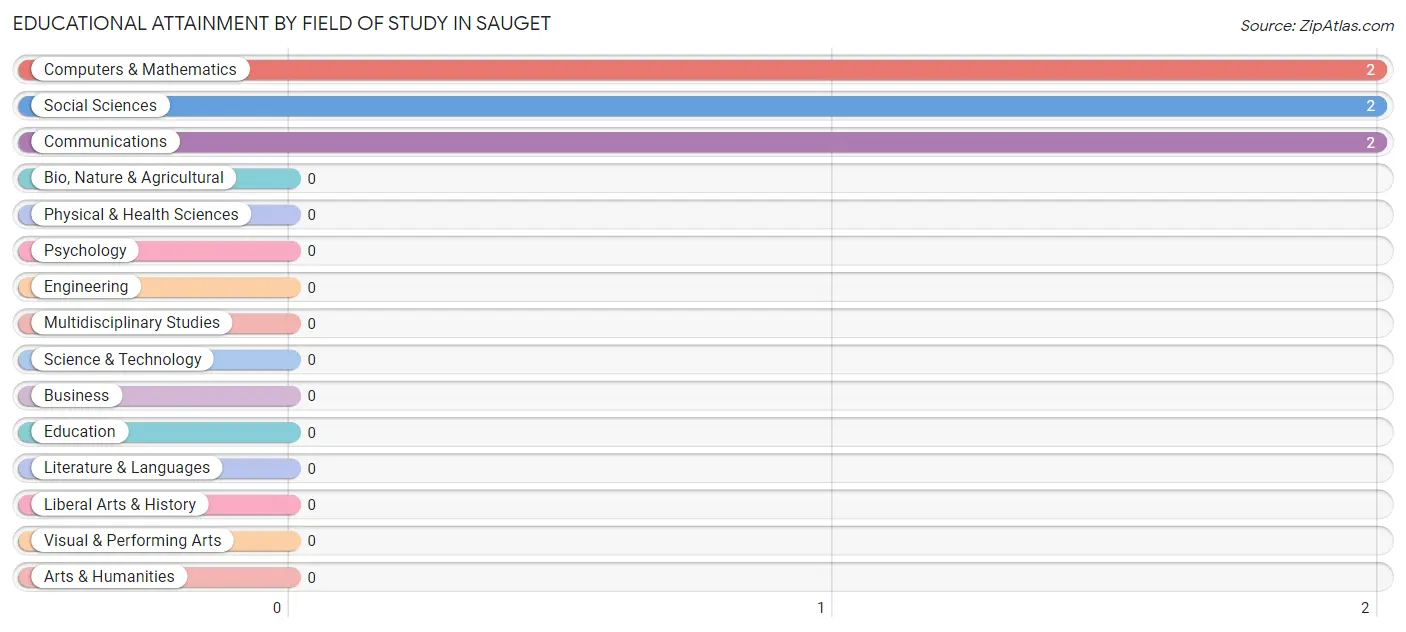
| Field of Study | # Graduates | % Graduates |
| Computers & Mathematics | 2 | 33.3% |
| Bio, Nature & Agricultural | 0 | 0.0% |
| Physical & Health Sciences | 0 | 0.0% |
| Psychology | 0 | 0.0% |
| Social Sciences | 2 | 33.3% |
| Engineering | 0 | 0.0% |
| Multidisciplinary Studies | 0 | 0.0% |
| Science & Technology | 0 | 0.0% |
| Business | 0 | 0.0% |
| Education | 0 | 0.0% |
| Literature & Languages | 0 | 0.0% |
| Liberal Arts & History | 0 | 0.0% |
| Visual & Performing Arts | 0 | 0.0% |
| Communications | 2 | 33.3% |
| Arts & Humanities | 0 | 0.0% |
| Total | 6 | 100.0% |
Transportation & Commute in Sauget
Vehicle Availability by Sex in Sauget
The most prevalent vehicle ownership categories in Sauget are males with 1 vehicle (18, accounting for 45.0%) and females with 1 vehicle (8, making up 58.1%).
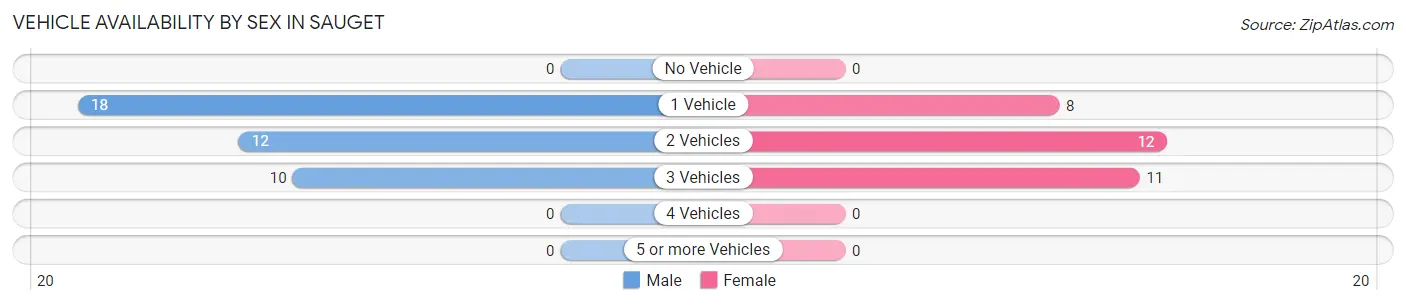
| Vehicles Available | Male | Female |
| No Vehicle | 0 (0.0%) | 0 (0.0%) |
| 1 Vehicle | 18 (45.0%) | 8 (25.8%) |
| 2 Vehicles | 12 (30.0%) | 12 (38.7%) |
| 3 Vehicles | 10 (25.0%) | 11 (35.5%) |
| 4 Vehicles | 0 (0.0%) | 0 (0.0%) |
| 5 or more Vehicles | 0 (0.0%) | 0 (0.0%) |
| Total | 40 (100.0%) | 31 (100.0%) |
Commute Time in Sauget
The most frequently occuring commute durations in Sauget are 5 to 9 minutes (29 commuters, 40.8%), less than 5 minutes (13 commuters, 18.3%), and 30 to 34 minutes (12 commuters, 16.9%).
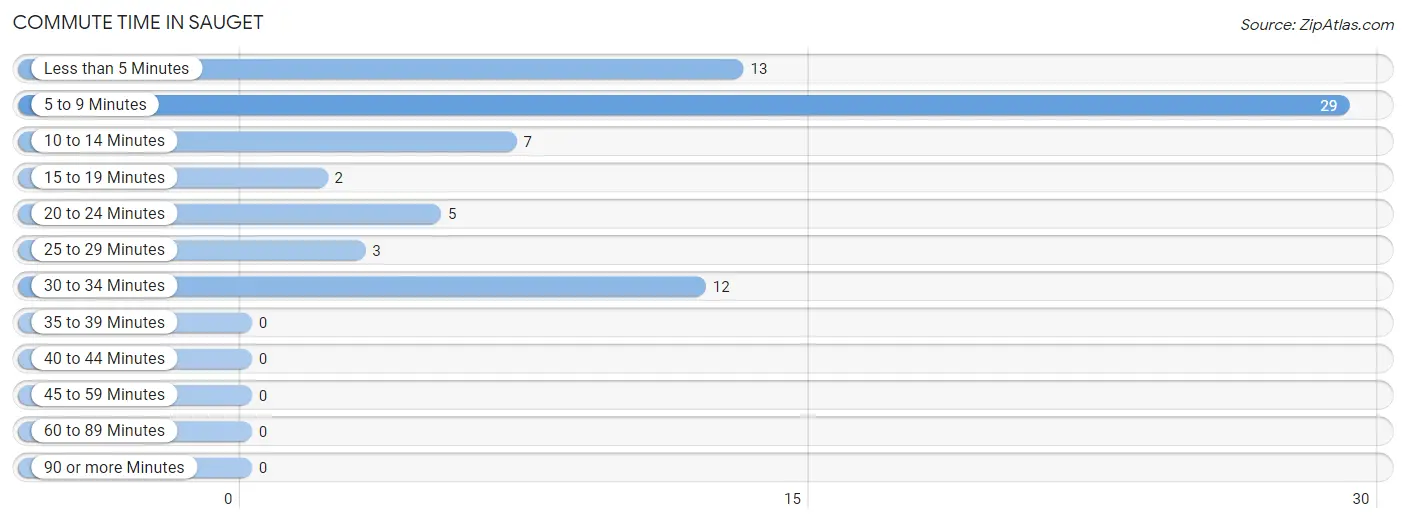
| Commute Time | # Commuters | % Commuters |
| Less than 5 Minutes | 13 | 18.3% |
| 5 to 9 Minutes | 29 | 40.8% |
| 10 to 14 Minutes | 7 | 9.9% |
| 15 to 19 Minutes | 2 | 2.8% |
| 20 to 24 Minutes | 5 | 7.0% |
| 25 to 29 Minutes | 3 | 4.2% |
| 30 to 34 Minutes | 12 | 16.9% |
| 35 to 39 Minutes | 0 | 0.0% |
| 40 to 44 Minutes | 0 | 0.0% |
| 45 to 59 Minutes | 0 | 0.0% |
| 60 to 89 Minutes | 0 | 0.0% |
| 90 or more Minutes | 0 | 0.0% |
Commute Time by Sex in Sauget
The most common commute times in Sauget are 5 to 9 minutes (27 commuters, 67.5%) for males and less than 5 minutes (10 commuters, 32.3%) for females.
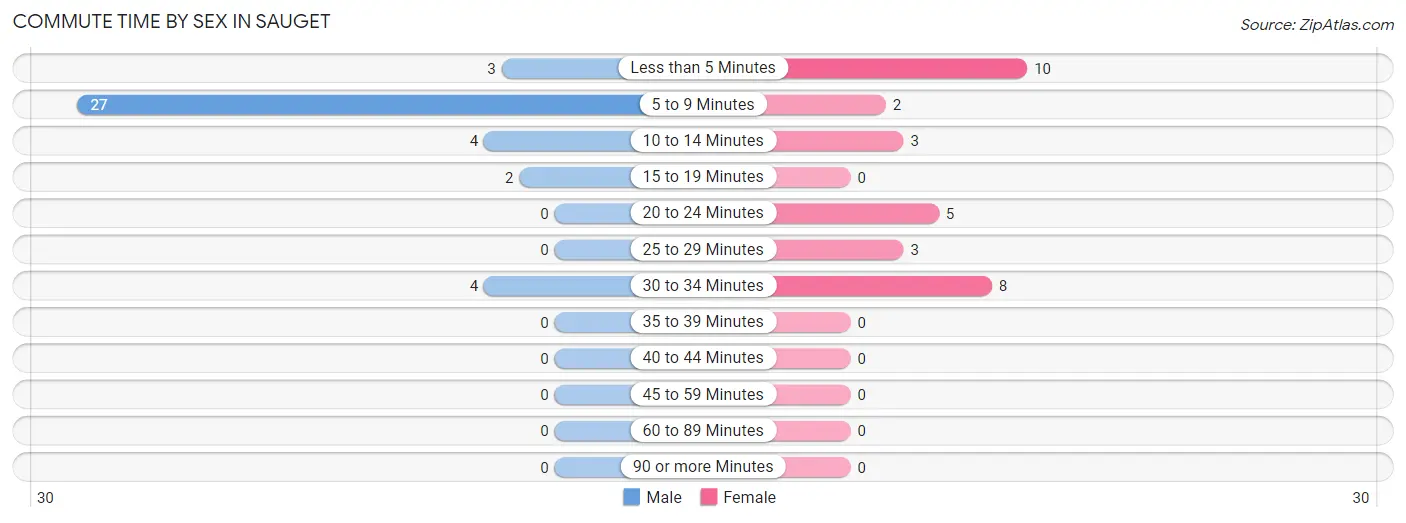
| Commute Time | Male | Female |
| Less than 5 Minutes | 3 (7.5%) | 10 (32.3%) |
| 5 to 9 Minutes | 27 (67.5%) | 2 (6.5%) |
| 10 to 14 Minutes | 4 (10.0%) | 3 (9.7%) |
| 15 to 19 Minutes | 2 (5.0%) | 0 (0.0%) |
| 20 to 24 Minutes | 0 (0.0%) | 5 (16.1%) |
| 25 to 29 Minutes | 0 (0.0%) | 3 (9.7%) |
| 30 to 34 Minutes | 4 (10.0%) | 8 (25.8%) |
| 35 to 39 Minutes | 0 (0.0%) | 0 (0.0%) |
| 40 to 44 Minutes | 0 (0.0%) | 0 (0.0%) |
| 45 to 59 Minutes | 0 (0.0%) | 0 (0.0%) |
| 60 to 89 Minutes | 0 (0.0%) | 0 (0.0%) |
| 90 or more Minutes | 0 (0.0%) | 0 (0.0%) |
Time of Departure to Work by Sex in Sauget
The most frequent times of departure to work in Sauget are 7:00 AM to 7:29 AM (13, 32.5%) for males and 7:30 AM to 7:59 AM (13, 41.9%) for females.
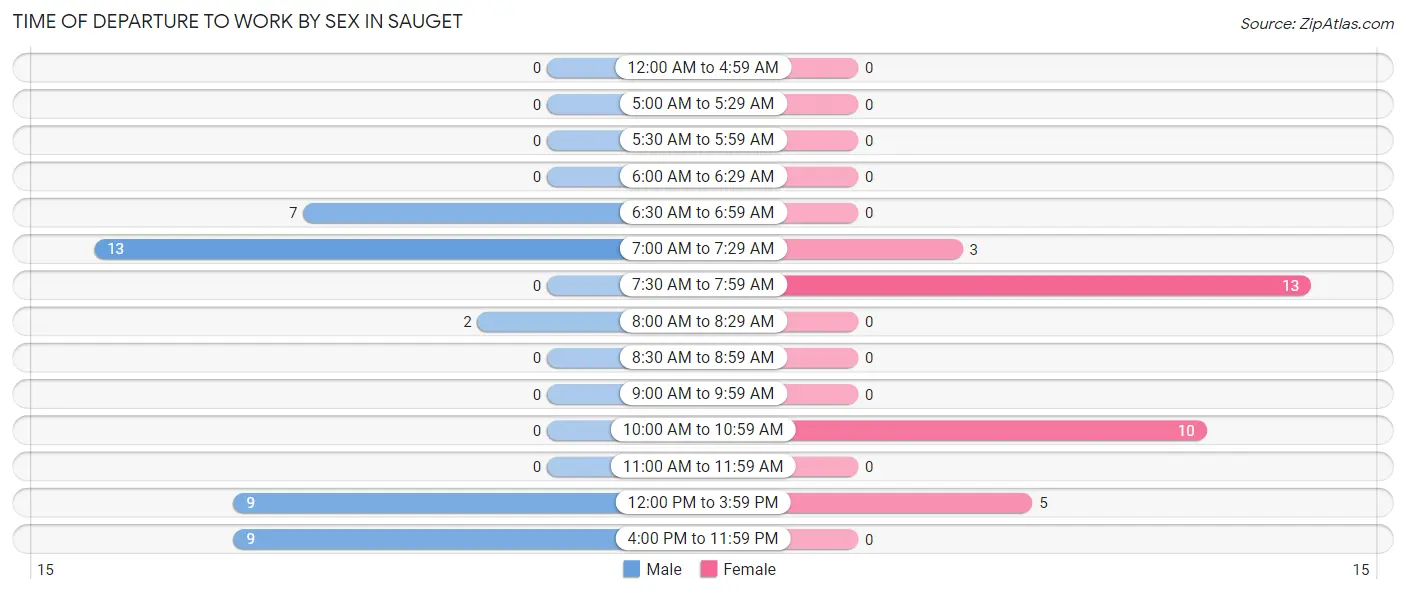
| Time of Departure | Male | Female |
| 12:00 AM to 4:59 AM | 0 (0.0%) | 0 (0.0%) |
| 5:00 AM to 5:29 AM | 0 (0.0%) | 0 (0.0%) |
| 5:30 AM to 5:59 AM | 0 (0.0%) | 0 (0.0%) |
| 6:00 AM to 6:29 AM | 0 (0.0%) | 0 (0.0%) |
| 6:30 AM to 6:59 AM | 7 (17.5%) | 0 (0.0%) |
| 7:00 AM to 7:29 AM | 13 (32.5%) | 3 (9.7%) |
| 7:30 AM to 7:59 AM | 0 (0.0%) | 13 (41.9%) |
| 8:00 AM to 8:29 AM | 2 (5.0%) | 0 (0.0%) |
| 8:30 AM to 8:59 AM | 0 (0.0%) | 0 (0.0%) |
| 9:00 AM to 9:59 AM | 0 (0.0%) | 0 (0.0%) |
| 10:00 AM to 10:59 AM | 0 (0.0%) | 10 (32.3%) |
| 11:00 AM to 11:59 AM | 0 (0.0%) | 0 (0.0%) |
| 12:00 PM to 3:59 PM | 9 (22.5%) | 5 (16.1%) |
| 4:00 PM to 11:59 PM | 9 (22.5%) | 0 (0.0%) |
| Total | 40 (100.0%) | 31 (100.0%) |
Housing Occupancy in Sauget
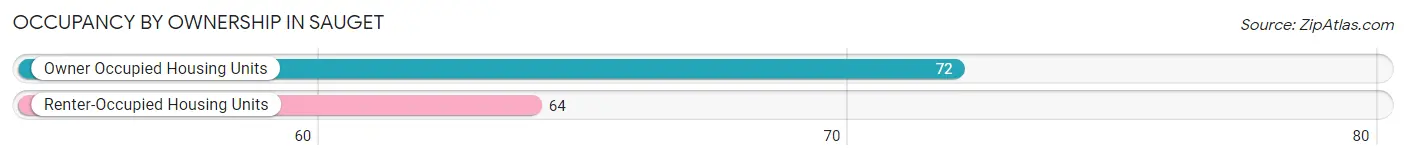
Occupancy by Ownership in Sauget
Of the total 136 dwellings in Sauget, owner-occupied units account for 72 (52.9%), while renter-occupied units make up 64 (47.1%).
| Occupancy | # Housing Units | % Housing Units |
| Owner Occupied Housing Units | 72 | 52.9% |
| Renter-Occupied Housing Units | 64 | 47.1% |
| Total Occupied Housing Units | 136 | 100.0% |
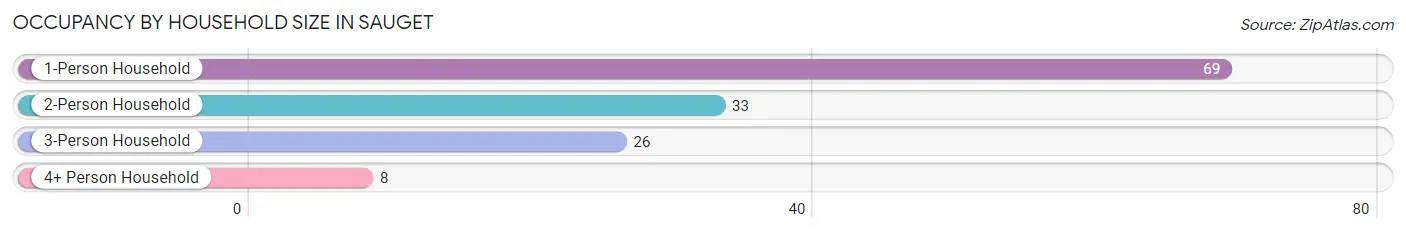
Occupancy by Household Size in Sauget
| Household Size | # Housing Units | % Housing Units |
| 1-Person Household | 69 | 50.7% |
| 2-Person Household | 33 | 24.3% |
| 3-Person Household | 26 | 19.1% |
| 4+ Person Household | 8 | 5.9% |
| Total Housing Units | 136 | 100.0% |
Occupancy by Ownership by Household Size in Sauget
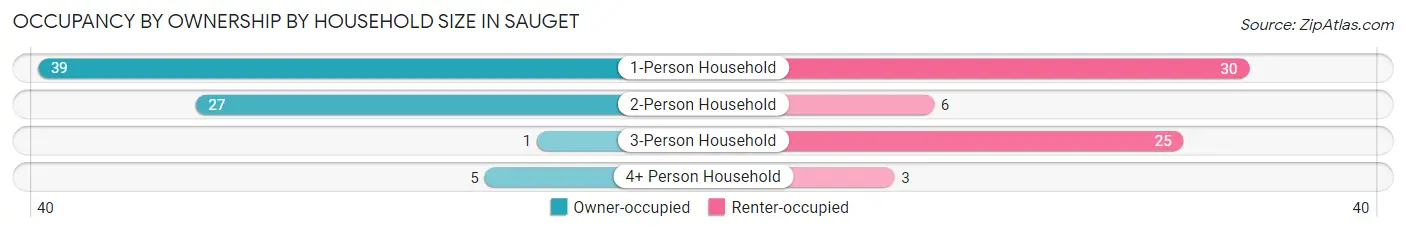
| Household Size | Owner-occupied | Renter-occupied |
| 1-Person Household | 39 (56.5%) | 30 (43.5%) |
| 2-Person Household | 27 (81.8%) | 6 (18.2%) |
| 3-Person Household | 1 (3.8%) | 25 (96.2%) |
| 4+ Person Household | 5 (62.5%) | 3 (37.5%) |
| Total Housing Units | 72 (52.9%) | 64 (47.1%) |
Occupancy by Educational Attainment in Sauget
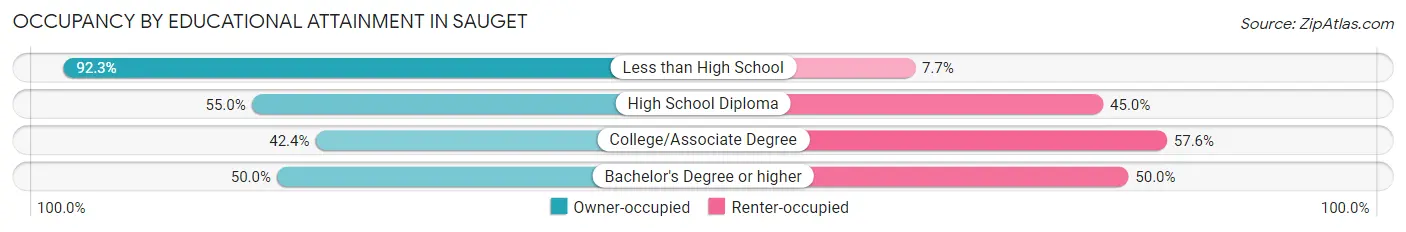
| Household Size | Owner-occupied | Renter-occupied |
| Less than High School | 12 (92.3%) | 1 (7.7%) |
| High School Diploma | 33 (55.0%) | 27 (45.0%) |
| College/Associate Degree | 25 (42.4%) | 34 (57.6%) |
| Bachelor's Degree or higher | 2 (50.0%) | 2 (50.0%) |
Occupancy by Age of Householder in Sauget
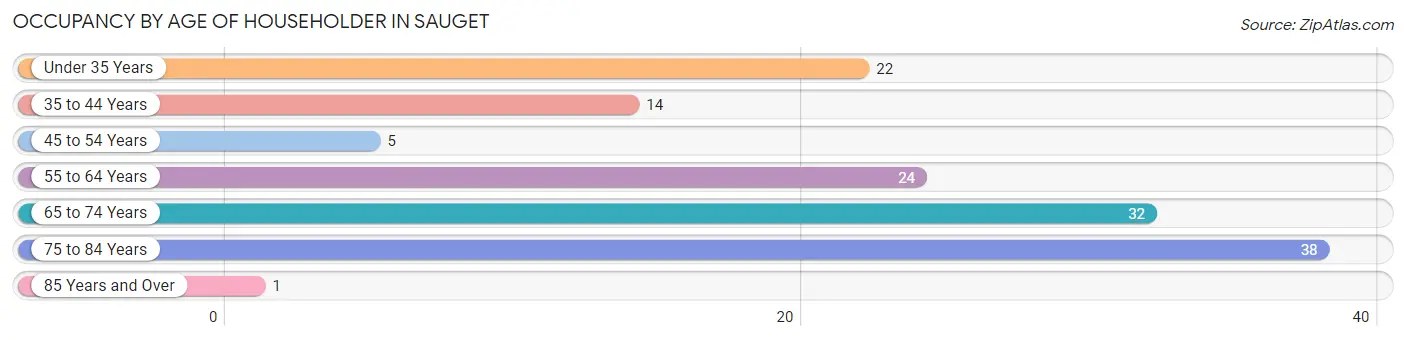
| Age Bracket | # Households | % Households |
| Under 35 Years | 22 | 16.2% |
| 35 to 44 Years | 14 | 10.3% |
| 45 to 54 Years | 5 | 3.7% |
| 55 to 64 Years | 24 | 17.6% |
| 65 to 74 Years | 32 | 23.5% |
| 75 to 84 Years | 38 | 27.9% |
| 85 Years and Over | 1 | 0.7% |
| Total | 136 | 100.0% |
Housing Finances in Sauget
Median Income by Occupancy in Sauget
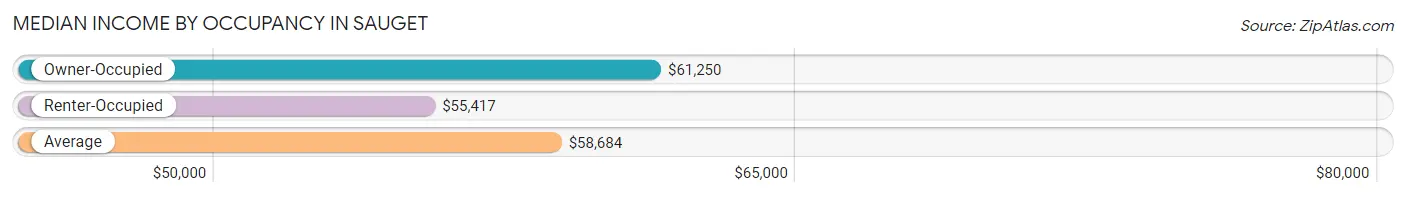
| Occupancy Type | # Households | Median Income |
| Owner-Occupied | 72 (52.9%) | $61,250 |
| Renter-Occupied | 64 (47.1%) | $55,417 |
| Average | 136 (100.0%) | $58,684 |
Occupancy by Householder Income Bracket in Sauget
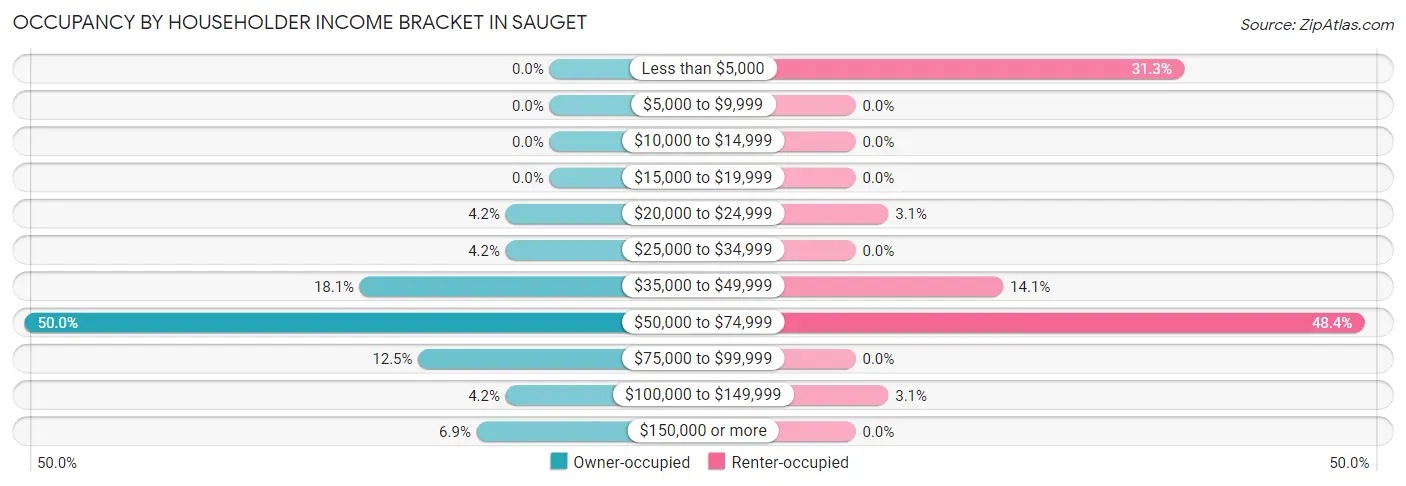
| Income Bracket | Owner-occupied | Renter-occupied |
| Less than $5,000 | 0 (0.0%) | 20 (31.2%) |
| $5,000 to $9,999 | 0 (0.0%) | 0 (0.0%) |
| $10,000 to $14,999 | 0 (0.0%) | 0 (0.0%) |
| $15,000 to $19,999 | 0 (0.0%) | 0 (0.0%) |
| $20,000 to $24,999 | 3 (4.2%) | 2 (3.1%) |
| $25,000 to $34,999 | 3 (4.2%) | 0 (0.0%) |
| $35,000 to $49,999 | 13 (18.1%) | 9 (14.1%) |
| $50,000 to $74,999 | 36 (50.0%) | 31 (48.4%) |
| $75,000 to $99,999 | 9 (12.5%) | 0 (0.0%) |
| $100,000 to $149,999 | 3 (4.2%) | 2 (3.1%) |
| $150,000 or more | 5 (6.9%) | 0 (0.0%) |
| Total | 72 (100.0%) | 64 (100.0%) |
Monthly Housing Cost Tiers in Sauget
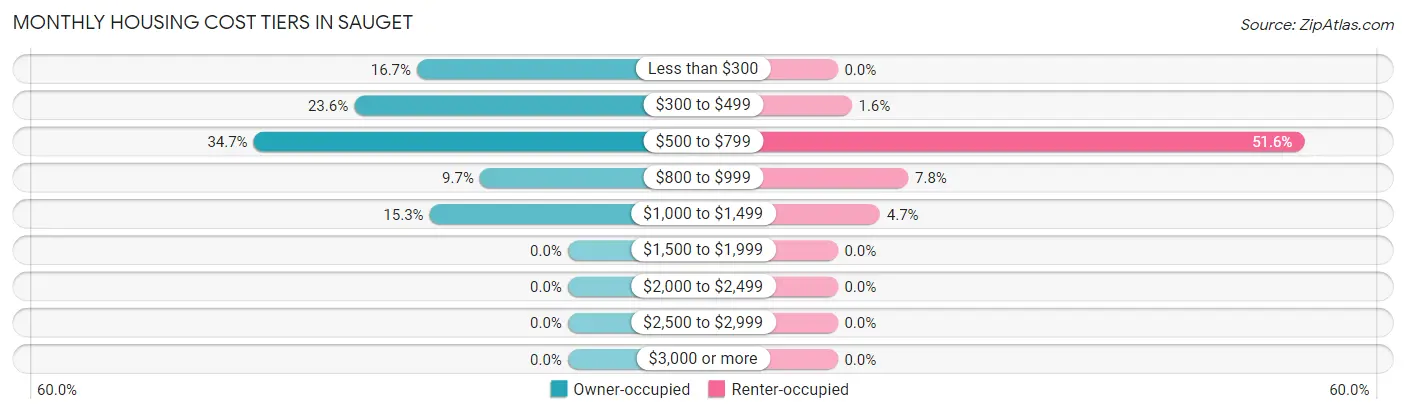
| Monthly Cost | Owner-occupied | Renter-occupied |
| Less than $300 | 12 (16.7%) | 0 (0.0%) |
| $300 to $499 | 17 (23.6%) | 1 (1.6%) |
| $500 to $799 | 25 (34.7%) | 33 (51.6%) |
| $800 to $999 | 7 (9.7%) | 5 (7.8%) |
| $1,000 to $1,499 | 11 (15.3%) | 3 (4.7%) |
| $1,500 to $1,999 | 0 (0.0%) | 0 (0.0%) |
| $2,000 to $2,499 | 0 (0.0%) | 0 (0.0%) |
| $2,500 to $2,999 | 0 (0.0%) | 0 (0.0%) |
| $3,000 or more | 0 (0.0%) | 0 (0.0%) |
| Total | 72 (100.0%) | 64 (100.0%) |
Physical Housing Characteristics in Sauget
Housing Structures in Sauget
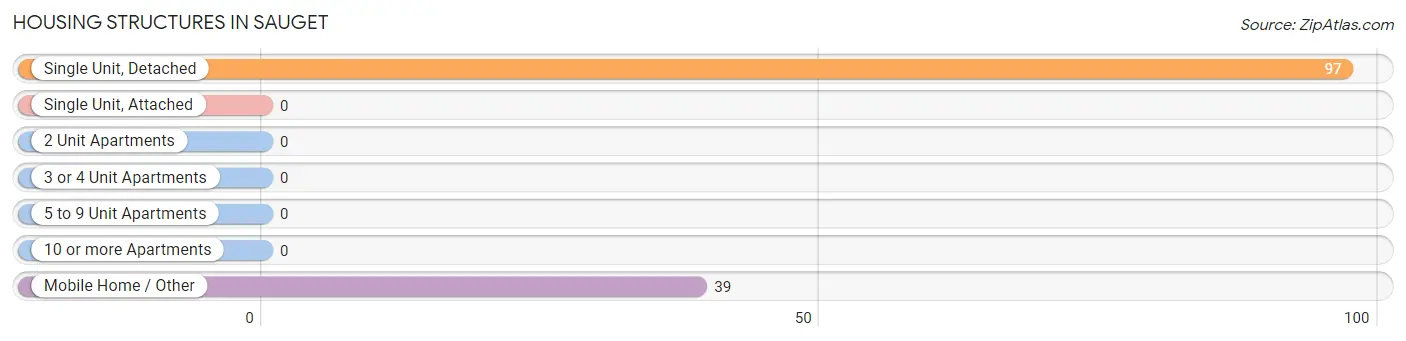
| Structure Type | # Housing Units | % Housing Units |
| Single Unit, Detached | 97 | 71.3% |
| Single Unit, Attached | 0 | 0.0% |
| 2 Unit Apartments | 0 | 0.0% |
| 3 or 4 Unit Apartments | 0 | 0.0% |
| 5 to 9 Unit Apartments | 0 | 0.0% |
| 10 or more Apartments | 0 | 0.0% |
| Mobile Home / Other | 39 | 28.7% |
| Total | 136 | 100.0% |
Housing Structures by Occupancy in Sauget
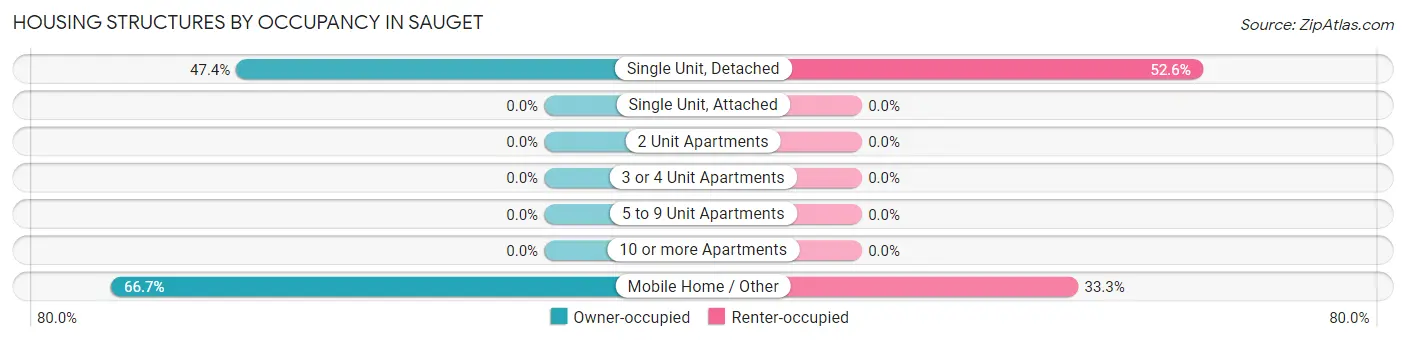
| Structure Type | Owner-occupied | Renter-occupied |
| Single Unit, Detached | 46 (47.4%) | 51 (52.6%) |
| Single Unit, Attached | 0 (0.0%) | 0 (0.0%) |
| 2 Unit Apartments | 0 (0.0%) | 0 (0.0%) |
| 3 or 4 Unit Apartments | 0 (0.0%) | 0 (0.0%) |
| 5 to 9 Unit Apartments | 0 (0.0%) | 0 (0.0%) |
| 10 or more Apartments | 0 (0.0%) | 0 (0.0%) |
| Mobile Home / Other | 26 (66.7%) | 13 (33.3%) |
| Total | 72 (52.9%) | 64 (47.1%) |
Housing Structures by Number of Rooms in Sauget
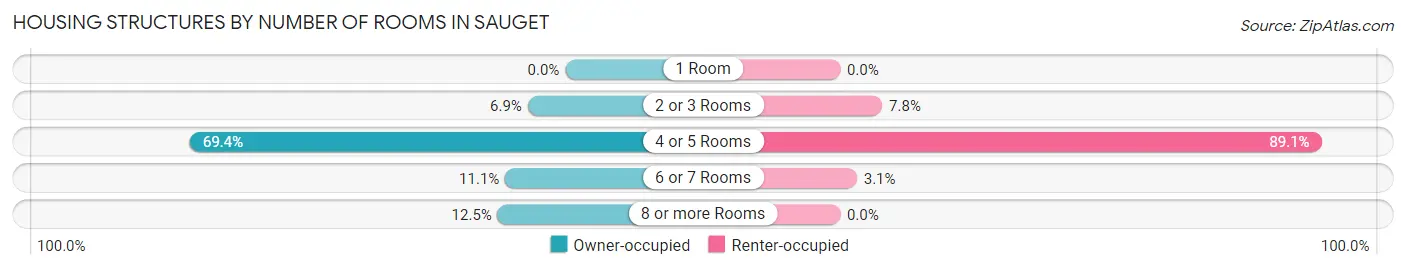
| Number of Rooms | Owner-occupied | Renter-occupied |
| 1 Room | 0 (0.0%) | 0 (0.0%) |
| 2 or 3 Rooms | 5 (6.9%) | 5 (7.8%) |
| 4 or 5 Rooms | 50 (69.4%) | 57 (89.1%) |
| 6 or 7 Rooms | 8 (11.1%) | 2 (3.1%) |
| 8 or more Rooms | 9 (12.5%) | 0 (0.0%) |
| Total | 72 (100.0%) | 64 (100.0%) |
Housing Structure by Heating Type in Sauget
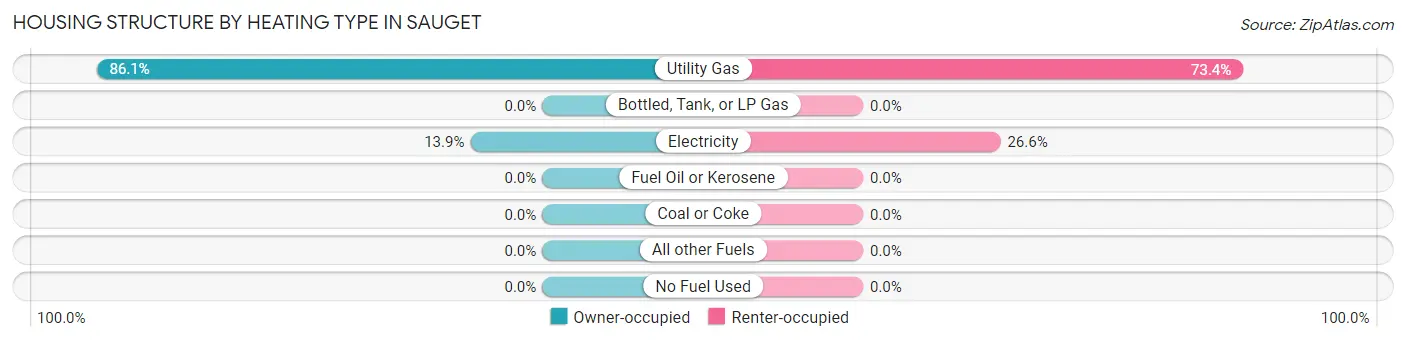
| Heating Type | Owner-occupied | Renter-occupied |
| Utility Gas | 62 (86.1%) | 47 (73.4%) |
| Bottled, Tank, or LP Gas | 0 (0.0%) | 0 (0.0%) |
| Electricity | 10 (13.9%) | 17 (26.6%) |
| Fuel Oil or Kerosene | 0 (0.0%) | 0 (0.0%) |
| Coal or Coke | 0 (0.0%) | 0 (0.0%) |
| All other Fuels | 0 (0.0%) | 0 (0.0%) |
| No Fuel Used | 0 (0.0%) | 0 (0.0%) |
| Total | 72 (100.0%) | 64 (100.0%) |
Household Vehicle Usage in Sauget
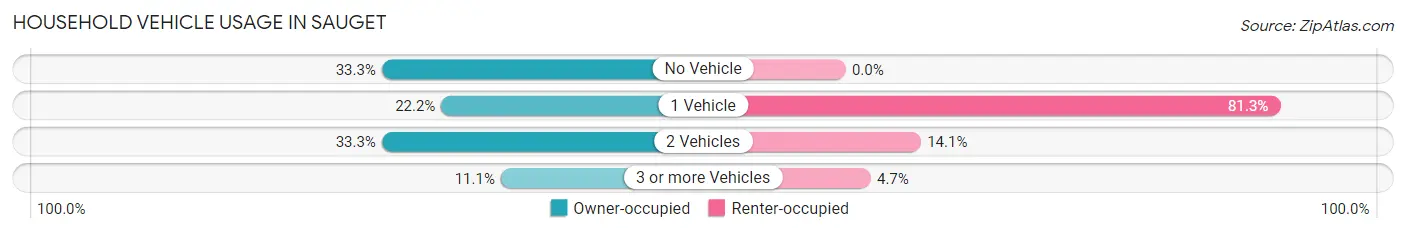
| Vehicles per Household | Owner-occupied | Renter-occupied |
| No Vehicle | 24 (33.3%) | 0 (0.0%) |
| 1 Vehicle | 16 (22.2%) | 52 (81.2%) |
| 2 Vehicles | 24 (33.3%) | 9 (14.1%) |
| 3 or more Vehicles | 8 (11.1%) | 3 (4.7%) |
| Total | 72 (100.0%) | 64 (100.0%) |
Real Estate & Mortgages in Sauget
Real Estate and Mortgage Overview in Sauget
| Characteristic | Without Mortgage | With Mortgage |
| Housing Units | 60 | 12 |
| Median Property Value | $51,700 | $70,000 |
| Median Household Income | $58,929 | $3 |
| Monthly Housing Costs | $507 | $0 |
| Real Estate Taxes | - | - |
Property Value by Mortgage Status in Sauget
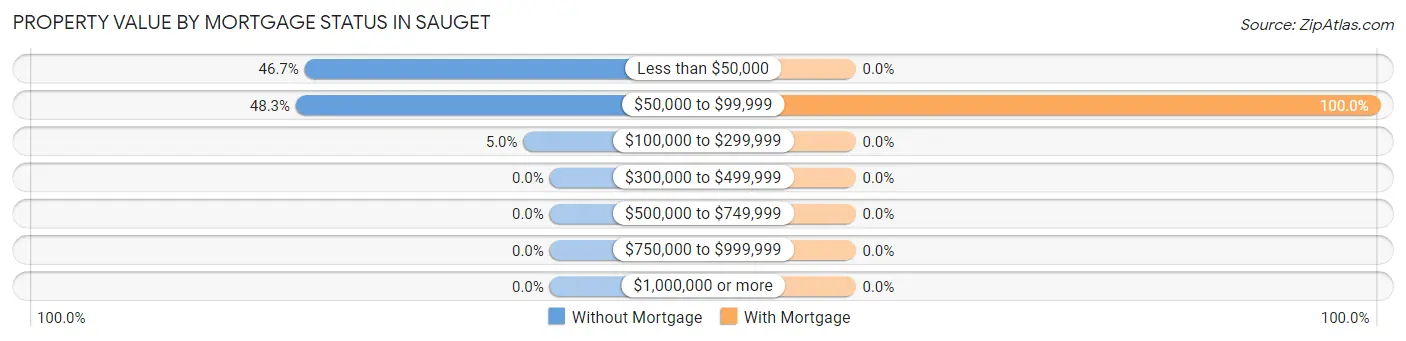
| Property Value | Without Mortgage | With Mortgage |
| Less than $50,000 | 28 (46.7%) | 0 (0.0%) |
| $50,000 to $99,999 | 29 (48.3%) | 12 (100.0%) |
| $100,000 to $299,999 | 3 (5.0%) | 0 (0.0%) |
| $300,000 to $499,999 | 0 (0.0%) | 0 (0.0%) |
| $500,000 to $749,999 | 0 (0.0%) | 0 (0.0%) |
| $750,000 to $999,999 | 0 (0.0%) | 0 (0.0%) |
| $1,000,000 or more | 0 (0.0%) | 0 (0.0%) |
| Total | 60 (100.0%) | 12 (100.0%) |
Household Income by Mortgage Status in Sauget
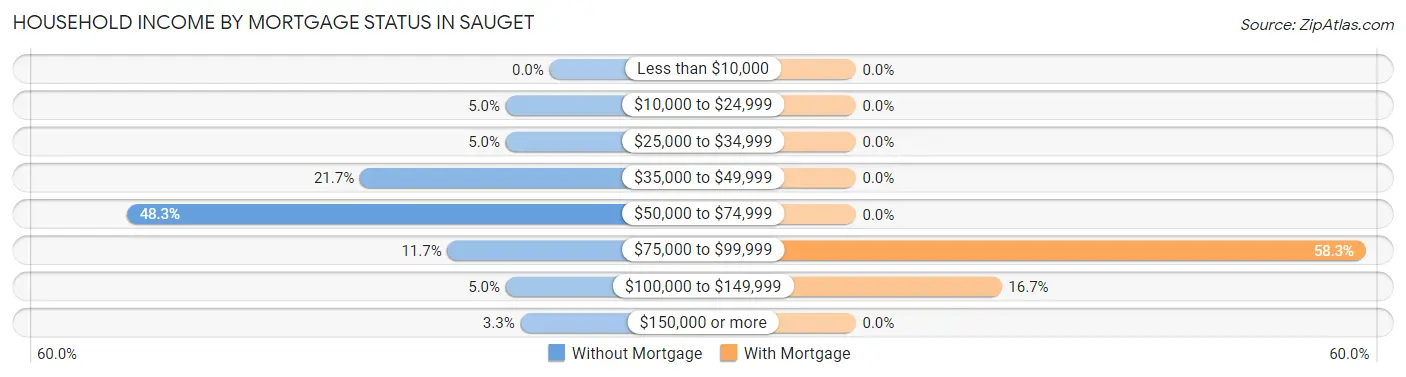
| Household Income | Without Mortgage | With Mortgage |
| Less than $10,000 | 0 (0.0%) | 0 (0.0%) |
| $10,000 to $24,999 | 3 (5.0%) | 0 (0.0%) |
| $25,000 to $34,999 | 3 (5.0%) | 0 (0.0%) |
| $35,000 to $49,999 | 13 (21.7%) | 0 (0.0%) |
| $50,000 to $74,999 | 29 (48.3%) | 0 (0.0%) |
| $75,000 to $99,999 | 7 (11.7%) | 7 (58.3%) |
| $100,000 to $149,999 | 3 (5.0%) | 2 (16.7%) |
| $150,000 or more | 2 (3.3%) | 0 (0.0%) |
| Total | 60 (100.0%) | 12 (100.0%) |
Property Value to Household Income Ratio in Sauget
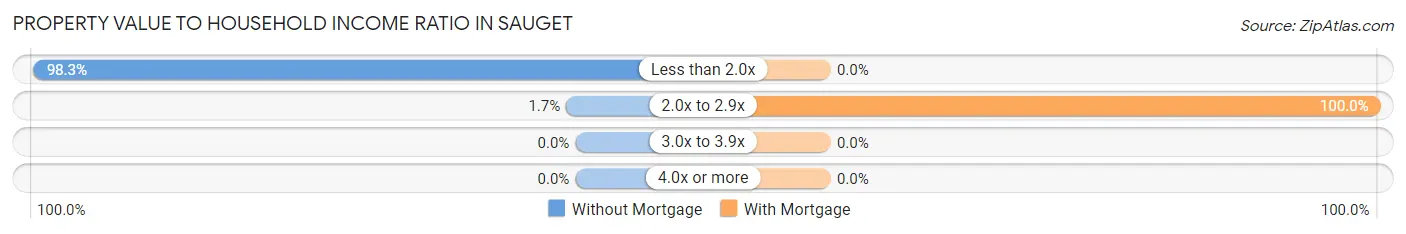
| Value-to-Income Ratio | Without Mortgage | With Mortgage |
| Less than 2.0x | 59 (98.3%) | 0 (0.0%) |
| 2.0x to 2.9x | 1 (1.7%) | 12 (100.0%) |
| 3.0x to 3.9x | 0 (0.0%) | 0 (0.0%) |
| 4.0x or more | 0 (0.0%) | 0 (0.0%) |
| Total | 60 (100.0%) | 12 (100.0%) |
Real Estate Taxes by Mortgage Status in Sauget
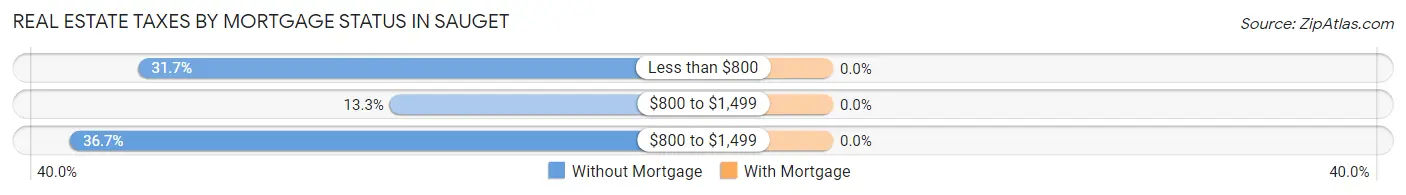
| Property Taxes | Without Mortgage | With Mortgage |
| Less than $800 | 19 (31.7%) | 0 (0.0%) |
| $800 to $1,499 | 8 (13.3%) | 0 (0.0%) |
| $800 to $1,499 | 22 (36.7%) | 0 (0.0%) |
| Total | 60 (100.0%) | 12 (100.0%) |
Health & Disability in Sauget
Health Insurance Coverage by Age in Sauget
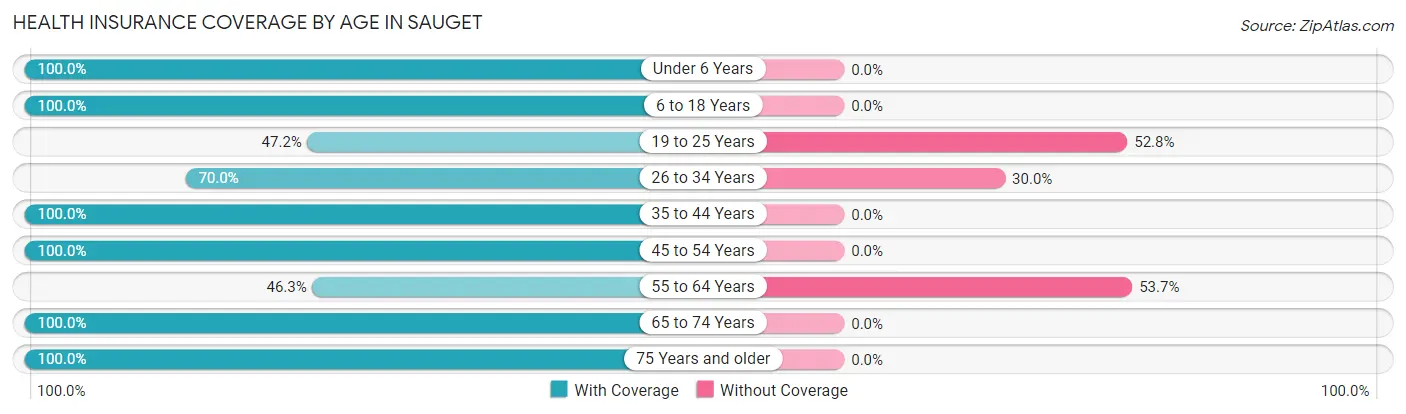
| Age Bracket | With Coverage | Without Coverage |
| Under 6 Years | 9 (100.0%) | 0 (0.0%) |
| 6 to 18 Years | 21 (100.0%) | 0 (0.0%) |
| 19 to 25 Years | 17 (47.2%) | 19 (52.8%) |
| 26 to 34 Years | 21 (70.0%) | 9 (30.0%) |
| 35 to 44 Years | 20 (100.0%) | 0 (0.0%) |
| 45 to 54 Years | 9 (100.0%) | 0 (0.0%) |
| 55 to 64 Years | 25 (46.3%) | 29 (53.7%) |
| 65 to 74 Years | 49 (100.0%) | 0 (0.0%) |
| 75 Years and older | 42 (100.0%) | 0 (0.0%) |
| Total | 213 (78.9%) | 57 (21.1%) |
Health Insurance Coverage by Citizenship Status in Sauget
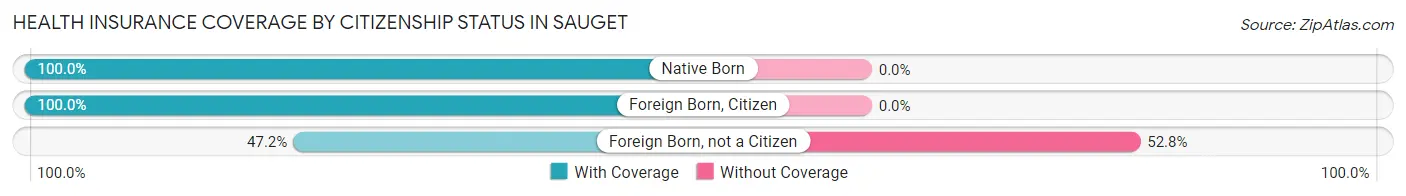
| Citizenship Status | With Coverage | Without Coverage |
| Native Born | 9 (100.0%) | 0 (0.0%) |
| Foreign Born, Citizen | 21 (100.0%) | 0 (0.0%) |
| Foreign Born, not a Citizen | 17 (47.2%) | 19 (52.8%) |
Health Insurance Coverage by Household Income in Sauget
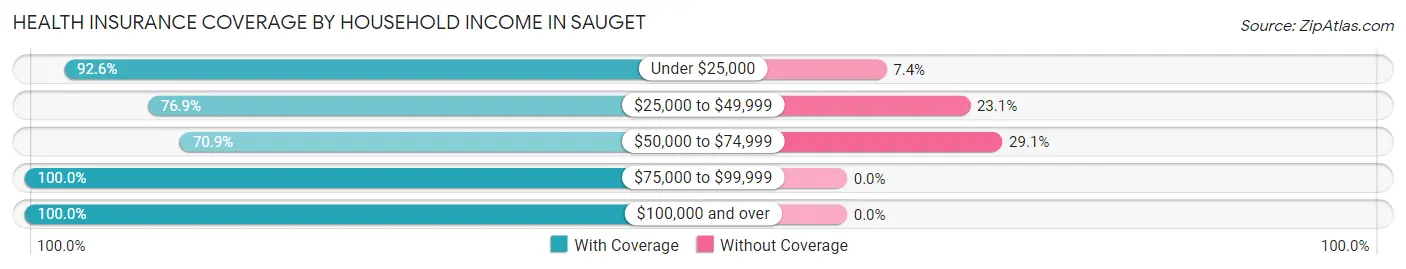
| Household Income | With Coverage | Without Coverage |
| Under $25,000 | 25 (92.6%) | 2 (7.4%) |
| $25,000 to $49,999 | 30 (76.9%) | 9 (23.1%) |
| $50,000 to $74,999 | 112 (70.9%) | 46 (29.1%) |
| $75,000 to $99,999 | 11 (100.0%) | 0 (0.0%) |
| $100,000 and over | 35 (100.0%) | 0 (0.0%) |
Public vs Private Health Insurance Coverage by Age in Sauget
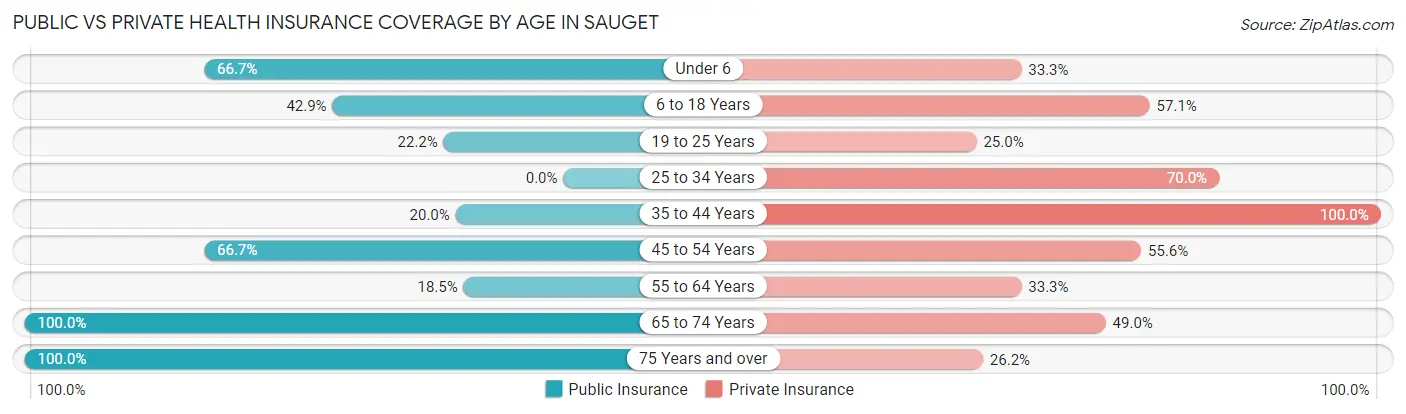
| Age Bracket | Public Insurance | Private Insurance |
| Under 6 | 6 (66.7%) | 3 (33.3%) |
| 6 to 18 Years | 9 (42.9%) | 12 (57.1%) |
| 19 to 25 Years | 8 (22.2%) | 9 (25.0%) |
| 25 to 34 Years | 0 (0.0%) | 21 (70.0%) |
| 35 to 44 Years | 4 (20.0%) | 20 (100.0%) |
| 45 to 54 Years | 6 (66.7%) | 5 (55.6%) |
| 55 to 64 Years | 10 (18.5%) | 18 (33.3%) |
| 65 to 74 Years | 49 (100.0%) | 24 (49.0%) |
| 75 Years and over | 42 (100.0%) | 11 (26.2%) |
| Total | 134 (49.6%) | 123 (45.6%) |
Disability Status by Sex by Age in Sauget
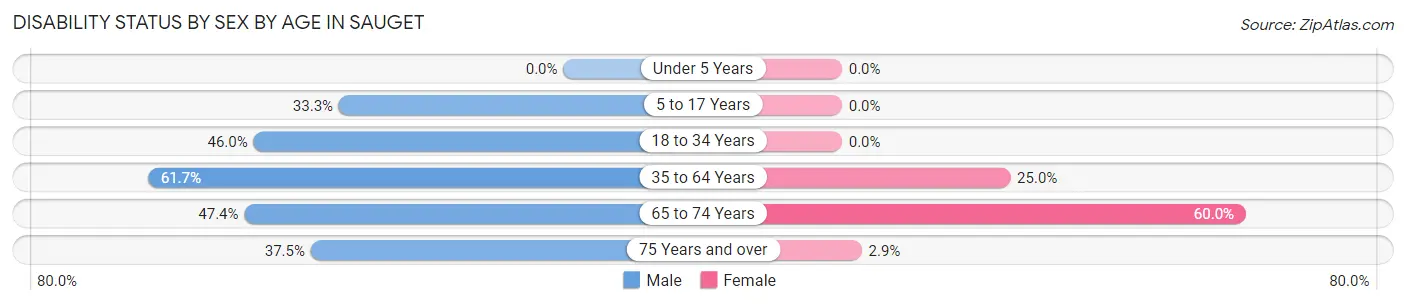
| Age Bracket | Male | Female |
| Under 5 Years | 0 (0.0%) | 0 (0.0%) |
| 5 to 17 Years | 3 (33.3%) | 0 (0.0%) |
| 18 to 34 Years | 23 (46.0%) | 0 (0.0%) |
| 35 to 64 Years | 29 (61.7%) | 9 (25.0%) |
| 65 to 74 Years | 9 (47.4%) | 18 (60.0%) |
| 75 Years and over | 3 (37.5%) | 1 (2.9%) |
Disability Class by Sex by Age in Sauget
Disability Class: Hearing Difficulty
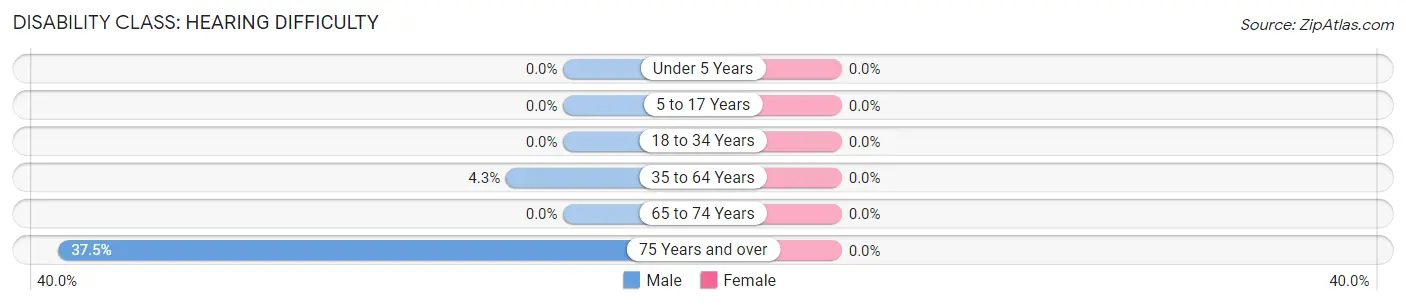
| Age Bracket | Male | Female |
| Under 5 Years | 0 (0.0%) | 0 (0.0%) |
| 5 to 17 Years | 0 (0.0%) | 0 (0.0%) |
| 18 to 34 Years | 0 (0.0%) | 0 (0.0%) |
| 35 to 64 Years | 2 (4.3%) | 0 (0.0%) |
| 65 to 74 Years | 0 (0.0%) | 0 (0.0%) |
| 75 Years and over | 3 (37.5%) | 0 (0.0%) |
Disability Class: Vision Difficulty
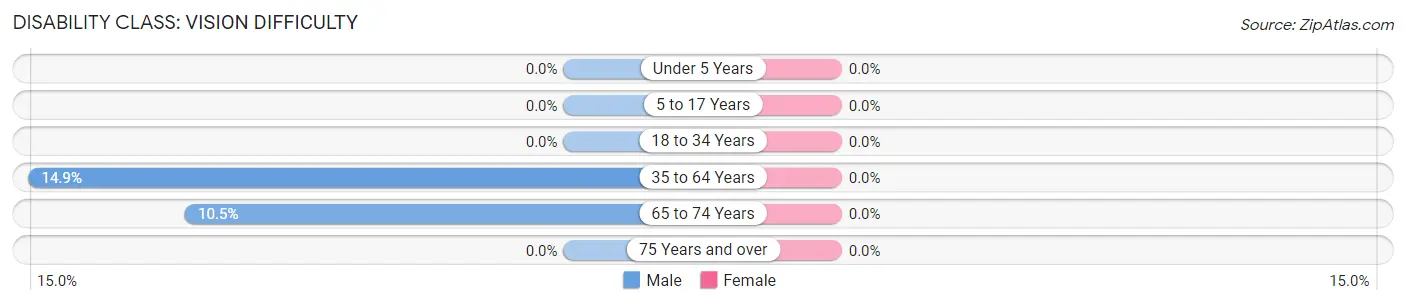
| Age Bracket | Male | Female |
| Under 5 Years | 0 (0.0%) | 0 (0.0%) |
| 5 to 17 Years | 0 (0.0%) | 0 (0.0%) |
| 18 to 34 Years | 0 (0.0%) | 0 (0.0%) |
| 35 to 64 Years | 7 (14.9%) | 0 (0.0%) |
| 65 to 74 Years | 2 (10.5%) | 0 (0.0%) |
| 75 Years and over | 0 (0.0%) | 0 (0.0%) |
Disability Class: Cognitive Difficulty
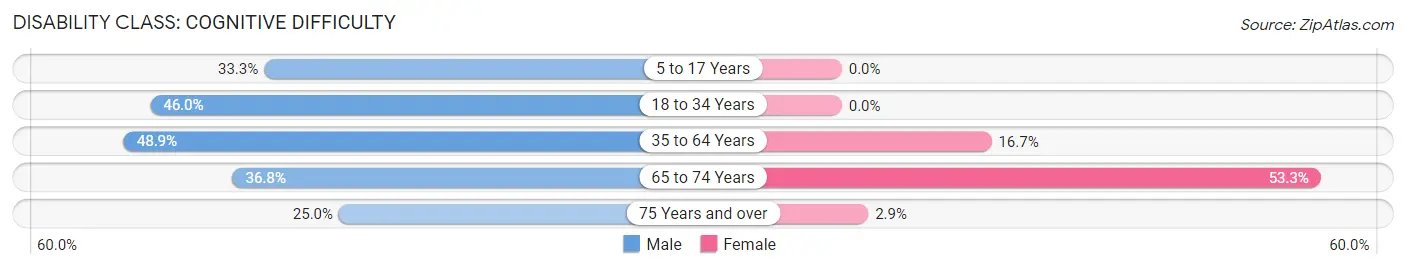
| Age Bracket | Male | Female |
| 5 to 17 Years | 3 (33.3%) | 0 (0.0%) |
| 18 to 34 Years | 23 (46.0%) | 0 (0.0%) |
| 35 to 64 Years | 23 (48.9%) | 6 (16.7%) |
| 65 to 74 Years | 7 (36.8%) | 16 (53.3%) |
| 75 Years and over | 2 (25.0%) | 1 (2.9%) |
Disability Class: Ambulatory Difficulty
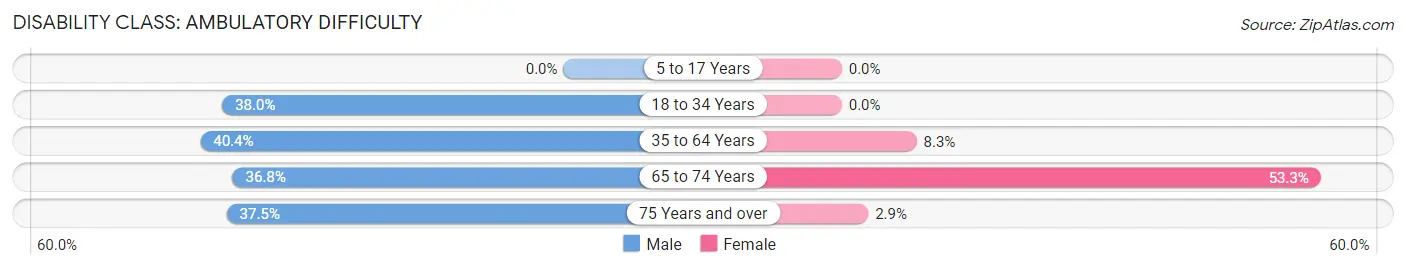
| Age Bracket | Male | Female |
| 5 to 17 Years | 0 (0.0%) | 0 (0.0%) |
| 18 to 34 Years | 19 (38.0%) | 0 (0.0%) |
| 35 to 64 Years | 19 (40.4%) | 3 (8.3%) |
| 65 to 74 Years | 7 (36.8%) | 16 (53.3%) |
| 75 Years and over | 3 (37.5%) | 1 (2.9%) |
Disability Class: Self-Care Difficulty
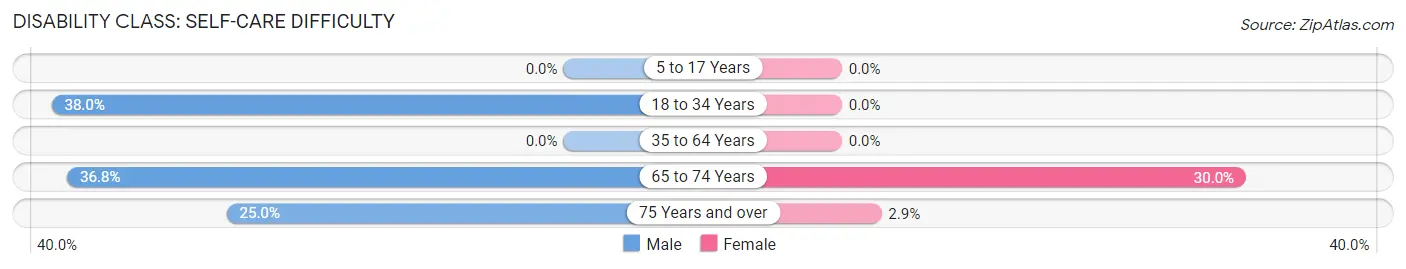
| Age Bracket | Male | Female |
| 5 to 17 Years | 0 (0.0%) | 0 (0.0%) |
| 18 to 34 Years | 19 (38.0%) | 0 (0.0%) |
| 35 to 64 Years | 0 (0.0%) | 0 (0.0%) |
| 65 to 74 Years | 7 (36.8%) | 9 (30.0%) |
| 75 Years and over | 2 (25.0%) | 1 (2.9%) |
Technology Access in Sauget
Computing Device Access in Sauget
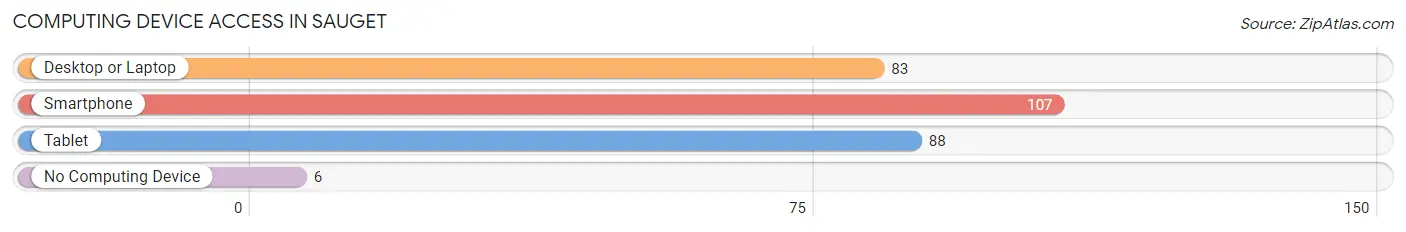
| Device Type | # Households | % Households |
| Desktop or Laptop | 83 | 61.0% |
| Smartphone | 107 | 78.7% |
| Tablet | 88 | 64.7% |
| No Computing Device | 6 | 4.4% |
| Total | 136 | 100.0% |
Internet Access in Sauget
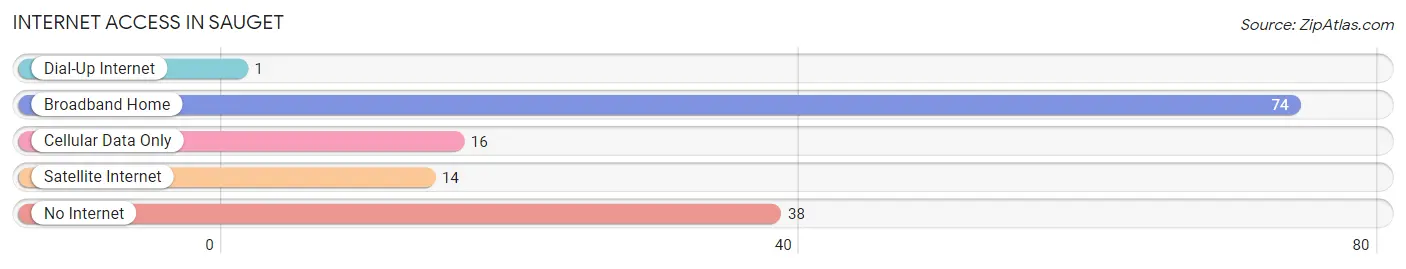
| Internet Type | # Households | % Households |
| Dial-Up Internet | 1 | 0.7% |
| Broadband Home | 74 | 54.4% |
| Cellular Data Only | 16 | 11.8% |
| Satellite Internet | 14 | 10.3% |
| No Internet | 38 | 27.9% |
| Total | 136 | 100.0% |
Sauget Summary
Sauget, Illinois is a small village located in St. Clair County, Illinois, United States. It is located just east of St. Louis, Missouri, and is part of the Greater St. Louis metropolitan area. The village was incorporated in 1950 and has a population of approximately 200 people.
Geography
Sauget is located at 38°37'17" North, 90°10'17" West (38.6214, -90.1714). It is situated on the Mississippi River, just east of St. Louis, Missouri. The village is bordered by the cities of East St. Louis and Centreville, and the unincorporated community of Brooklyn. The total area of Sauget is 0.2 square miles, all of which is land.
Climate
Sauget has a humid continental climate, with hot, humid summers and cold, dry winters. The average annual temperature is 54°F, with an average high of 79°F in July and an average low of 28°F in January. The average annual precipitation is 40.3 inches, with an average of 4.7 inches of snowfall per year.
Demographics
As of the 2010 census, there were 200 people living in Sauget. The racial makeup of the village was 95.5% White, 1.5% African American, 0.5% Native American, 0.5% Asian, and 2.0% from two or more races. Hispanic or Latino of any race were 0.5% of the population.
Economy
Sauget is home to several industrial and manufacturing businesses, including the Monsanto Company, which has a large plant in the village. Other businesses in the village include a trucking company, a metal fabrication shop, and a plastics manufacturer.
The village also has a small retail sector, with several convenience stores, a gas station, and a few restaurants.
History
Sauget was first settled in the early 1800s by French and German immigrants. The village was originally known as “Monsanto”, after the Monsanto Company, which was founded in the area in 1901. The village was officially incorporated in 1950.
In the late 20th century, Sauget became known as a center for the adult entertainment industry, with several strip clubs and other businesses operating in the village. In the early 2000s, the village passed several ordinances to regulate the industry, and the number of adult entertainment businesses has since declined.
Today, Sauget is a small, quiet village with a diverse economy and a rich history. The village is home to several businesses, and is a popular destination for visitors to the St. Louis area.
Common Questions
What is Per Capita Income in Sauget?
Per Capita income in Sauget is $42,474.
What is the Median Family Income in Sauget?
Median Family Income in Sauget is $59,643.
What is the Median Household income in Sauget?
Median Household Income in Sauget is $58,684.
What is Income or Wage Gap in Sauget?
Income or Wage Gap in Sauget is 33.9%.
Women in Sauget earn 66.1 cents for every dollar earned by a man.
What is Inequality or Gini Index in Sauget?
Inequality or Gini Index in Sauget is 0.53.
What is the Total Population of Sauget?
Total Population of Sauget is 270.
What is the Total Male Population of Sauget?
Total Male Population of Sauget is 136.
What is the Total Female Population of Sauget?
Total Female Population of Sauget is 134.
What is the Ratio of Males per 100 Females in Sauget?
There are 101.49 Males per 100 Females in Sauget.
What is the Ratio of Females per 100 Males in Sauget?
There are 98.53 Females per 100 Males in Sauget.
What is the Median Population Age in Sauget?
Median Population Age in Sauget is 55.7 Years.
What is the Average Family Size in Sauget
Average Family Size in Sauget is 2.7 People.
What is the Average Household Size in Sauget
Average Household Size in Sauget is 2.0 People.
How Large is the Labor Force in Sauget?
There are 97 People in the Labor Forcein in Sauget.
What is the Percentage of People in the Labor Force in Sauget?
40.4% of People are in the Labor Force in Sauget.
What is the Unemployment Rate in Sauget?
Unemployment Rate in Sauget is 26.8%.