Cities with the Highest Percentage of Immigrants from Latvia in Illinois
RELATED REPORTS & OPTIONS
Latvia
Illinois
Compare Cities
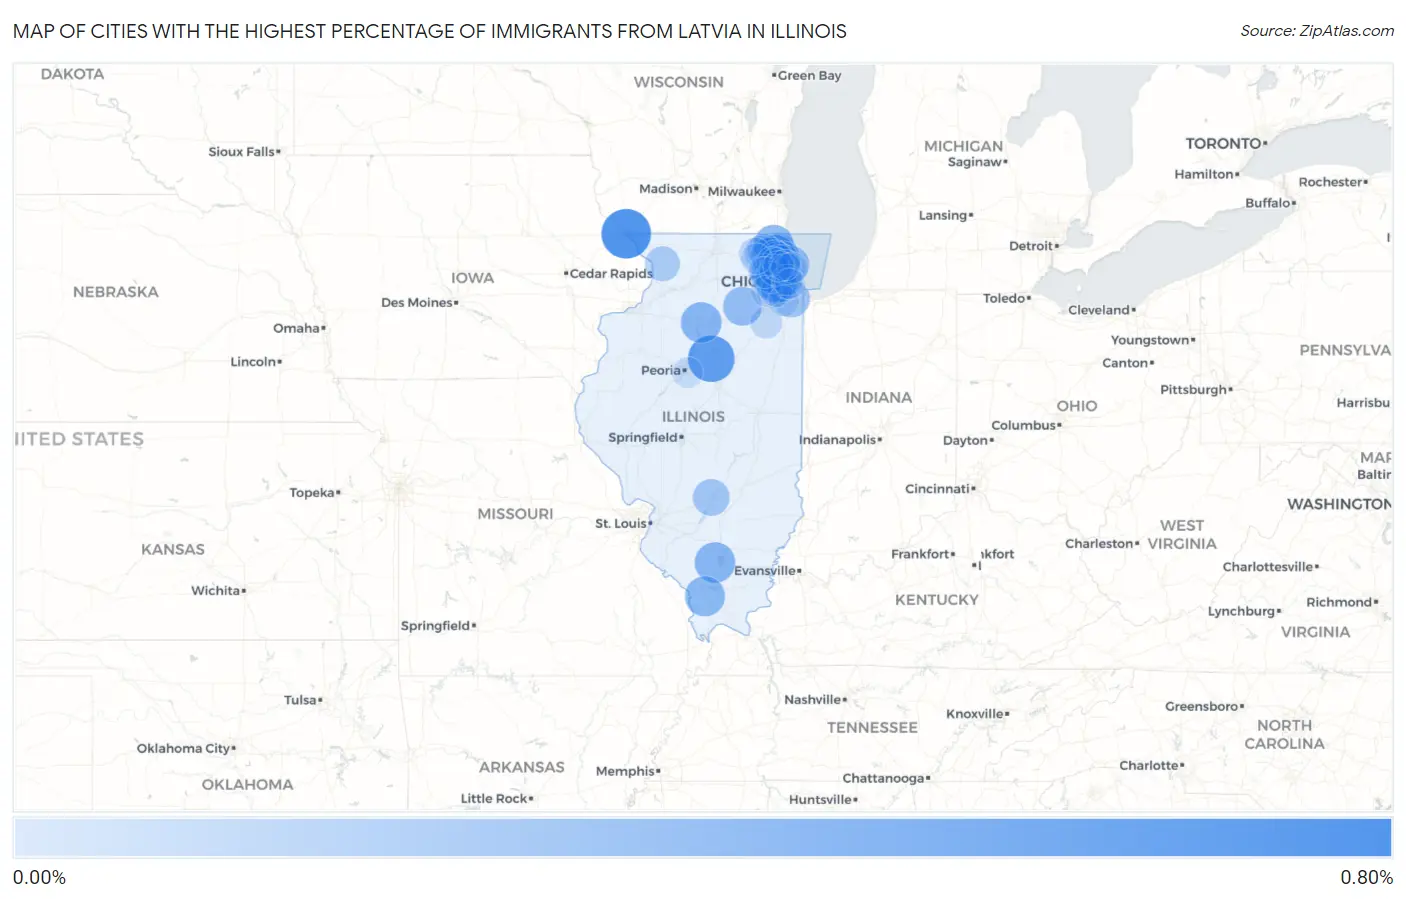
Map of Cities with the Highest Percentage of Immigrants from Latvia in Illinois
0.00%
0.80%
Cities with the Highest Percentage of Immigrants from Latvia in Illinois
| City | Latvia | vs State | vs National | |
| 1. | East Dubuque | 0.80% | 0.012%(+0.783)#1 | 0.0071%(+0.788)#20 |
| 2. | Benson | 0.67% | 0.012%(+0.660)#2 | 0.0071%(+0.666)#26 |
| 3. | Oakbrook Terrace | 0.45% | 0.012%(+0.433)#3 | 0.0071%(+0.438)#43 |
| 4. | De Pue | 0.43% | 0.012%(+0.415)#4 | 0.0071%(+0.420)#47 |
| 5. | Vernon Hills | 0.42% | 0.012%(+0.410)#5 | 0.0071%(+0.415)#48 |
| 6. | Sesser | 0.42% | 0.012%(+0.407)#6 | 0.0071%(+0.412)#49 |
| 7. | Grayslake | 0.41% | 0.012%(+0.396)#7 | 0.0071%(+0.402)#51 |
| 8. | Makanda | 0.40% | 0.012%(+0.388)#8 | 0.0071%(+0.393)#53 |
| 9. | Newark | 0.35% | 0.012%(+0.334)#9 | 0.0071%(+0.339)#68 |
| 10. | Wilmette | 0.35% | 0.012%(+0.333)#10 | 0.0071%(+0.338)#69 |
| 11. | Indian Creek | 0.30% | 0.012%(+0.289)#11 | 0.0071%(+0.294)#80 |
| 12. | Lake Zurich | 0.30% | 0.012%(+0.286)#12 | 0.0071%(+0.292)#83 |
| 13. | Robbins | 0.29% | 0.012%(+0.279)#13 | 0.0071%(+0.284)#88 |
| 14. | Oak Brook | 0.27% | 0.012%(+0.260)#14 | 0.0071%(+0.266)#94 |
| 15. | Vandalia | 0.26% | 0.012%(+0.252)#15 | 0.0071%(+0.257)#97 |
| 16. | Mount Carroll | 0.19% | 0.012%(+0.180)#16 | 0.0071%(+0.185)#140 |
| 17. | Deerfield | 0.18% | 0.012%(+0.165)#17 | 0.0071%(+0.170)#147 |
| 18. | Bloomingdale | 0.16% | 0.012%(+0.144)#18 | 0.0071%(+0.149)#162 |
| 19. | Wood Dale | 0.13% | 0.012%(+0.117)#19 | 0.0071%(+0.122)#186 |
| 20. | Oakwood Hills | 0.12% | 0.012%(+0.109)#20 | 0.0071%(+0.114)#195 |
| 21. | Buffalo Grove | 0.12% | 0.012%(+0.109)#21 | 0.0071%(+0.114)#196 |
| 22. | Elmhurst | 0.12% | 0.012%(+0.104)#22 | 0.0071%(+0.109)#201 |
| 23. | Island Lake | 0.100% | 0.012%(+0.087)#23 | 0.0071%(+0.092)#219 |
| 24. | Northbrook | 0.092% | 0.012%(+0.079)#24 | 0.0071%(+0.084)#233 |
| 25. | Wheeling | 0.088% | 0.012%(+0.075)#25 | 0.0071%(+0.080)#242 |
| 26. | Carol Stream | 0.083% | 0.012%(+0.071)#26 | 0.0071%(+0.076)#250 |
| 27. | Wilmington | 0.072% | 0.012%(+0.060)#27 | 0.0071%(+0.065)#268 |
| 28. | Crystal Lake | 0.072% | 0.012%(+0.059)#28 | 0.0071%(+0.065)#273 |
| 29. | Streamwood | 0.071% | 0.012%(+0.058)#29 | 0.0071%(+0.064)#276 |
| 30. | Wheaton | 0.063% | 0.012%(+0.051)#30 | 0.0071%(+0.056)#291 |
| 31. | Long Grove | 0.060% | 0.012%(+0.048)#31 | 0.0071%(+0.053)#300 |
| 32. | Palatine | 0.058% | 0.012%(+0.046)#32 | 0.0071%(+0.051)#307 |
| 33. | La Grange | 0.050% | 0.012%(+0.037)#33 | 0.0071%(+0.042)#336 |
| 34. | Arlington Heights | 0.046% | 0.012%(+0.033)#34 | 0.0071%(+0.038)#351 |
| 35. | Woodridge | 0.041% | 0.012%(+0.029)#35 | 0.0071%(+0.034)#360 |
| 36. | Hanover Park | 0.038% | 0.012%(+0.025)#36 | 0.0071%(+0.030)#377 |
| 37. | Skokie | 0.037% | 0.012%(+0.025)#37 | 0.0071%(+0.030)#380 |
| 38. | Glendale Heights | 0.036% | 0.012%(+0.024)#38 | 0.0071%(+0.029)#383 |
| 39. | Bartlett | 0.034% | 0.012%(+0.022)#39 | 0.0071%(+0.027)#394 |
| 40. | Darien | 0.032% | 0.012%(+0.020)#40 | 0.0071%(+0.025)#406 |
| 41. | Naperville | 0.032% | 0.012%(+0.019)#41 | 0.0071%(+0.024)#410 |
| 42. | East Peoria | 0.031% | 0.012%(+0.019)#42 | 0.0071%(+0.024)#414 |
| 43. | Elk Grove Village | 0.025% | 0.012%(+0.012)#43 | 0.0071%(+0.017)#445 |
| 44. | Morton Grove | 0.024% | 0.012%(+0.012)#44 | 0.0071%(+0.017)#449 |
| 45. | Algonquin | 0.017% | 0.012%(+0.004)#45 | 0.0071%(+0.010)#494 |
| 46. | Berwyn | 0.016% | 0.012%(+0.004)#46 | 0.0071%(+0.009)#503 |
| 47. | Orland Park | 0.015% | 0.012%(+0.003)#47 | 0.0071%(+0.008)#506 |
| 48. | Oak Park | 0.015% | 0.012%(+0.003)#48 | 0.0071%(+0.008)#510 |
| 49. | Evanston | 0.013% | 0.012%(+0.001)#49 | 0.0071%(+0.006)#538 |
| 50. | Chicago | 0.013% | 0.012%(+0.001)#50 | 0.0071%(+0.006)#539 |
| 51. | Glenview | 0.013% | 0.012%(+0.000)#51 | 0.0071%(+0.005)#547 |
| 52. | Mount Prospect | 0.0089% | 0.012%(-0.003)#52 | 0.0071%(+0.002)#584 |
Common Questions
What are the Top 10 Cities with the Highest Percentage of Immigrants from Latvia in Illinois?
Top 10 Cities with the Highest Percentage of Immigrants from Latvia in Illinois are:
#1
0.80%
#2
0.67%
#3
0.45%
#4
0.43%
#5
0.42%
#6
0.42%
#7
0.41%
#8
0.40%
#9
0.35%
#10
0.35%
What city has the Highest Percentage of Immigrants from Latvia in Illinois?
East Dubuque has the Highest Percentage of Immigrants from Latvia in Illinois with 0.80%.
What is the Percentage of Immigrants from Latvia in the State of Illinois?
Percentage of Immigrants from Latvia in Illinois is 0.012%.
What is the Percentage of Immigrants from Latvia in the United States?
Percentage of Immigrants from Latvia in the United States is 0.0071%.