Cities with the Highest Poverty Level Among Females Between Ages 18 and 24 in Illinois
RELATED REPORTS & OPTIONS
Highest Poverty | Female 18-24
Illinois
Compare Cities
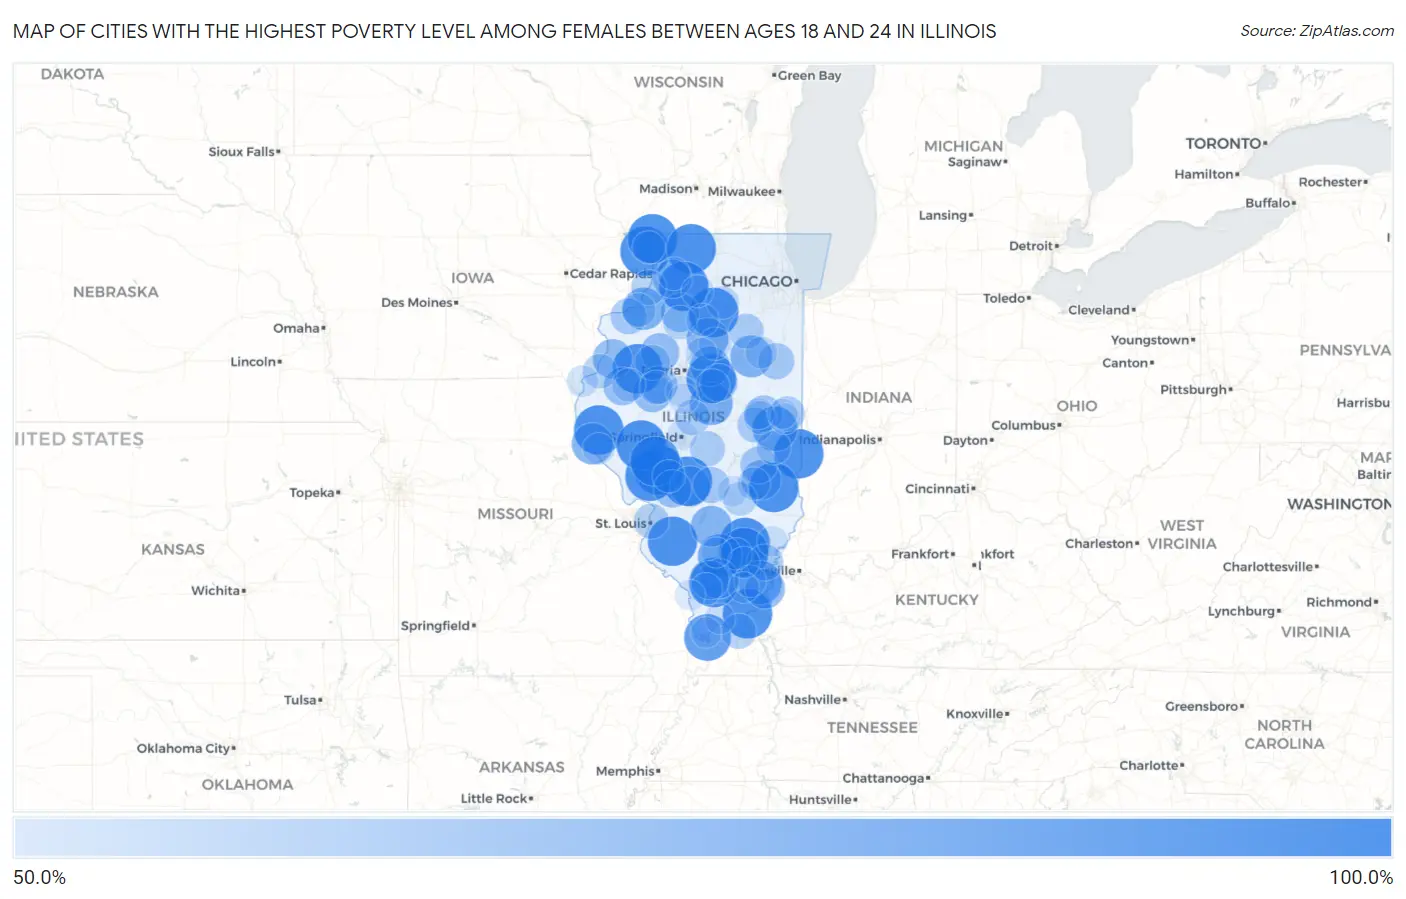
Map of Cities with the Highest Poverty Level Among Females Between Ages 18 and 24 in Illinois
0.0%
100.0%
Cities with the Highest Poverty Level Among Females Between Ages 18 and 24 in Illinois
| City | Female Poverty | vs State | vs National | |
| 1. | Hanover | 100.0% | 20.3%(+79.7)#1 | 21.6%(+78.4)#237 |
| 2. | Golconda | 100.0% | 20.3%(+79.7)#2 | 21.6%(+78.4)#248 |
| 3. | Apple Canyon Lake | 100.0% | 20.3%(+79.7)#3 | 21.6%(+78.4)#276 |
| 4. | Carlock | 100.0% | 20.3%(+79.7)#4 | 21.6%(+78.4)#337 |
| 5. | Liberty | 100.0% | 20.3%(+79.7)#5 | 21.6%(+78.4)#454 |
| 6. | Fayetteville | 100.0% | 20.3%(+79.7)#6 | 21.6%(+78.4)#458 |
| 7. | Butler | 100.0% | 20.3%(+79.7)#7 | 21.6%(+78.4)#500 |
| 8. | Troy Grove | 100.0% | 20.3%(+79.7)#8 | 21.6%(+78.4)#579 |
| 9. | Colp | 100.0% | 20.3%(+79.7)#9 | 21.6%(+78.4)#629 |
| 10. | Vermilion | 100.0% | 20.3%(+79.7)#10 | 21.6%(+78.4)#692 |
| 11. | Sims | 100.0% | 20.3%(+79.7)#11 | 21.6%(+78.4)#719 |
| 12. | Hettick | 100.0% | 20.3%(+79.7)#12 | 21.6%(+78.4)#789 |
| 13. | Ridott | 100.0% | 20.3%(+79.7)#14 | 21.6%(+78.4)#790 |
| 14. | Nelson | 100.0% | 20.3%(+79.7)#15 | 21.6%(+78.4)#791 |
| 15. | Rockbridge | 100.0% | 20.3%(+79.7)#16 | 21.6%(+78.4)#792 |
| 16. | Lynnville | 100.0% | 20.3%(+79.7)#17 | 21.6%(+78.4)#799 |
| 17. | St Augustine | 100.0% | 20.3%(+79.7)#18 | 21.6%(+78.4)#810 |
| 18. | Yale | 100.0% | 20.3%(+79.7)#19 | 21.6%(+78.4)#880 |
| 19. | Scottville | 100.0% | 20.3%(+79.7)#20 | 21.6%(+78.4)#885 |
| 20. | Barstow | 100.0% | 20.3%(+79.7)#21 | 21.6%(+78.4)#911 |
| 21. | Belle Prairie City | 100.0% | 20.3%(+79.7)#22 | 21.6%(+78.4)#934 |
| 22. | Cairo | 93.7% | 20.3%(+73.3)#23 | 21.6%(+72.1)#1,023 |
| 23. | Broadlands | 88.9% | 20.3%(+68.6)#24 | 21.6%(+67.3)#1,089 |
| 24. | Nason | 87.5% | 20.3%(+67.2)#25 | 21.6%(+65.9)#1,122 |
| 25. | Ridgway | 86.2% | 20.3%(+65.9)#26 | 21.6%(+64.6)#1,142 |
| 26. | Waynesville | 84.6% | 20.3%(+64.3)#27 | 21.6%(+63.0)#1,173 |
| 27. | Cleveland | 83.3% | 20.3%(+63.0)#28 | 21.6%(+61.7)#1,212 |
| 28. | Saunemin | 82.4% | 20.3%(+62.0)#29 | 21.6%(+60.8)#1,235 |
| 29. | Magnolia | 81.8% | 20.3%(+61.5)#30 | 21.6%(+60.2)#1,246 |
| 30. | Hull | 81.2% | 20.3%(+60.9)#31 | 21.6%(+59.7)#1,255 |
| 31. | Junction City | 80.0% | 20.3%(+59.7)#32 | 21.6%(+58.4)#1,295 |
| 32. | Taylor Springs | 78.6% | 20.3%(+58.2)#33 | 21.6%(+57.0)#1,351 |
| 33. | Secor | 77.8% | 20.3%(+57.4)#34 | 21.6%(+56.2)#1,383 |
| 34. | Shawneetown | 77.3% | 20.3%(+56.9)#35 | 21.6%(+55.7)#1,398 |
| 35. | Jewett | 76.9% | 20.3%(+56.6)#36 | 21.6%(+55.3)#1,412 |
| 36. | Freeman Spur | 76.9% | 20.3%(+56.6)#37 | 21.6%(+55.3)#1,413 |
| 37. | Biggsville | 76.5% | 20.3%(+56.1)#38 | 21.6%(+54.9)#1,423 |
| 38. | Lewistown | 75.9% | 20.3%(+55.5)#39 | 21.6%(+54.3)#1,441 |
| 39. | Hurst | 75.0% | 20.3%(+54.7)#40 | 21.6%(+53.4)#1,476 |
| 40. | Williamsfield | 75.0% | 20.3%(+54.7)#41 | 21.6%(+53.4)#1,484 |
| 41. | Manlius | 75.0% | 20.3%(+54.7)#42 | 21.6%(+53.4)#1,506 |
| 42. | Coleta | 75.0% | 20.3%(+54.7)#43 | 21.6%(+53.4)#1,512 |
| 43. | Holcomb | 75.0% | 20.3%(+54.7)#44 | 21.6%(+53.4)#1,515 |
| 44. | Macomb | 73.6% | 20.3%(+53.3)#45 | 21.6%(+52.0)#1,555 |
| 45. | Dunfermline | 72.7% | 20.3%(+52.4)#46 | 21.6%(+51.1)#1,589 |
| 46. | Benld | 72.3% | 20.3%(+52.0)#47 | 21.6%(+50.7)#1,610 |
| 47. | Normal | 72.0% | 20.3%(+51.7)#48 | 21.6%(+50.4)#1,625 |
| 48. | Lerna | 70.6% | 20.3%(+50.3)#49 | 21.6%(+49.0)#1,684 |
| 49. | Urbana | 70.4% | 20.3%(+50.0)#50 | 21.6%(+48.8)#1,689 |
| 50. | Carmi | 69.5% | 20.3%(+49.2)#51 | 21.6%(+47.9)#1,730 |
| 51. | Ramsey | 69.2% | 20.3%(+48.9)#52 | 21.6%(+47.6)#1,738 |
| 52. | Danforth | 69.2% | 20.3%(+48.9)#53 | 21.6%(+47.6)#1,741 |
| 53. | Oak Grove | 69.2% | 20.3%(+48.9)#54 | 21.6%(+47.6)#1,743 |
| 54. | Brookport | 66.7% | 20.3%(+46.3)#55 | 21.6%(+45.1)#1,877 |
| 55. | Stonington | 66.7% | 20.3%(+46.3)#56 | 21.6%(+45.1)#1,878 |
| 56. | Albany | 66.7% | 20.3%(+46.3)#57 | 21.6%(+45.1)#1,881 |
| 57. | Brooklyn | 66.7% | 20.3%(+46.3)#58 | 21.6%(+45.1)#1,886 |
| 58. | Sadorus | 66.7% | 20.3%(+46.3)#59 | 21.6%(+45.1)#1,906 |
| 59. | Verona | 66.7% | 20.3%(+46.3)#60 | 21.6%(+45.1)#1,917 |
| 60. | Maquon | 66.7% | 20.3%(+46.3)#61 | 21.6%(+45.1)#1,930 |
| 61. | Broadwell | 66.7% | 20.3%(+46.3)#62 | 21.6%(+45.1)#1,942 |
| 62. | Oakwood | 65.8% | 20.3%(+45.5)#63 | 21.6%(+44.2)#1,970 |
| 63. | Lomax | 65.0% | 20.3%(+44.7)#64 | 21.6%(+43.4)#2,009 |
| 64. | Oakland | 64.5% | 20.3%(+44.2)#65 | 21.6%(+42.9)#2,030 |
| 65. | Twin Grove | 64.4% | 20.3%(+44.1)#66 | 21.6%(+42.8)#2,036 |
| 66. | Bryant | 64.3% | 20.3%(+44.0)#67 | 21.6%(+42.7)#2,046 |
| 67. | Buda | 63.6% | 20.3%(+43.3)#68 | 21.6%(+42.0)#2,081 |
| 68. | Mason | 63.6% | 20.3%(+43.3)#69 | 21.6%(+42.0)#2,082 |
| 69. | Silvis | 63.6% | 20.3%(+43.3)#70 | 21.6%(+42.0)#2,088 |
| 70. | Bardolph | 62.5% | 20.3%(+42.2)#71 | 21.6%(+40.9)#2,165 |
| 71. | Milledgeville | 61.5% | 20.3%(+41.2)#72 | 21.6%(+39.9)#2,219 |
| 72. | Savoy | 61.4% | 20.3%(+41.1)#73 | 21.6%(+39.8)#2,228 |
| 73. | Earlville | 61.3% | 20.3%(+41.0)#74 | 21.6%(+39.7)#2,231 |
| 74. | Montrose | 61.1% | 20.3%(+40.8)#75 | 21.6%(+39.5)#2,253 |
| 75. | Wenona | 60.9% | 20.3%(+40.5)#76 | 21.6%(+39.3)#2,267 |
| 76. | Elizabeth | 60.9% | 20.3%(+40.5)#77 | 21.6%(+39.3)#2,268 |
| 77. | Carlinville | 60.7% | 20.3%(+40.4)#78 | 21.6%(+39.2)#2,274 |
| 78. | Seatonville | 60.7% | 20.3%(+40.4)#79 | 21.6%(+39.1)#2,277 |
| 79. | Amboy | 59.5% | 20.3%(+39.2)#80 | 21.6%(+37.9)#2,372 |
| 80. | Kempton | 59.5% | 20.3%(+39.1)#81 | 21.6%(+37.9)#2,377 |
| 81. | Washburn | 58.8% | 20.3%(+38.5)#82 | 21.6%(+37.2)#2,416 |
| 82. | New Canton | 58.8% | 20.3%(+38.5)#83 | 21.6%(+37.2)#2,420 |
| 83. | Carbondale | 58.7% | 20.3%(+38.4)#84 | 21.6%(+37.1)#2,429 |
| 84. | Eldorado | 58.7% | 20.3%(+38.4)#85 | 21.6%(+37.1)#2,430 |
| 85. | Nauvoo | 58.5% | 20.3%(+38.2)#86 | 21.6%(+36.9)#2,443 |
| 86. | Dahlgren | 58.3% | 20.3%(+38.0)#87 | 21.6%(+36.7)#2,456 |
| 87. | Mcleansboro | 58.2% | 20.3%(+37.8)#88 | 21.6%(+36.6)#2,468 |
| 88. | Green Valley | 57.1% | 20.3%(+36.8)#89 | 21.6%(+35.5)#2,548 |
| 89. | Champaign | 57.1% | 20.3%(+36.8)#90 | 21.6%(+35.5)#2,586 |
| 90. | Harrisburg | 56.8% | 20.3%(+36.4)#91 | 21.6%(+35.2)#2,595 |
| 91. | Fairmount | 56.7% | 20.3%(+36.3)#92 | 21.6%(+35.1)#2,599 |
| 92. | Karnak | 56.6% | 20.3%(+36.3)#93 | 21.6%(+35.0)#2,600 |
| 93. | Altamont | 56.2% | 20.3%(+35.9)#94 | 21.6%(+34.7)#2,626 |
| 94. | Mounds | 56.2% | 20.3%(+35.9)#95 | 21.6%(+34.7)#2,629 |
| 95. | Albion | 56.0% | 20.3%(+35.6)#96 | 21.6%(+34.4)#2,647 |
| 96. | Grandview | 55.8% | 20.3%(+35.5)#97 | 21.6%(+34.2)#2,656 |
| 97. | San Jose | 55.6% | 20.3%(+35.2)#98 | 21.6%(+34.0)#2,678 |
| 98. | Fithian | 55.6% | 20.3%(+35.2)#99 | 21.6%(+34.0)#2,681 |
| 99. | Grand Tower | 55.6% | 20.3%(+35.2)#100 | 21.6%(+34.0)#2,685 |
| 100. | Waltonville | 55.6% | 20.3%(+35.2)#101 | 21.6%(+34.0)#2,692 |
Common Questions
What are the Top 10 Cities with the Highest Poverty Level Among Females Between Ages 18 and 24 in Illinois?
Top 10 Cities with the Highest Poverty Level Among Females Between Ages 18 and 24 in Illinois are:
#1
100.0%
#2
100.0%
#3
100.0%
#4
100.0%
#5
100.0%
#6
100.0%
#7
100.0%
#8
100.0%
#9
100.0%
#10
100.0%
What city has the Highest Poverty Level Among Females Between Ages 18 and 24 in Illinois?
Hanover has the Highest Poverty Level Among Females Between Ages 18 and 24 in Illinois with 100.0%.
What is the Poverty Level Among Females Between Ages 18 and 24 in the State of Illinois?
Poverty Level Among Females Between Ages 18 and 24 in Illinois is 20.3%.
What is the Poverty Level Among Females Between Ages 18 and 24 in the United States?
Poverty Level Among Females Between Ages 18 and 24 in the United States is 21.6%.