Cities with the Most Immigrants from Ireland in Illinois
RELATED REPORTS & OPTIONS
Ireland
Illinois
Compare Cities
Map of Cities with the Most Immigrants from Ireland in Illinois
0
3,000
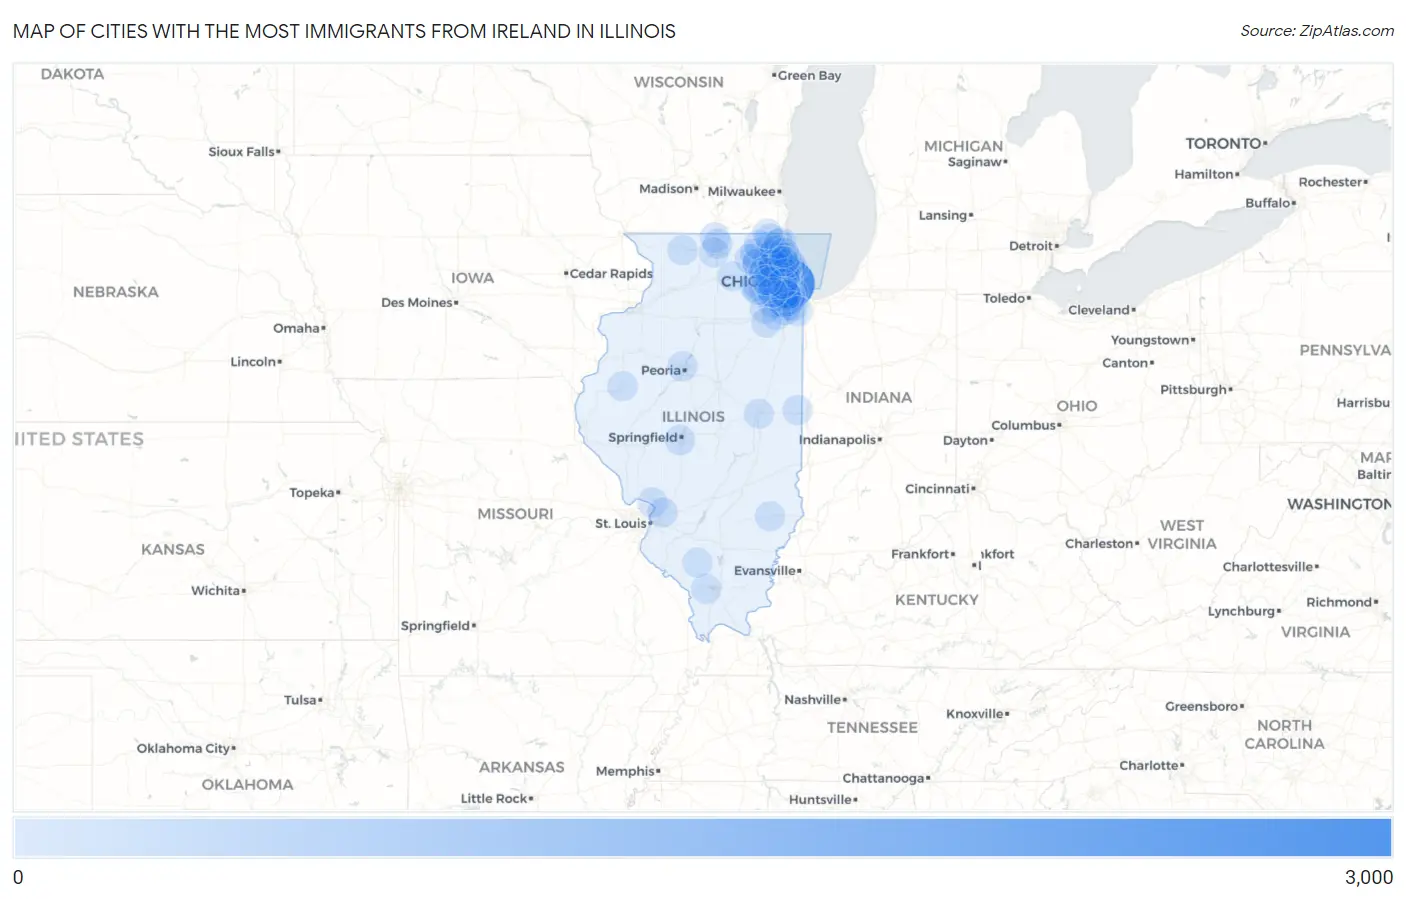
Cities with the Most Immigrants from Ireland in Illinois
| City | Ireland | vs State | vs National | |
| 1. | Chicago | 2,535 | 6,611(38.35%)#1 | 119,836(2.12%)#3 |
| 2. | Oak Lawn | 326 | 6,611(4.93%)#2 | 119,836(0.27%)#21 |
| 3. | Naperville | 254 | 6,611(3.84%)#3 | 119,836(0.21%)#34 |
| 4. | Orland Park | 146 | 6,611(2.21%)#4 | 119,836(0.12%)#81 |
| 5. | Park Ridge | 139 | 6,611(2.10%)#5 | 119,836(0.12%)#89 |
| 6. | Lockport | 100 | 6,611(1.51%)#6 | 119,836(0.08%)#160 |
| 7. | Tinley Park | 93 | 6,611(1.41%)#7 | 119,836(0.08%)#177 |
| 8. | Evanston | 81 | 6,611(1.23%)#8 | 119,836(0.07%)#217 |
| 9. | Algonquin | 80 | 6,611(1.21%)#9 | 119,836(0.07%)#224 |
| 10. | Frankfort | 79 | 6,611(1.19%)#10 | 119,836(0.07%)#227 |
| 11. | Harwood Heights | 75 | 6,611(1.13%)#11 | 119,836(0.06%)#250 |
| 12. | Skokie | 65 | 6,611(0.98%)#12 | 119,836(0.05%)#280 |
| 13. | Addison | 65 | 6,611(0.98%)#13 | 119,836(0.05%)#282 |
| 14. | Hoffman Estates | 57 | 6,611(0.86%)#14 | 119,836(0.05%)#330 |
| 15. | Elmhurst | 56 | 6,611(0.85%)#15 | 119,836(0.05%)#342 |
| 16. | Evergreen Park | 54 | 6,611(0.82%)#16 | 119,836(0.05%)#354 |
| 17. | Mount Prospect | 46 | 6,611(0.70%)#17 | 119,836(0.04%)#421 |
| 18. | Oak Forest | 46 | 6,611(0.70%)#18 | 119,836(0.04%)#426 |
| 19. | Batavia | 45 | 6,611(0.68%)#19 | 119,836(0.04%)#431 |
| 20. | Westmont | 45 | 6,611(0.68%)#20 | 119,836(0.04%)#432 |
| 21. | Barrington | 44 | 6,611(0.67%)#21 | 119,836(0.04%)#445 |
| 22. | Arlington Heights | 42 | 6,611(0.64%)#22 | 119,836(0.04%)#465 |
| 23. | Niles | 42 | 6,611(0.64%)#23 | 119,836(0.04%)#468 |
| 24. | La Grange | 42 | 6,611(0.64%)#24 | 119,836(0.04%)#471 |
| 25. | Freeport | 40 | 6,611(0.61%)#25 | 119,836(0.03%)#491 |
| 26. | Lake Zurich | 40 | 6,611(0.61%)#26 | 119,836(0.03%)#493 |
| 27. | Hinsdale | 40 | 6,611(0.61%)#27 | 119,836(0.03%)#494 |
| 28. | Oak Park | 39 | 6,611(0.59%)#28 | 119,836(0.03%)#508 |
| 29. | Palos Park | 39 | 6,611(0.59%)#29 | 119,836(0.03%)#521 |
| 30. | Glenview | 38 | 6,611(0.57%)#30 | 119,836(0.03%)#530 |
| 31. | Crestwood | 38 | 6,611(0.57%)#31 | 119,836(0.03%)#536 |
| 32. | Waukegan | 37 | 6,611(0.56%)#32 | 119,836(0.03%)#545 |
| 33. | Des Plaines | 37 | 6,611(0.56%)#33 | 119,836(0.03%)#548 |
| 34. | Springfield | 34 | 6,611(0.51%)#34 | 119,836(0.03%)#592 |
| 35. | Alsip | 34 | 6,611(0.51%)#35 | 119,836(0.03%)#597 |
| 36. | Palos Hills | 34 | 6,611(0.51%)#36 | 119,836(0.03%)#598 |
| 37. | Libertyville | 33 | 6,611(0.50%)#37 | 119,836(0.03%)#616 |
| 38. | North Aurora | 33 | 6,611(0.50%)#38 | 119,836(0.03%)#617 |
| 39. | Rockton | 33 | 6,611(0.50%)#39 | 119,836(0.03%)#622 |
| 40. | Chicago Ridge | 32 | 6,611(0.48%)#40 | 119,836(0.03%)#642 |
| 41. | Downers Grove | 31 | 6,611(0.47%)#41 | 119,836(0.03%)#659 |
| 42. | Elk Grove Village | 31 | 6,611(0.47%)#42 | 119,836(0.03%)#662 |
| 43. | Villa Park | 31 | 6,611(0.47%)#43 | 119,836(0.03%)#668 |
| 44. | Prospect Heights | 31 | 6,611(0.47%)#44 | 119,836(0.03%)#670 |
| 45. | Palos Heights | 31 | 6,611(0.47%)#45 | 119,836(0.03%)#673 |
| 46. | Lemont | 30 | 6,611(0.45%)#46 | 119,836(0.03%)#684 |
| 47. | Bensenville | 28 | 6,611(0.42%)#47 | 119,836(0.02%)#725 |
| 48. | Morton Grove | 27 | 6,611(0.41%)#48 | 119,836(0.02%)#752 |
| 49. | Buffalo Grove | 26 | 6,611(0.39%)#49 | 119,836(0.02%)#767 |
| 50. | Wheeling | 26 | 6,611(0.39%)#50 | 119,836(0.02%)#768 |
| 51. | Huntley | 26 | 6,611(0.39%)#51 | 119,836(0.02%)#770 |
| 52. | Alton | 23 | 6,611(0.35%)#52 | 119,836(0.02%)#862 |
| 53. | Lisle | 23 | 6,611(0.35%)#53 | 119,836(0.02%)#863 |
| 54. | Joliet | 22 | 6,611(0.33%)#54 | 119,836(0.02%)#882 |
| 55. | Schaumburg | 22 | 6,611(0.33%)#55 | 119,836(0.02%)#887 |
| 56. | Crystal Lake | 22 | 6,611(0.33%)#56 | 119,836(0.02%)#890 |
| 57. | Elmwood Park | 22 | 6,611(0.33%)#57 | 119,836(0.02%)#897 |
| 58. | Norridge | 22 | 6,611(0.33%)#58 | 119,836(0.02%)#904 |
| 59. | Hickory Hills | 22 | 6,611(0.33%)#59 | 119,836(0.02%)#905 |
| 60. | Glen Carbon | 22 | 6,611(0.33%)#60 | 119,836(0.02%)#907 |
| 61. | Round Lake Park | 22 | 6,611(0.33%)#61 | 119,836(0.02%)#912 |
| 62. | Orland Hills | 22 | 6,611(0.33%)#62 | 119,836(0.02%)#915 |
| 63. | Forest Park | 21 | 6,611(0.32%)#63 | 119,836(0.02%)#945 |
| 64. | Flossmoor | 20 | 6,611(0.30%)#64 | 119,836(0.02%)#993 |
| 65. | Forest Lake | 20 | 6,611(0.30%)#65 | 119,836(0.02%)#1,003 |
| 66. | Carpentersville | 18 | 6,611(0.27%)#66 | 119,836(0.02%)#1,049 |
| 67. | Rockford | 17 | 6,611(0.26%)#67 | 119,836(0.01%)#1,076 |
| 68. | Dekalb | 17 | 6,611(0.26%)#68 | 119,836(0.01%)#1,091 |
| 69. | Carbondale | 17 | 6,611(0.26%)#69 | 119,836(0.01%)#1,098 |
| 70. | West Dundee | 17 | 6,611(0.26%)#70 | 119,836(0.01%)#1,114 |
| 71. | Pinckneyville | 17 | 6,611(0.26%)#71 | 119,836(0.01%)#1,119 |
| 72. | Palatine | 16 | 6,611(0.24%)#72 | 119,836(0.01%)#1,128 |
| 73. | Mchenry | 16 | 6,611(0.24%)#73 | 119,836(0.01%)#1,138 |
| 74. | Winnetka | 16 | 6,611(0.24%)#74 | 119,836(0.01%)#1,150 |
| 75. | Peoria | 15 | 6,611(0.23%)#75 | 119,836(0.01%)#1,172 |
| 76. | Wheaton | 15 | 6,611(0.23%)#76 | 119,836(0.01%)#1,177 |
| 77. | Roselle | 15 | 6,611(0.23%)#77 | 119,836(0.01%)#1,191 |
| 78. | Machesney Park | 15 | 6,611(0.23%)#78 | 119,836(0.01%)#1,192 |
| 79. | Bartlett | 14 | 6,611(0.21%)#79 | 119,836(0.01%)#1,246 |
| 80. | Glen Ellyn | 14 | 6,611(0.21%)#80 | 119,836(0.01%)#1,255 |
| 81. | Worth | 14 | 6,611(0.21%)#81 | 119,836(0.01%)#1,275 |
| 82. | Mundelein | 13 | 6,611(0.20%)#82 | 119,836(0.01%)#1,317 |
| 83. | Rolling Meadows | 13 | 6,611(0.20%)#83 | 119,836(0.01%)#1,319 |
| 84. | Macomb | 13 | 6,611(0.20%)#84 | 119,836(0.01%)#1,326 |
| 85. | Aurora | 12 | 6,611(0.18%)#85 | 119,836(0.01%)#1,357 |
| 86. | Highland Park | 12 | 6,611(0.18%)#86 | 119,836(0.01%)#1,374 |
| 87. | Manhattan | 12 | 6,611(0.18%)#87 | 119,836(0.01%)#1,392 |
| 88. | Lake Villa | 12 | 6,611(0.18%)#88 | 119,836(0.01%)#1,394 |
| 89. | Champaign | 11 | 6,611(0.17%)#89 | 119,836(0.01%)#1,418 |
| 90. | La Grange Park | 11 | 6,611(0.17%)#90 | 119,836(0.01%)#1,446 |
| 91. | Wilmington | 11 | 6,611(0.17%)#91 | 119,836(0.01%)#1,457 |
| 92. | Woodridge | 10 | 6,611(0.15%)#92 | 119,836(0.01%)#1,498 |
| 93. | Gurnee | 10 | 6,611(0.15%)#93 | 119,836(0.01%)#1,500 |
| 94. | Lake Forest | 10 | 6,611(0.15%)#94 | 119,836(0.01%)#1,510 |
| 95. | Winfield | 10 | 6,611(0.15%)#95 | 119,836(0.01%)#1,525 |
| 96. | Steger | 10 | 6,611(0.15%)#96 | 119,836(0.01%)#1,526 |
| 97. | Northbrook | 9 | 6,611(0.14%)#97 | 119,836(0.01%)#1,581 |
| 98. | Danville | 9 | 6,611(0.14%)#98 | 119,836(0.01%)#1,586 |
| 99. | Olney | 9 | 6,611(0.14%)#99 | 119,836(0.01%)#1,608 |
| 100. | Lake Catherine | 9 | 6,611(0.14%)#100 | 119,836(0.01%)#1,630 |
Common Questions
What are the Top 10 Cities with the Most Immigrants from Ireland in Illinois?
Top 10 Cities with the Most Immigrants from Ireland in Illinois are:
#1
2,535
#2
326
#3
254
#4
146
#5
139
#6
100
#7
93
#8
81
#9
80
#10
79
What city has the Most Immigrants from Ireland in Illinois?
Chicago has the Most Immigrants from Ireland in Illinois with 2,535.
What is the Total Immigrants from Ireland in the State of Illinois?
Total Immigrants from Ireland in Illinois is 6,611.
What is the Total Immigrants from Ireland in the United States?
Total Immigrants from Ireland in the United States is 119,836.