Zip Codes with the Highest Percentage of Population Employed in Food Preparation & Serving in Schaumburg, IL
RELATED REPORTS & OPTIONS
Food Preparation & Serving
Schaumburg
Compare Zip Codes
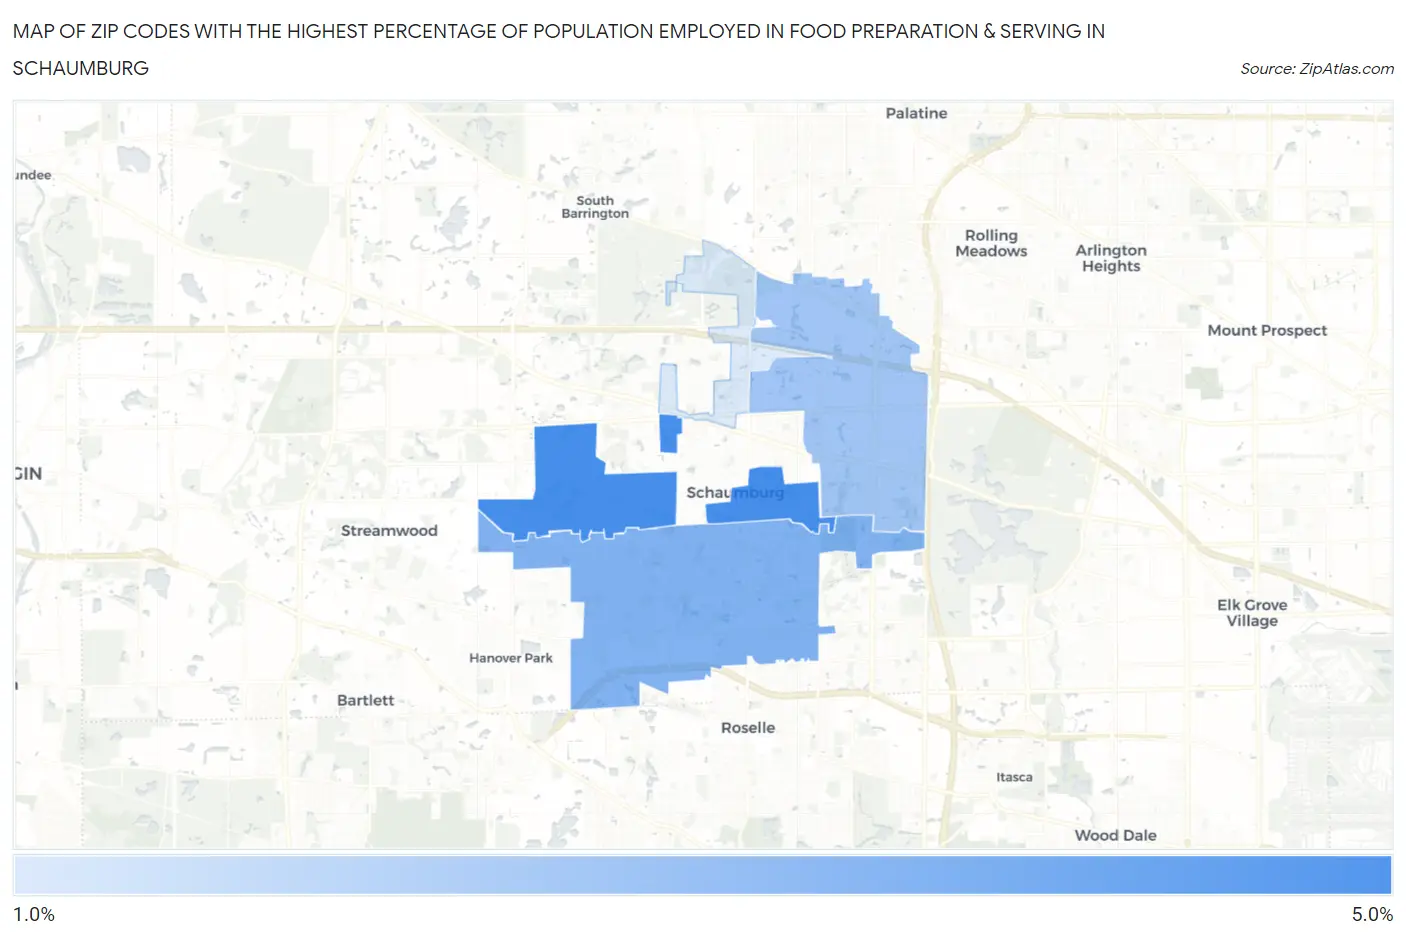
Map of Zip Codes with the Highest Percentage of Population Employed in Food Preparation & Serving in Schaumburg
1.3%
4.6%
Zip Codes with the Highest Percentage of Population Employed in Food Preparation & Serving in Schaumburg, IL
| Zip Code | % Employed | vs State | vs National | |
| 1. | 60194 | 4.6% | 5.0%(-0.405)#623 | 5.3%(-0.656)#14,452 |
| 2. | 60193 | 3.4% | 5.0%(-1.68)#857 | 5.3%(-1.93)#19,804 |
| 3. | 60173 | 2.6% | 5.0%(-2.40)#998 | 5.3%(-2.65)#22,655 |
| 4. | 60195 | 1.3% | 5.0%(-3.70)#1,179 | 5.3%(-3.95)#26,341 |
1
Common Questions
What are the Top 3 Zip Codes with the Highest Percentage of Population Employed in Food Preparation & Serving in Schaumburg, IL?
Top 3 Zip Codes with the Highest Percentage of Population Employed in Food Preparation & Serving in Schaumburg, IL are:
What zip code has the Highest Percentage of Population Employed in Food Preparation & Serving in Schaumburg, IL?
60194 has the Highest Percentage of Population Employed in Food Preparation & Serving in Schaumburg, IL with 4.6%.
What is the Percentage of Population Employed in Food Preparation & Serving in Schaumburg, IL?
Percentage of Population Employed in Food Preparation & Serving in Schaumburg is 3.4%.
What is the Percentage of Population Employed in Food Preparation & Serving in Illinois?
Percentage of Population Employed in Food Preparation & Serving in Illinois is 5.0%.
What is the Percentage of Population Employed in Food Preparation & Serving in the United States?
Percentage of Population Employed in Food Preparation & Serving in the United States is 5.3%.