Latham, IL Map & Demographics
Latham Map
Latham Overview
$29,293
PER CAPITA INCOME
$78,750
AVG FAMILY INCOME
$61,250
AVG HOUSEHOLD INCOME
61.7%
WAGE / INCOME GAP [ % ]
38.3¢/ $1
WAGE / INCOME GAP [ $ ]
0.35
INEQUALITY / GINI INDEX
450
TOTAL POPULATION
252
MALE POPULATION
198
FEMALE POPULATION
127.27
MALES / 100 FEMALES
78.57
FEMALES / 100 MALES
34.5
MEDIAN AGE
2.9
AVG FAMILY SIZE
2.3
AVG HOUSEHOLD SIZE
268
LABOR FORCE [ PEOPLE ]
68.7%
PERCENT IN LABOR FORCE
4.7%
UNEMPLOYMENT RATE
Latham Zip Codes
Latham Area Codes
Income in Latham
Income Overview in Latham
Per Capita Income in Latham is $29,293, while median incomes of families and households are $78,750 and $61,250 respectively.
| Characteristic | Number | Measure |
| Per Capita Income | 450 | $29,293 |
| Median Family Income | 93 | $78,750 |
| Mean Family Income | 93 | $82,826 |
| Median Household Income | 193 | $61,250 |
| Mean Household Income | 193 | $70,296 |
| Income Deficit | 93 | $0 |
| Wage / Income Gap (%) | 450 | 61.71% |
| Wage / Income Gap ($) | 450 | 38.29¢ per $1 |
| Gini / Inequality Index | 450 | 0.35 |
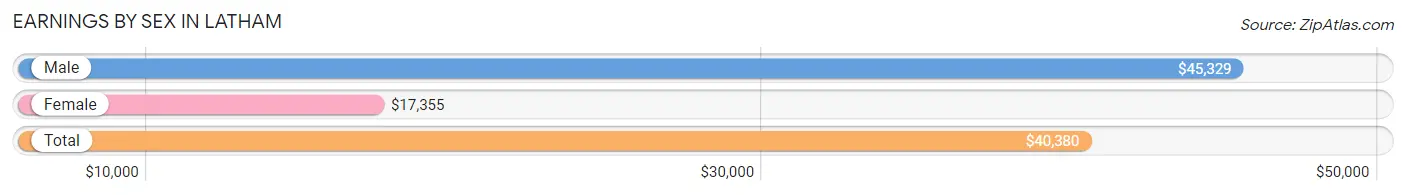
Earnings by Sex in Latham
Average Earnings in Latham are $40,380, $45,329 for men and $17,355 for women, a difference of 61.7%.
| Sex | Number | Average Earnings |
| Male | 150 (52.6%) | $45,329 |
| Female | 135 (47.4%) | $17,355 |
| Total | 285 (100.0%) | $40,380 |
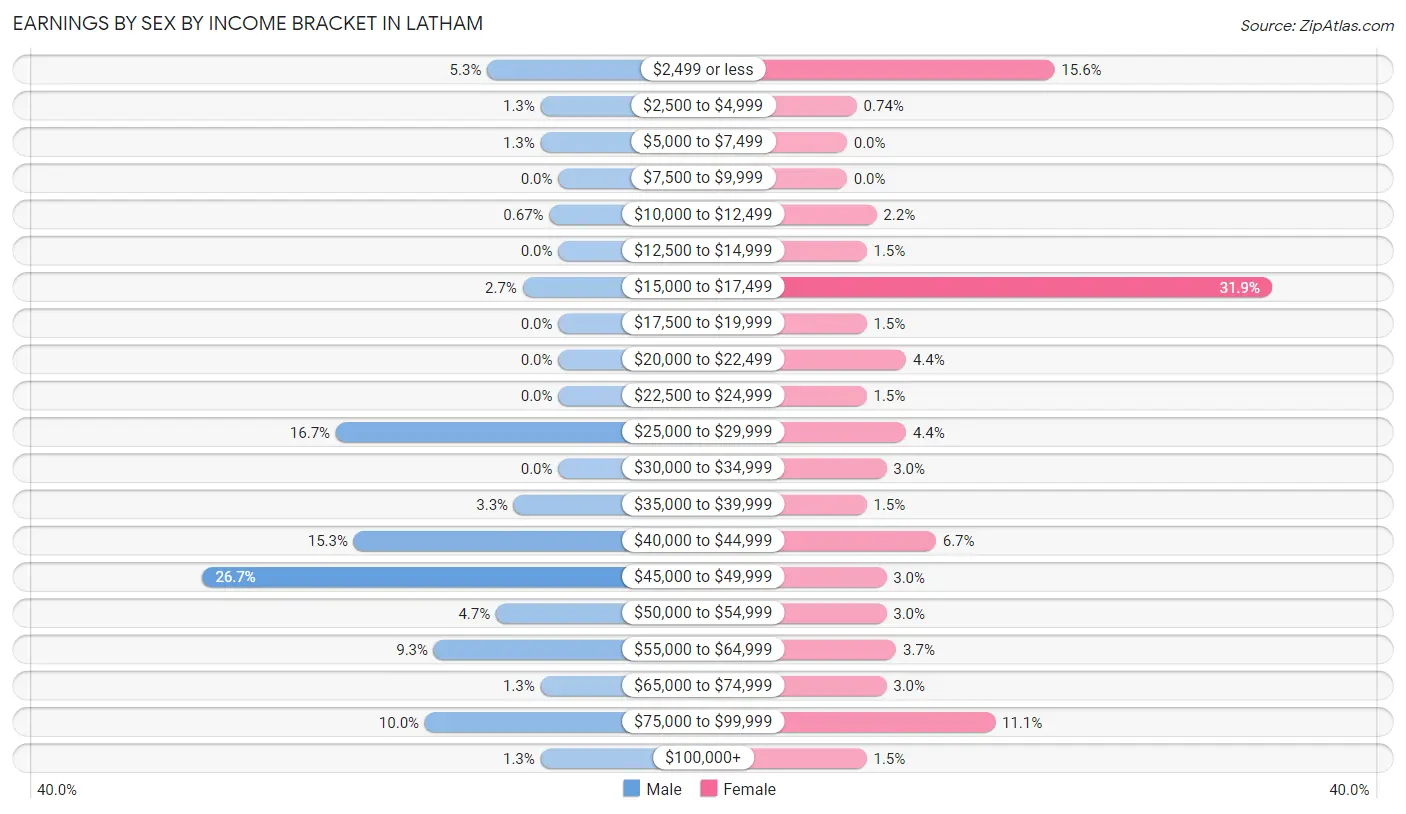
Earnings by Sex by Income Bracket in Latham
The most common earnings brackets in Latham are $45,000 to $49,999 for men (40 | 26.7%) and $15,000 to $17,499 for women (43 | 31.9%).
| Income | Male | Female |
| $2,499 or less | 8 (5.3%) | 21 (15.6%) |
| $2,500 to $4,999 | 2 (1.3%) | 1 (0.7%) |
| $5,000 to $7,499 | 2 (1.3%) | 0 (0.0%) |
| $7,500 to $9,999 | 0 (0.0%) | 0 (0.0%) |
| $10,000 to $12,499 | 1 (0.7%) | 3 (2.2%) |
| $12,500 to $14,999 | 0 (0.0%) | 2 (1.5%) |
| $15,000 to $17,499 | 4 (2.7%) | 43 (31.9%) |
| $17,500 to $19,999 | 0 (0.0%) | 2 (1.5%) |
| $20,000 to $22,499 | 0 (0.0%) | 6 (4.4%) |
| $22,500 to $24,999 | 0 (0.0%) | 2 (1.5%) |
| $25,000 to $29,999 | 25 (16.7%) | 6 (4.4%) |
| $30,000 to $34,999 | 0 (0.0%) | 4 (3.0%) |
| $35,000 to $39,999 | 5 (3.3%) | 2 (1.5%) |
| $40,000 to $44,999 | 23 (15.3%) | 9 (6.7%) |
| $45,000 to $49,999 | 40 (26.7%) | 4 (3.0%) |
| $50,000 to $54,999 | 7 (4.7%) | 4 (3.0%) |
| $55,000 to $64,999 | 14 (9.3%) | 5 (3.7%) |
| $65,000 to $74,999 | 2 (1.3%) | 4 (3.0%) |
| $75,000 to $99,999 | 15 (10.0%) | 15 (11.1%) |
| $100,000+ | 2 (1.3%) | 2 (1.5%) |
| Total | 150 (100.0%) | 135 (100.0%) |
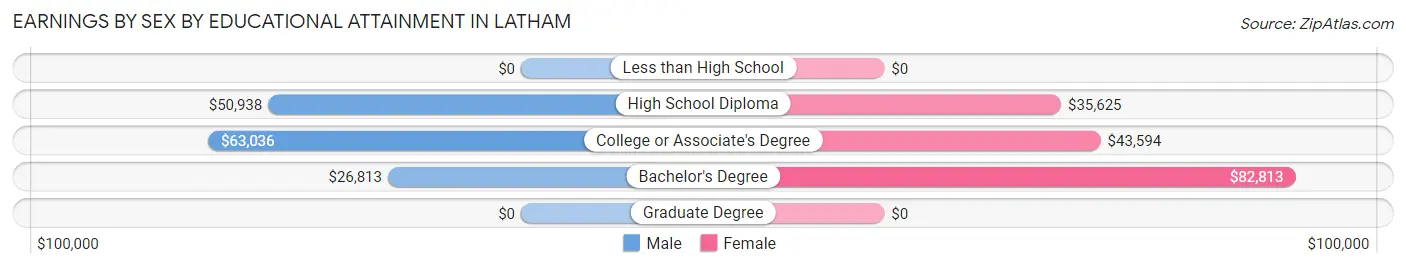
Earnings by Sex by Educational Attainment in Latham
Average earnings in Latham are $42,031 for men and $44,306 for women, a difference of 5.1%. Men with an educational attainment of college or associate's degree enjoy the highest average annual earnings of $63,036, while those with bachelor's degree education earn the least with $26,813. Women with an educational attainment of bachelor's degree earn the most with the average annual earnings of $82,813, while those with high school diploma education have the smallest earnings of $35,625.
| Educational Attainment | Male Income | Female Income |
| Less than High School | - | - |
| High School Diploma | $50,938 | $35,625 |
| College or Associate's Degree | $63,036 | $43,594 |
| Bachelor's Degree | $26,813 | $82,813 |
| Graduate Degree | - | - |
| Total | $42,031 | $44,306 |
Family Income in Latham
Family Income Brackets in Latham
According to the Latham family income data, there are 38 families falling into the $100,000 to $149,999 income range, which is the most common income bracket and makes up 40.9% of all families.
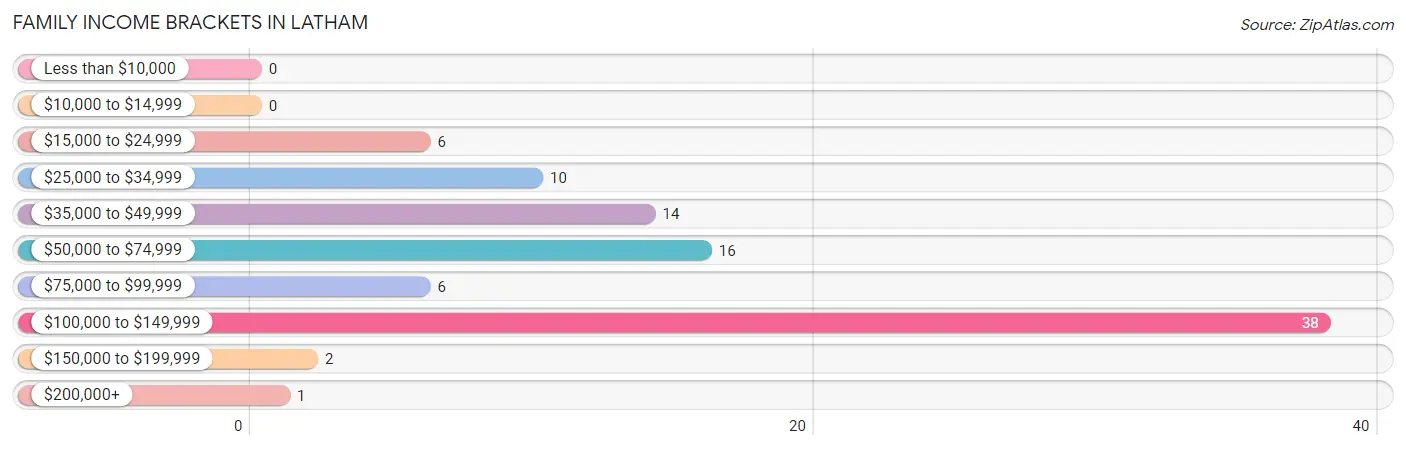
| Income Bracket | # Families | % Families |
| Less than $10,000 | 0 | 0.0% |
| $10,000 to $14,999 | 0 | 0.0% |
| $15,000 to $24,999 | 6 | 6.5% |
| $25,000 to $34,999 | 10 | 10.8% |
| $35,000 to $49,999 | 14 | 15.1% |
| $50,000 to $74,999 | 16 | 17.2% |
| $75,000 to $99,999 | 6 | 6.5% |
| $100,000 to $149,999 | 38 | 40.9% |
| $150,000 to $199,999 | 2 | 2.2% |
| $200,000+ | 1 | 1.1% |
Family Income by Famaliy Size in Latham
5-person families (8 | 8.6%) account for the highest median family income in Latham with $123,333 per family, while 3-person families (25 | 26.9%) have the highest median income of $37,708 per family member.
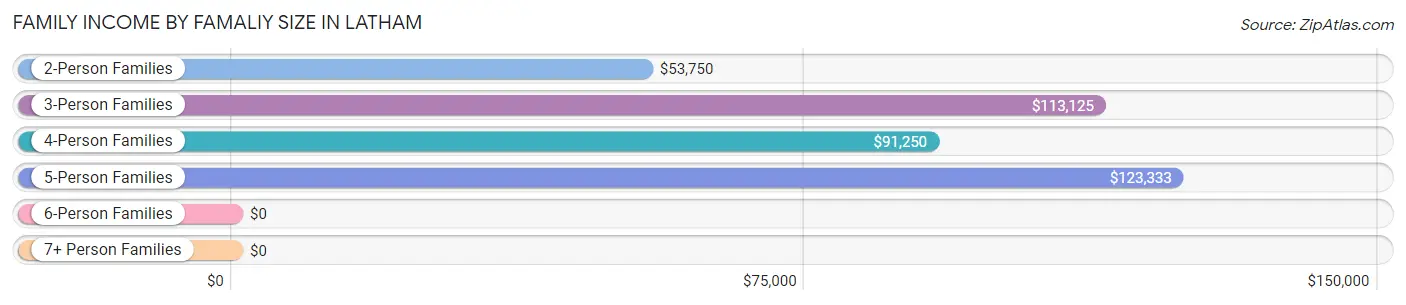
| Income Bracket | # Families | Median Income |
| 2-Person Families | 51 (54.8%) | $53,750 |
| 3-Person Families | 25 (26.9%) | $113,125 |
| 4-Person Families | 6 (6.5%) | $91,250 |
| 5-Person Families | 8 (8.6%) | $123,333 |
| 6-Person Families | 3 (3.2%) | $0 |
| 7+ Person Families | 0 (0.0%) | $0 |
| Total | 93 (100.0%) | $78,750 |
Family Income by Number of Earners in Latham
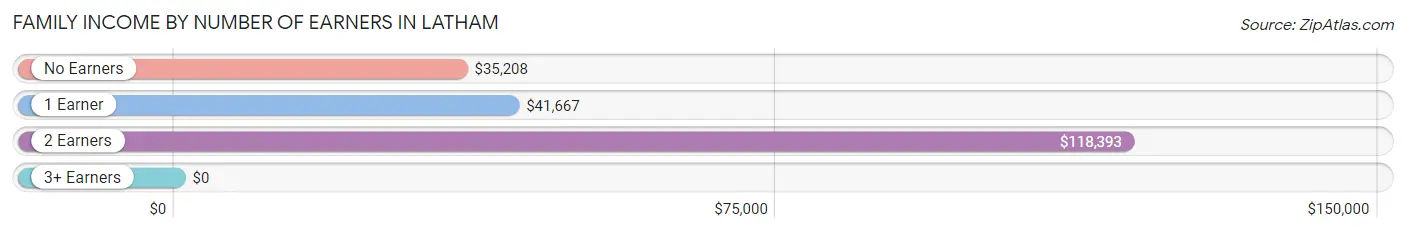
| Number of Earners | # Families | Median Income |
| No Earners | 23 (24.7%) | $35,208 |
| 1 Earner | 18 (19.4%) | $41,667 |
| 2 Earners | 47 (50.5%) | $118,393 |
| 3+ Earners | 5 (5.4%) | $0 |
| Total | 93 (100.0%) | $78,750 |
Household Income in Latham
Household Income Brackets in Latham
With 53 households falling in the category, the $50,000 to $74,999 income range is the most frequent in Latham, accounting for 27.5% of all households. In contrast, only 1 households (0.5%) fall into the $200,000+ income bracket, making it the least populous group.
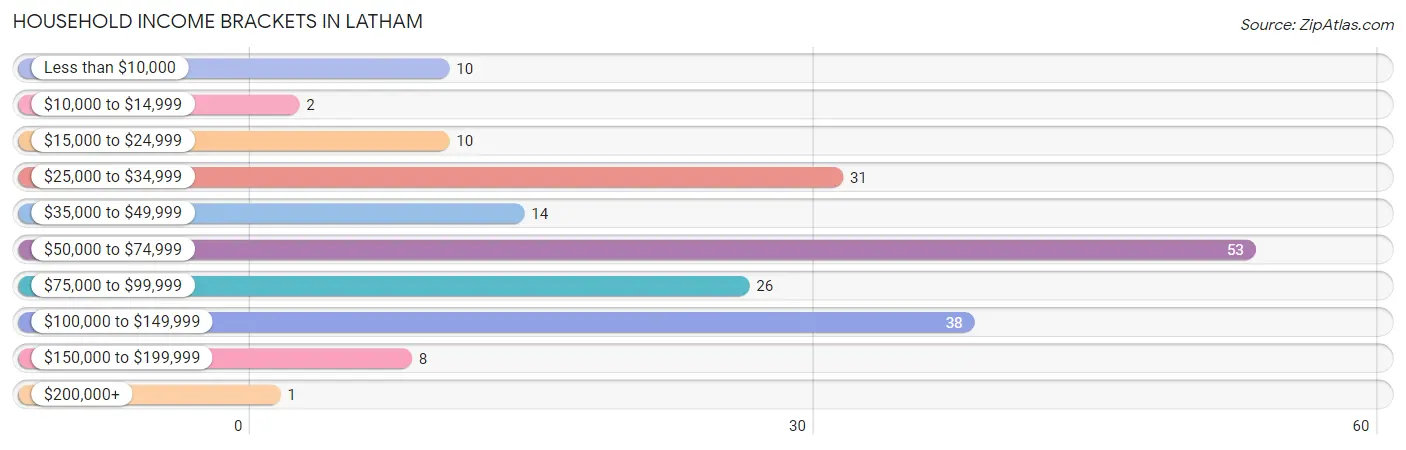
| Income Bracket | # Households | % Households |
| Less than $10,000 | 10 | 5.2% |
| $10,000 to $14,999 | 2 | 1.0% |
| $15,000 to $24,999 | 10 | 5.2% |
| $25,000 to $34,999 | 31 | 16.1% |
| $35,000 to $49,999 | 14 | 7.3% |
| $50,000 to $74,999 | 53 | 27.5% |
| $75,000 to $99,999 | 26 | 13.5% |
| $100,000 to $149,999 | 38 | 19.7% |
| $150,000 to $199,999 | 8 | 4.1% |
| $200,000+ | 1 | 0.5% |
Household Income by Householder Age in Latham
The median household income in Latham is $61,250, with the highest median household income of $113,125 found in the 45 to 64 years age bracket for the primary householder. A total of 62 households (32.1%) fall into this category. Meanwhile, the 15 to 24 years age bracket for the primary householder has the lowest median household income of $0, with 44 households (22.8%) in this group.
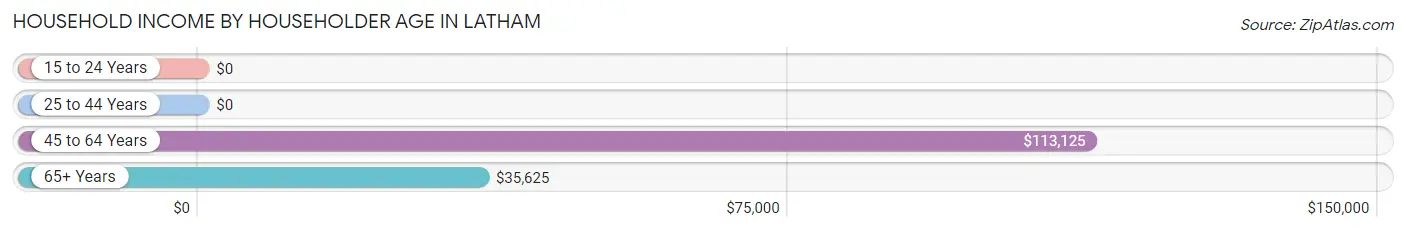
| Income Bracket | # Households | Median Income |
| 15 to 24 Years | 44 (22.8%) | $0 |
| 25 to 44 Years | 52 (26.9%) | $0 |
| 45 to 64 Years | 62 (32.1%) | $113,125 |
| 65+ Years | 35 (18.1%) | $35,625 |
| Total | 193 (100.0%) | $61,250 |
Poverty in Latham
Income Below Poverty by Sex and Age in Latham
With 5.6% poverty level for males and 12.1% for females among the residents of Latham, 12 to 14 year old males and 75 year old and over females are the most vulnerable to poverty, with 4 males (26.7%) and 3 females (27.3%) in their respective age groups living below the poverty level.
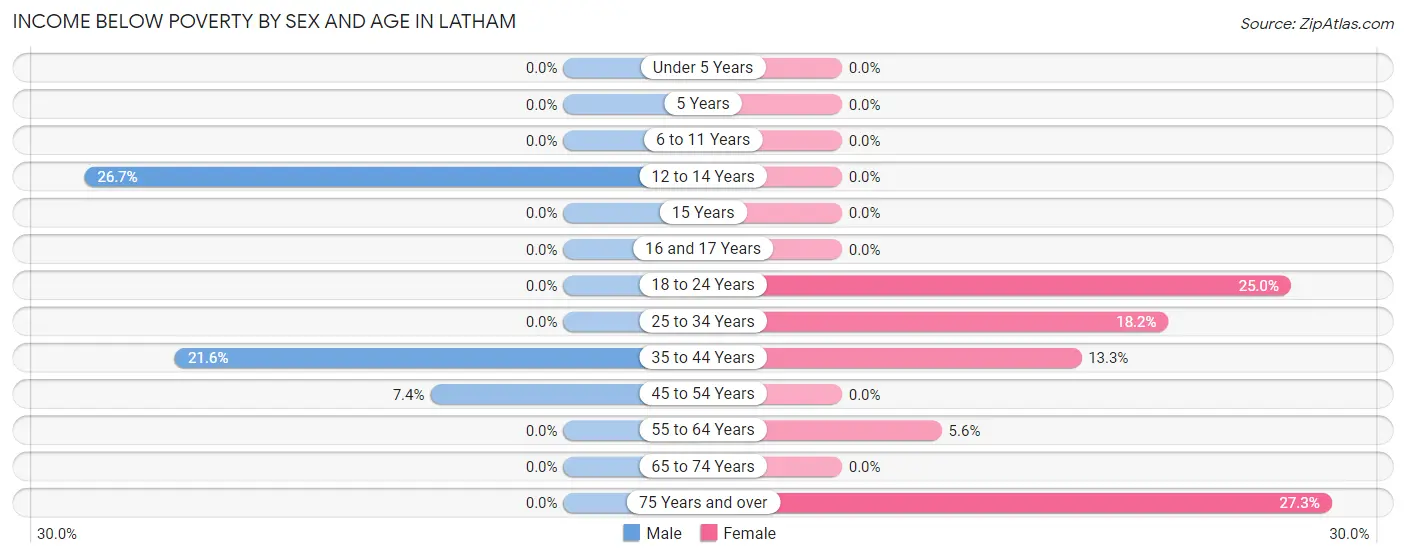
| Age Bracket | Male | Female |
| Under 5 Years | 0 (0.0%) | 0 (0.0%) |
| 5 Years | 0 (0.0%) | 0 (0.0%) |
| 6 to 11 Years | 0 (0.0%) | 0 (0.0%) |
| 12 to 14 Years | 4 (26.7%) | 0 (0.0%) |
| 15 Years | 0 (0.0%) | 0 (0.0%) |
| 16 and 17 Years | 0 (0.0%) | 0 (0.0%) |
| 18 to 24 Years | 0 (0.0%) | 16 (25.0%) |
| 25 to 34 Years | 0 (0.0%) | 2 (18.2%) |
| 35 to 44 Years | 8 (21.6%) | 2 (13.3%) |
| 45 to 54 Years | 2 (7.4%) | 0 (0.0%) |
| 55 to 64 Years | 0 (0.0%) | 1 (5.6%) |
| 65 to 74 Years | 0 (0.0%) | 0 (0.0%) |
| 75 Years and over | 0 (0.0%) | 3 (27.3%) |
| Total | 14 (5.6%) | 24 (12.1%) |
Income Above Poverty by Sex and Age in Latham
According to the poverty statistics in Latham, males aged under 5 years and females aged under 5 years are the age groups that are most secure financially, with 100.0% of males and 100.0% of females in these age groups living above the poverty line.
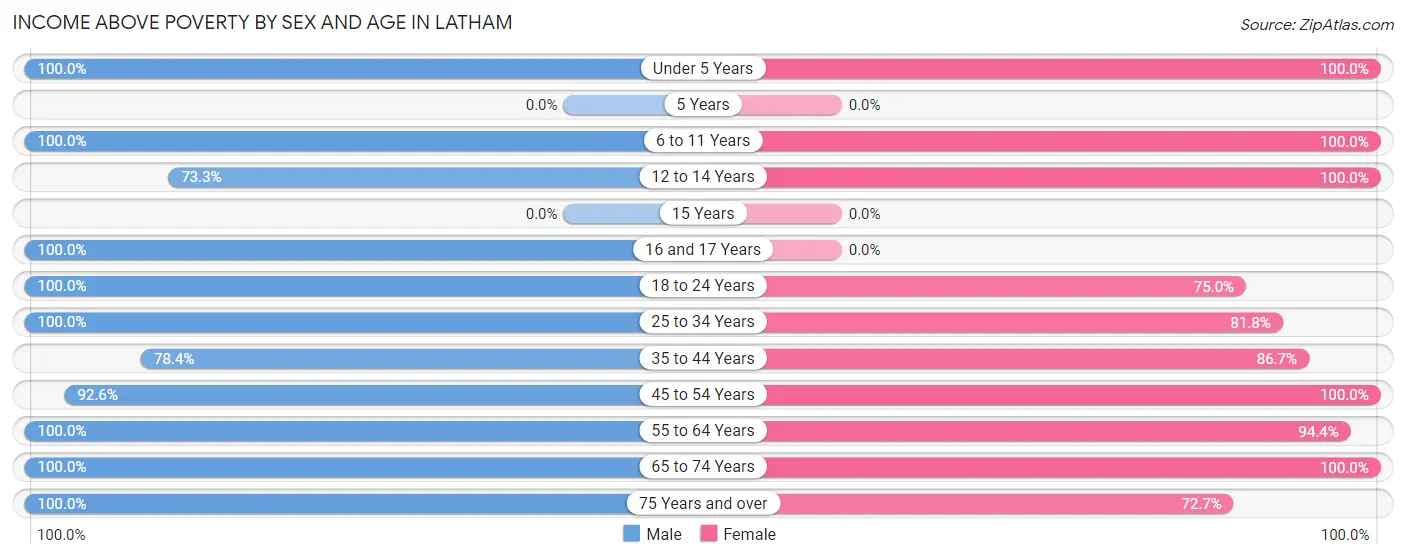
| Age Bracket | Male | Female |
| Under 5 Years | 13 (100.0%) | 3 (100.0%) |
| 5 Years | 0 (0.0%) | 0 (0.0%) |
| 6 to 11 Years | 12 (100.0%) | 5 (100.0%) |
| 12 to 14 Years | 11 (73.3%) | 12 (100.0%) |
| 15 Years | 0 (0.0%) | 0 (0.0%) |
| 16 and 17 Years | 11 (100.0%) | 0 (0.0%) |
| 18 to 24 Years | 65 (100.0%) | 48 (75.0%) |
| 25 to 34 Years | 15 (100.0%) | 9 (81.8%) |
| 35 to 44 Years | 29 (78.4%) | 13 (86.7%) |
| 45 to 54 Years | 25 (92.6%) | 36 (100.0%) |
| 55 to 64 Years | 26 (100.0%) | 17 (94.4%) |
| 65 to 74 Years | 22 (100.0%) | 23 (100.0%) |
| 75 Years and over | 9 (100.0%) | 8 (72.7%) |
| Total | 238 (94.4%) | 174 (87.9%) |
Income Below Poverty Among Married-Couple Families in Latham
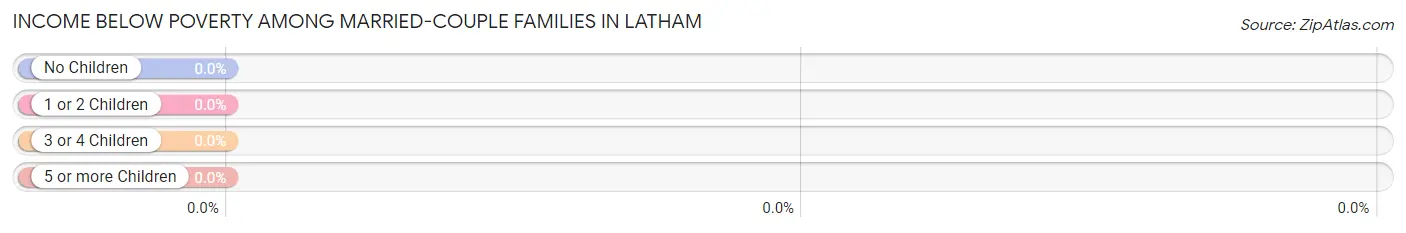
| Children | Above Poverty | Below Poverty |
| No Children | 58 (100.0%) | 0 (0.0%) |
| 1 or 2 Children | 18 (100.0%) | 0 (0.0%) |
| 3 or 4 Children | 5 (100.0%) | 0 (0.0%) |
| 5 or more Children | 0 (0.0%) | 0 (0.0%) |
| Total | 81 (100.0%) | 0 (0.0%) |
Income Below Poverty Among Single-Parent Households in Latham
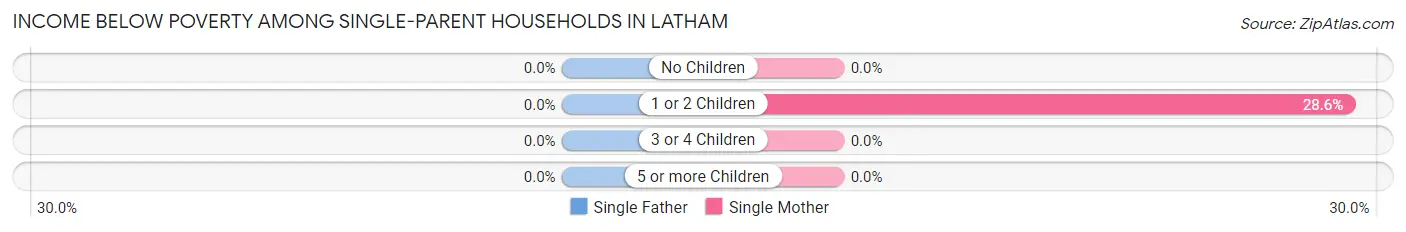
| Children | Single Father | Single Mother |
| No Children | 0 (0.0%) | 0 (0.0%) |
| 1 or 2 Children | 0 (0.0%) | 2 (28.6%) |
| 3 or 4 Children | 0 (0.0%) | 0 (0.0%) |
| 5 or more Children | 0 (0.0%) | 0 (0.0%) |
| Total | 0 (0.0%) | 2 (22.2%) |
Income Below Poverty Among Married-Couple vs Single-Parent Households in Latham
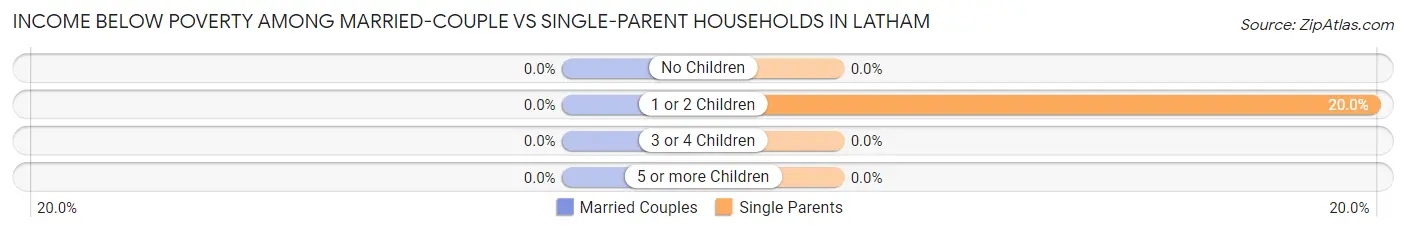
| Children | Married-Couple Families | Single-Parent Households |
| No Children | 0 (0.0%) | 0 (0.0%) |
| 1 or 2 Children | 0 (0.0%) | 2 (20.0%) |
| 3 or 4 Children | 0 (0.0%) | 0 (0.0%) |
| 5 or more Children | 0 (0.0%) | 0 (0.0%) |
| Total | 0 (0.0%) | 2 (16.7%) |
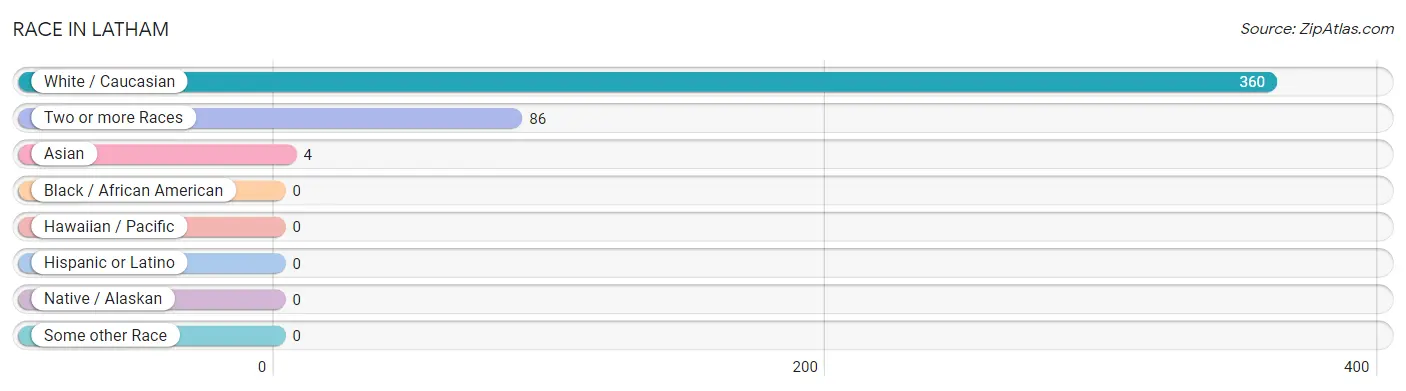
Race in Latham
The most populous races in Latham are White / Caucasian (360 | 80.0%), Two or more Races (86 | 19.1%), and Asian (4 | 0.9%).
| Race | # Population | % Population |
| Asian | 4 | 0.9% |
| Black / African American | 0 | 0.0% |
| Hawaiian / Pacific | 0 | 0.0% |
| Hispanic or Latino | 0 | 0.0% |
| Native / Alaskan | 0 | 0.0% |
| White / Caucasian | 360 | 80.0% |
| Two or more Races | 86 | 19.1% |
| Some other Race | 0 | 0.0% |
| Total | 450 | 100.0% |
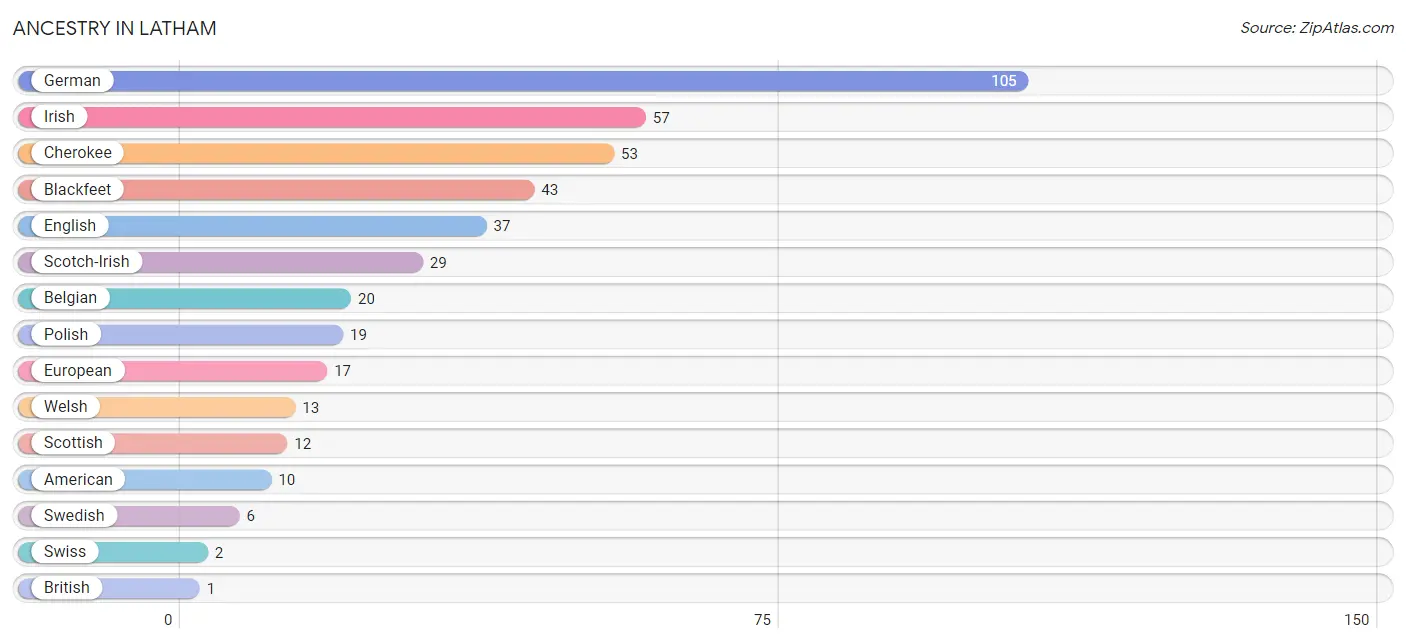
Ancestry in Latham
The most populous ancestries reported in Latham are German (105 | 23.3%), Irish (57 | 12.7%), Cherokee (53 | 11.8%), Blackfeet (43 | 9.6%), and English (37 | 8.2%), together accounting for 65.6% of all Latham residents.
| Ancestry | # Population | % Population |
| American | 10 | 2.2% |
| Belgian | 20 | 4.4% |
| Blackfeet | 43 | 9.6% |
| British | 1 | 0.2% |
| Cherokee | 53 | 11.8% |
| Czechoslovakian | 1 | 0.2% |
| Danish | 1 | 0.2% |
| English | 37 | 8.2% |
| European | 17 | 3.8% |
| French | 1 | 0.2% |
| German | 105 | 23.3% |
| Irish | 57 | 12.7% |
| Polish | 19 | 4.2% |
| Scandinavian | 1 | 0.2% |
| Scotch-Irish | 29 | 6.4% |
| Scottish | 12 | 2.7% |
| Swedish | 6 | 1.3% |
| Swiss | 2 | 0.4% |
| Welsh | 13 | 2.9% | View All 19 Rows |
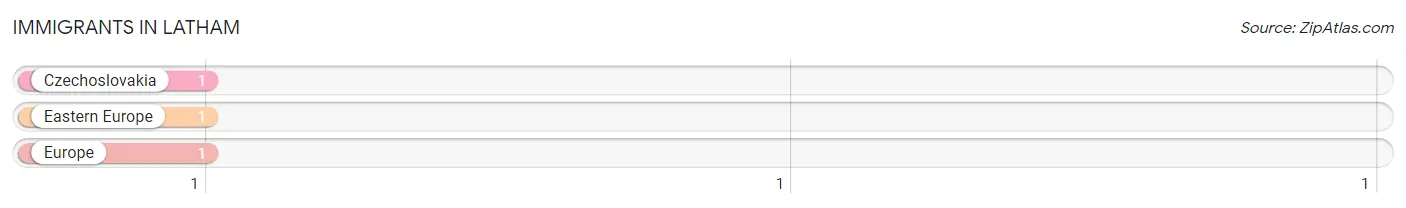
Immigrants in Latham
The most numerous immigrant groups reported in Latham came from Czechoslovakia (1 | 0.2%), Eastern Europe (1 | 0.2%), and Europe (1 | 0.2%), together accounting for 0.7% of all Latham residents.
| Immigration Origin | # Population | % Population |
| Czechoslovakia | 1 | 0.2% |
| Eastern Europe | 1 | 0.2% |
| Europe | 1 | 0.2% | View All 3 Rows |
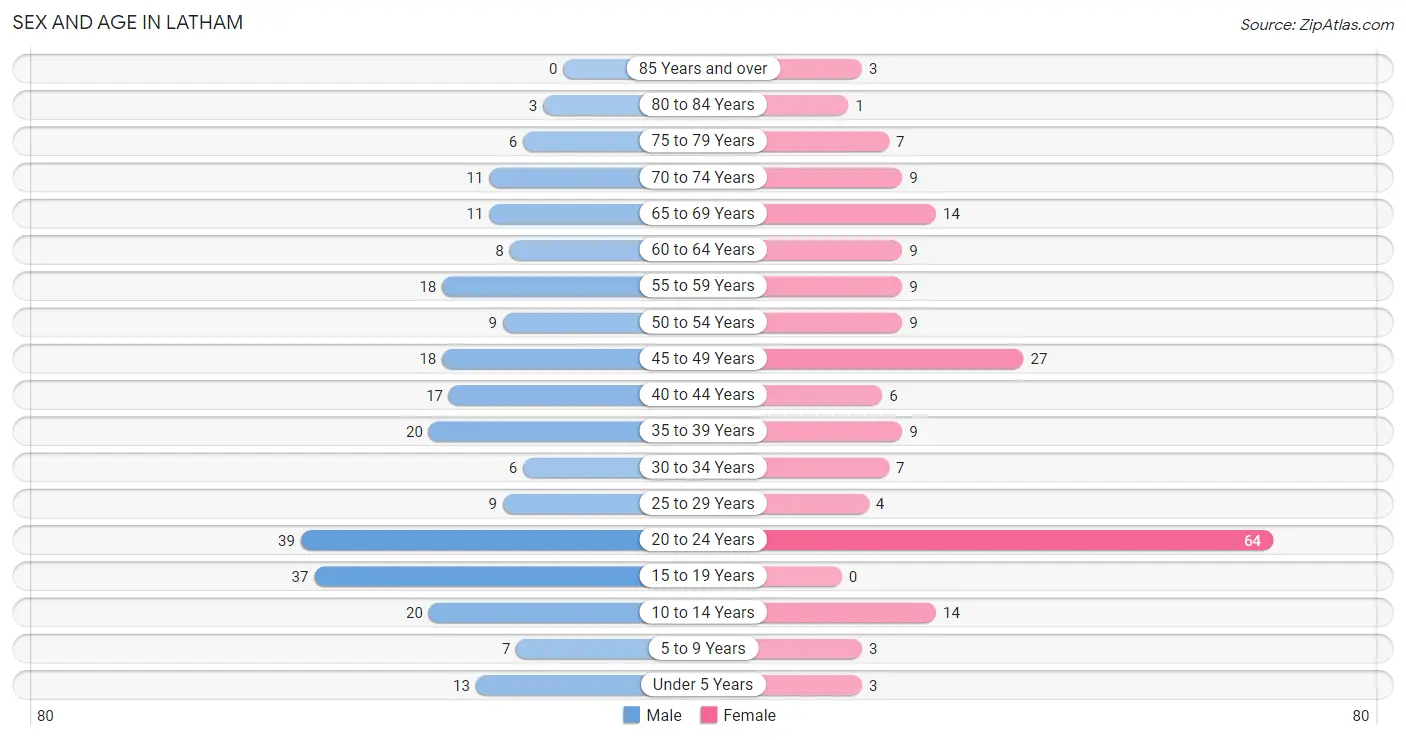
Sex and Age in Latham
Sex and Age in Latham
The most populous age groups in Latham are 20 to 24 Years (39 | 15.5%) for men and 20 to 24 Years (64 | 32.3%) for women.
| Age Bracket | Male | Female |
| Under 5 Years | 13 (5.2%) | 3 (1.5%) |
| 5 to 9 Years | 7 (2.8%) | 3 (1.5%) |
| 10 to 14 Years | 20 (7.9%) | 14 (7.1%) |
| 15 to 19 Years | 37 (14.7%) | 0 (0.0%) |
| 20 to 24 Years | 39 (15.5%) | 64 (32.3%) |
| 25 to 29 Years | 9 (3.6%) | 4 (2.0%) |
| 30 to 34 Years | 6 (2.4%) | 7 (3.5%) |
| 35 to 39 Years | 20 (7.9%) | 9 (4.5%) |
| 40 to 44 Years | 17 (6.8%) | 6 (3.0%) |
| 45 to 49 Years | 18 (7.1%) | 27 (13.6%) |
| 50 to 54 Years | 9 (3.6%) | 9 (4.5%) |
| 55 to 59 Years | 18 (7.1%) | 9 (4.5%) |
| 60 to 64 Years | 8 (3.2%) | 9 (4.5%) |
| 65 to 69 Years | 11 (4.4%) | 14 (7.1%) |
| 70 to 74 Years | 11 (4.4%) | 9 (4.5%) |
| 75 to 79 Years | 6 (2.4%) | 7 (3.5%) |
| 80 to 84 Years | 3 (1.2%) | 1 (0.5%) |
| 85 Years and over | 0 (0.0%) | 3 (1.5%) |
| Total | 252 (100.0%) | 198 (100.0%) |
Families and Households in Latham
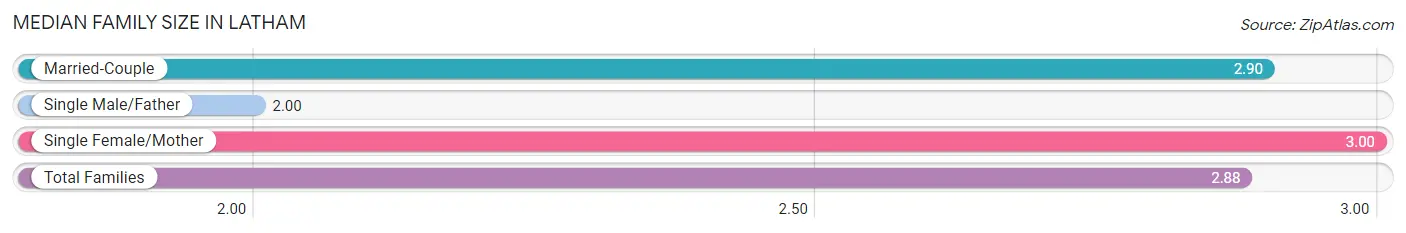
Median Family Size in Latham
The median family size in Latham is 2.88 persons per family, with single female/mother families (9 | 9.7%) accounting for the largest median family size of 3 persons per family. On the other hand, single male/father families (3 | 3.2%) represent the smallest median family size with 2.00 persons per family.
| Family Type | # Families | Family Size |
| Married-Couple | 81 (87.1%) | 2.90 |
| Single Male/Father | 3 (3.2%) | 2.00 |
| Single Female/Mother | 9 (9.7%) | 3.00 |
| Total Families | 93 (100.0%) | 2.88 |
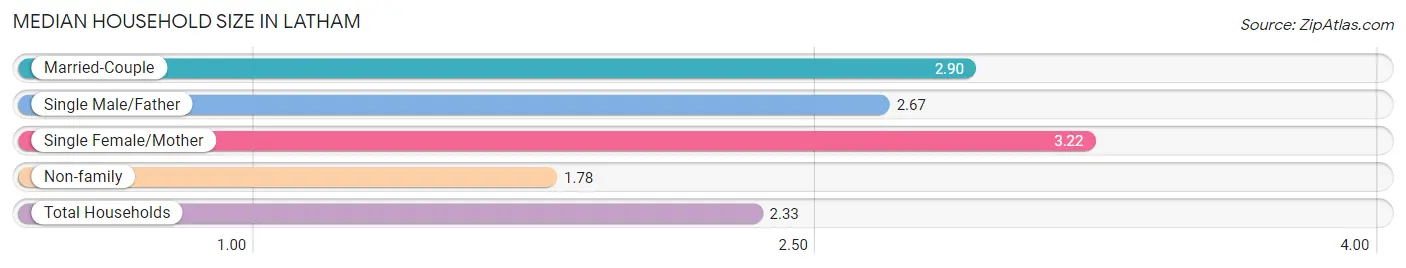
Median Household Size in Latham
The median household size in Latham is 2.33 persons per household, with single female/mother households (9 | 4.7%) accounting for the largest median household size of 3.22 persons per household. non-family households (100 | 51.8%) represent the smallest median household size with 1.78 persons per household.
| Household Type | # Households | Household Size |
| Married-Couple | 81 (42.0%) | 2.90 |
| Single Male/Father | 3 (1.5%) | 2.67 |
| Single Female/Mother | 9 (4.7%) | 3.22 |
| Non-family | 100 (51.8%) | 1.78 |
| Total Households | 193 (100.0%) | 2.33 |
Household Size by Marriage Status in Latham
Out of a total of 193 households in Latham, 93 (48.2%) are family households, while 100 (51.8%) are nonfamily households. The most numerous type of family households are 2-person households, comprising 46, and the most common type of nonfamily households are 1-person households, comprising 45.
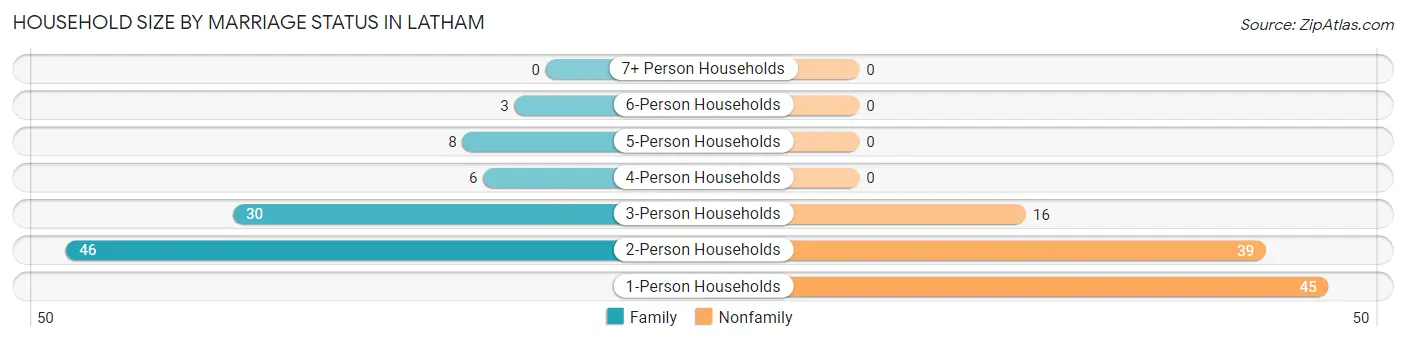
| Household Size | Family Households | Nonfamily Households |
| 1-Person Households | - | 45 (23.3%) |
| 2-Person Households | 46 (23.8%) | 39 (20.2%) |
| 3-Person Households | 30 (15.5%) | 16 (8.3%) |
| 4-Person Households | 6 (3.1%) | 0 (0.0%) |
| 5-Person Households | 8 (4.2%) | 0 (0.0%) |
| 6-Person Households | 3 (1.5%) | 0 (0.0%) |
| 7+ Person Households | 0 (0.0%) | 0 (0.0%) |
| Total | 93 (48.2%) | 100 (51.8%) |
Female Fertility in Latham
Fertility by Age in Latham
Average fertility rate in Latham is 42.0 births per 1,000 women. Women in the age bracket of 20 to 34 years have the highest fertility rate with 67.0 births per 1,000 women. Women in the age bracket of 20 to 34 years acount for 100.0% of all women with births.
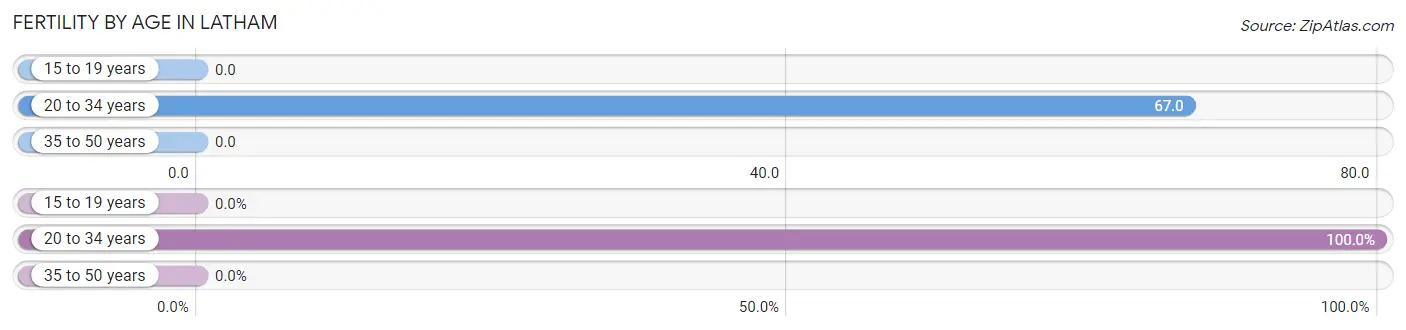
| Age Bracket | Women with Births | Births / 1,000 Women |
| 15 to 19 years | 0 (0.0%) | 0.0 |
| 20 to 34 years | 5 (100.0%) | 67.0 |
| 35 to 50 years | 0 (0.0%) | 0.0 |
| Total | 5 (100.0%) | 42.0 |
Fertility by Age by Marriage Status in Latham
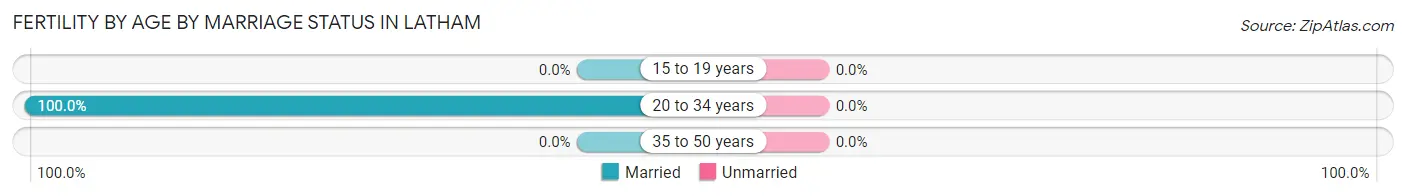
| Age Bracket | Married | Unmarried |
| 15 to 19 years | 0 (0.0%) | 0 (0.0%) |
| 20 to 34 years | 5 (100.0%) | 0 (0.0%) |
| 35 to 50 years | 0 (0.0%) | 0 (0.0%) |
| Total | 5 (100.0%) | 0 (0.0%) |
Fertility by Education in Latham
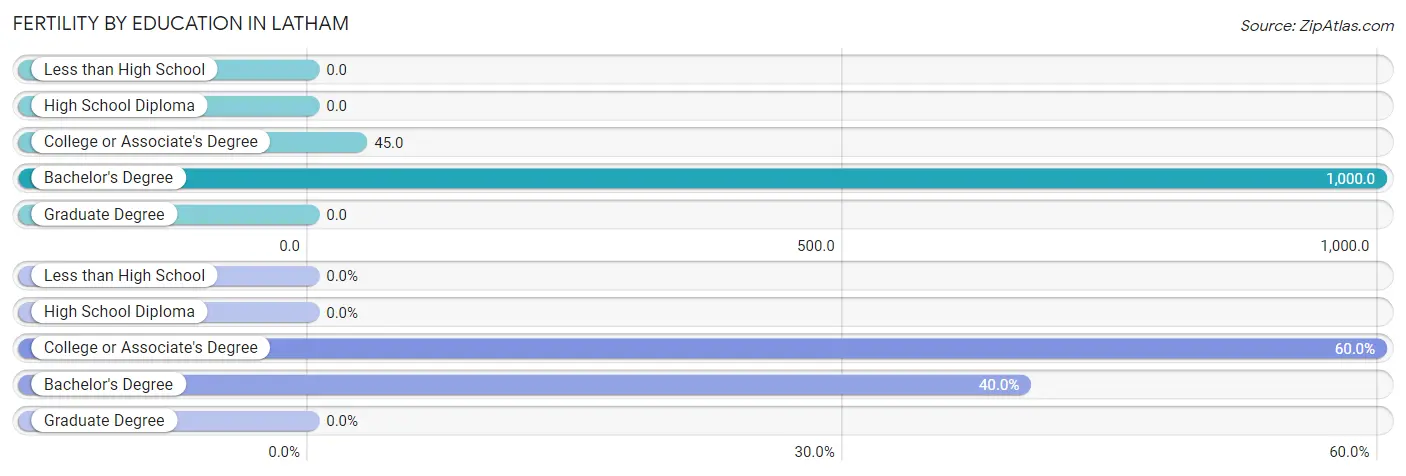
| Educational Attainment | Women with Births | Births / 1,000 Women |
| Less than High School | 0 (0.0%) | 0.0 |
| High School Diploma | 0 (0.0%) | 0.0 |
| College or Associate's Degree | 3 (60.0%) | 45.0 |
| Bachelor's Degree | 2 (40.0%) | 1,000.0 |
| Graduate Degree | 0 (0.0%) | 0.0 |
| Total | 5 (100.0%) | 42.0 |
Fertility by Education by Marriage Status in Latham
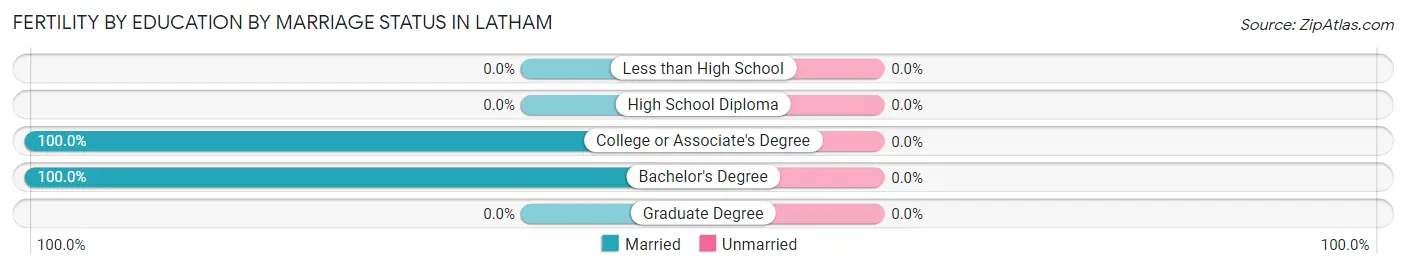
| Educational Attainment | Married | Unmarried |
| Less than High School | 0 (0.0%) | 0 (0.0%) |
| High School Diploma | 0 (0.0%) | 0 (0.0%) |
| College or Associate's Degree | 3 (100.0%) | 0 (0.0%) |
| Bachelor's Degree | 2 (100.0%) | 0 (0.0%) |
| Graduate Degree | 0 (0.0%) | 0 (0.0%) |
| Total | 5 (100.0%) | 0 (0.0%) |
Employment Characteristics in Latham
Employment by Class of Employer in Latham
Among the 252 employed individuals in Latham, private company employees (180 | 71.4%), local government employees (30 | 11.9%), and federal government employees (17 | 6.8%) make up the most common classes of employment.
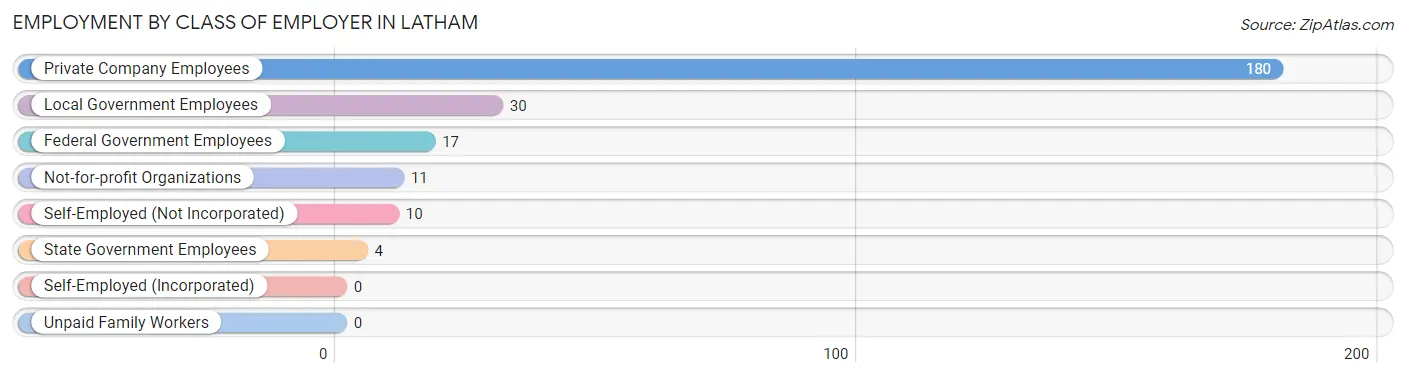
| Employer Class | # Employees | % Employees |
| Private Company Employees | 180 | 71.4% |
| Self-Employed (Incorporated) | 0 | 0.0% |
| Self-Employed (Not Incorporated) | 10 | 4.0% |
| Not-for-profit Organizations | 11 | 4.4% |
| Local Government Employees | 30 | 11.9% |
| State Government Employees | 4 | 1.6% |
| Federal Government Employees | 17 | 6.8% |
| Unpaid Family Workers | 0 | 0.0% |
| Total | 252 | 100.0% |
Employment Status by Age in Latham
According to the labor force statistics for Latham, out of the total population over 16 years of age (390), 68.7% or 268 individuals are in the labor force, with 4.7% or 13 of them unemployed. The age group with the highest labor force participation rate is 25 to 29 years, with 100.0% or 13 individuals in the labor force. Within the labor force, the 25 to 29 years age range has the highest percentage of unemployed individuals, with 46.2% or 6 of them being unemployed.
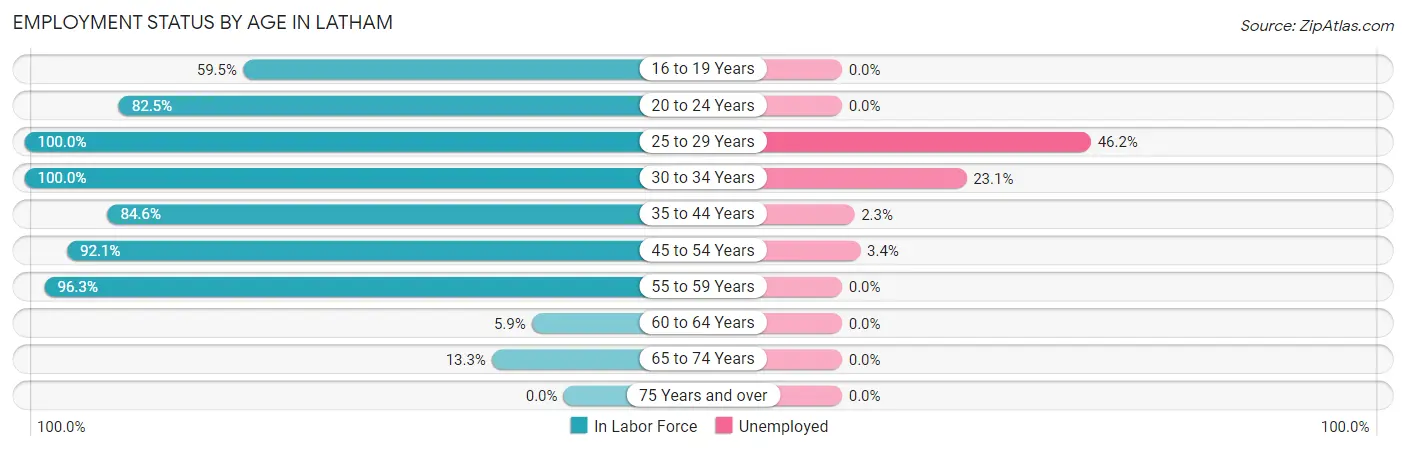
| Age Bracket | In Labor Force | Unemployed |
| 16 to 19 Years | 22 (59.5%) | 0 (0.0%) |
| 20 to 24 Years | 85 (82.5%) | 0 (0.0%) |
| 25 to 29 Years | 13 (100.0%) | 6 (46.2%) |
| 30 to 34 Years | 13 (100.0%) | 3 (23.1%) |
| 35 to 44 Years | 44 (84.6%) | 1 (2.3%) |
| 45 to 54 Years | 58 (92.1%) | 2 (3.4%) |
| 55 to 59 Years | 26 (96.3%) | 0 (0.0%) |
| 60 to 64 Years | 1 (5.9%) | 0 (0.0%) |
| 65 to 74 Years | 6 (13.3%) | 0 (0.0%) |
| 75 Years and over | 0 (0.0%) | 0 (0.0%) |
| Total | 268 (68.7%) | 13 (4.7%) |
Employment Status by Educational Attainment in Latham
According to labor force statistics for Latham, 83.8% of individuals (155) out of the total population between 25 and 64 years of age (185) are in the labor force, with 7.7% or 12 of them being unemployed. The group with the highest labor force participation rate are those with the educational attainment of college / associate degree, with 92.0% or 80 individuals in the labor force. Within the labor force, individuals with high school diploma education have the highest percentage of unemployment, with 17.6% or 6 of them being unemployed.
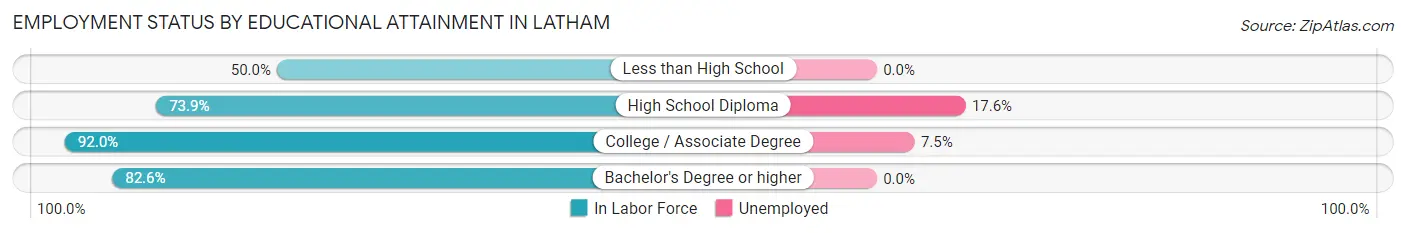
| Educational Attainment | In Labor Force | Unemployed |
| Less than High School | 3 (50.0%) | 0 (0.0%) |
| High School Diploma | 34 (73.9%) | 8 (17.6%) |
| College / Associate Degree | 80 (92.0%) | 7 (7.5%) |
| Bachelor's Degree or higher | 38 (82.6%) | 0 (0.0%) |
| Total | 155 (83.8%) | 14 (7.7%) |
Employment Occupations by Sex in Latham
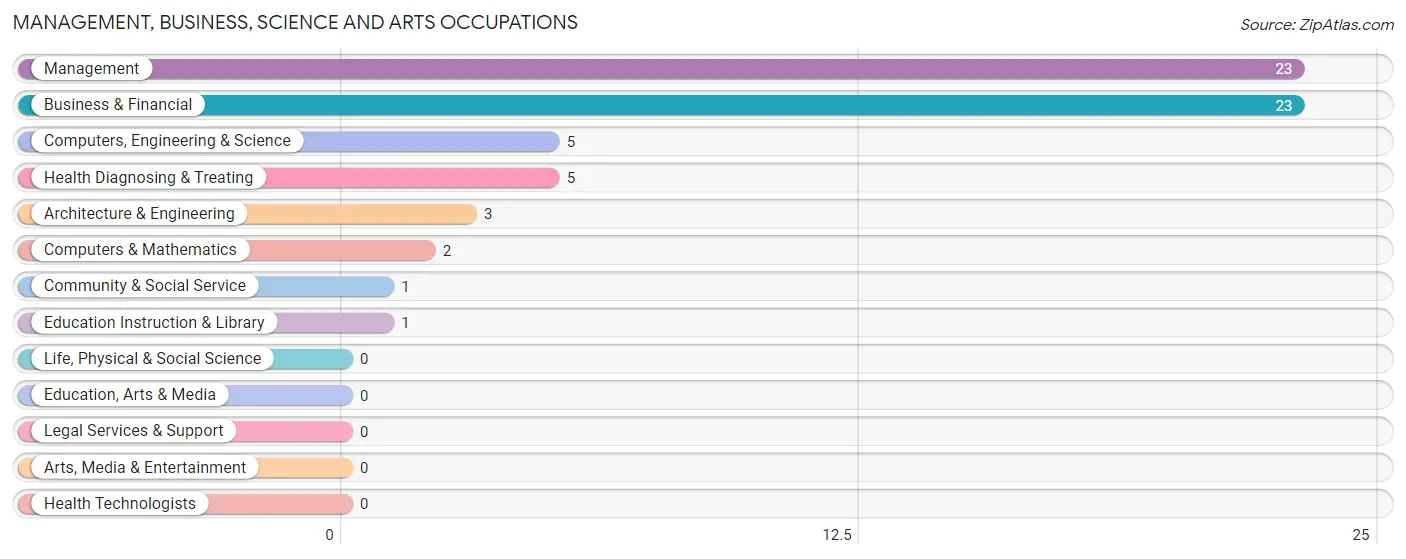
Management, Business, Science and Arts Occupations
The most common Management, Business, Science and Arts occupations in Latham are Management (23 | 9.3%), Business & Financial (23 | 9.3%), Computers, Engineering & Science (5 | 2.0%), Health Diagnosing & Treating (5 | 2.0%), and Architecture & Engineering (3 | 1.2%).
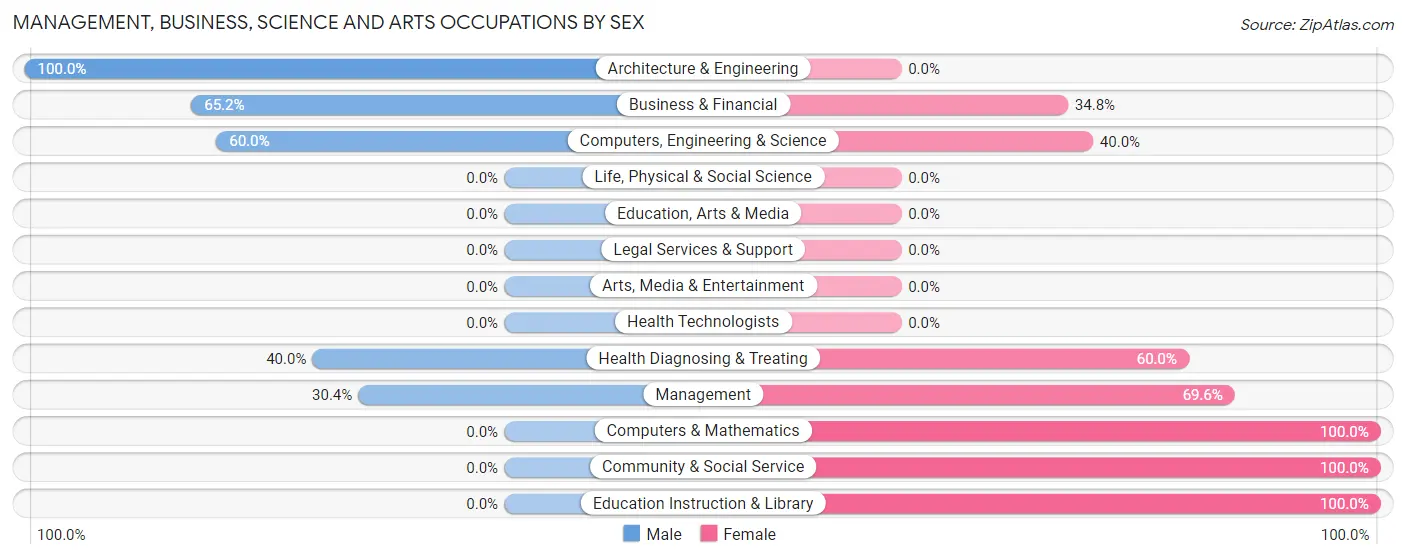
Management, Business, Science and Arts Occupations by Sex
Within the Management, Business, Science and Arts occupations in Latham, the most male-oriented occupations are Architecture & Engineering (100.0%), Business & Financial (65.2%), and Computers, Engineering & Science (60.0%), while the most female-oriented occupations are Computers & Mathematics (100.0%), Community & Social Service (100.0%), and Education Instruction & Library (100.0%).
| Occupation | Male | Female |
| Management | 7 (30.4%) | 16 (69.6%) |
| Business & Financial | 15 (65.2%) | 8 (34.8%) |
| Computers, Engineering & Science | 3 (60.0%) | 2 (40.0%) |
| Computers & Mathematics | 0 (0.0%) | 2 (100.0%) |
| Architecture & Engineering | 3 (100.0%) | 0 (0.0%) |
| Life, Physical & Social Science | 0 (0.0%) | 0 (0.0%) |
| Community & Social Service | 0 (0.0%) | 1 (100.0%) |
| Education, Arts & Media | 0 (0.0%) | 0 (0.0%) |
| Legal Services & Support | 0 (0.0%) | 0 (0.0%) |
| Education Instruction & Library | 0 (0.0%) | 1 (100.0%) |
| Arts, Media & Entertainment | 0 (0.0%) | 0 (0.0%) |
| Health Diagnosing & Treating | 2 (40.0%) | 3 (60.0%) |
| Health Technologists | 0 (0.0%) | 0 (0.0%) |
| Total (Category) | 27 (47.4%) | 30 (52.6%) |
| Total (Overall) | 132 (53.7%) | 114 (46.3%) |
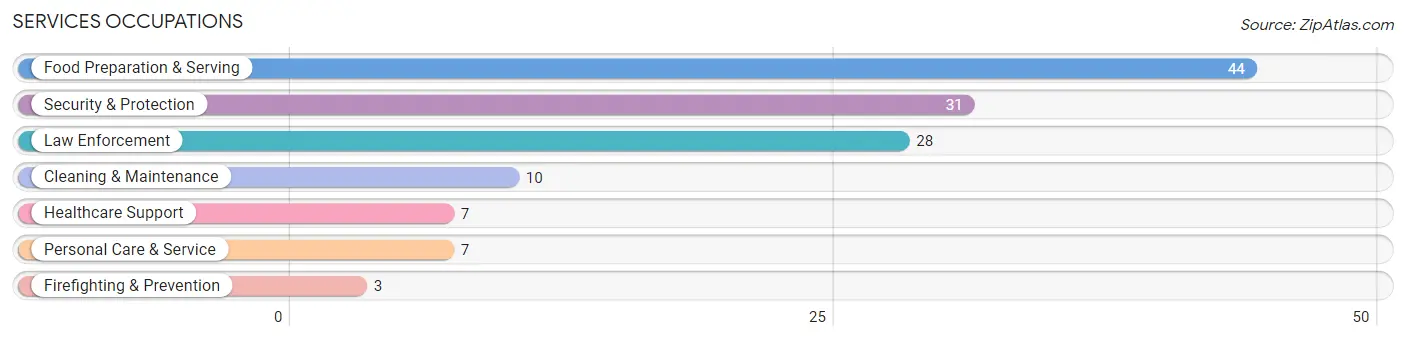
Services Occupations
The most common Services occupations in Latham are Food Preparation & Serving (44 | 17.9%), Security & Protection (31 | 12.6%), Law Enforcement (28 | 11.4%), Cleaning & Maintenance (10 | 4.1%), and Healthcare Support (7 | 2.9%).
Services Occupations by Sex
Within the Services occupations in Latham, the most male-oriented occupations are Firefighting & Prevention (100.0%), Security & Protection (87.1%), and Law Enforcement (85.7%), while the most female-oriented occupations are Healthcare Support (100.0%), Food Preparation & Serving (100.0%), and Personal Care & Service (100.0%).

| Occupation | Male | Female |
| Healthcare Support | 0 (0.0%) | 7 (100.0%) |
| Security & Protection | 27 (87.1%) | 4 (12.9%) |
| Firefighting & Prevention | 3 (100.0%) | 0 (0.0%) |
| Law Enforcement | 24 (85.7%) | 4 (14.3%) |
| Food Preparation & Serving | 0 (0.0%) | 44 (100.0%) |
| Cleaning & Maintenance | 4 (40.0%) | 6 (60.0%) |
| Personal Care & Service | 0 (0.0%) | 7 (100.0%) |
| Total (Category) | 31 (31.3%) | 68 (68.7%) |
| Total (Overall) | 132 (53.7%) | 114 (46.3%) |
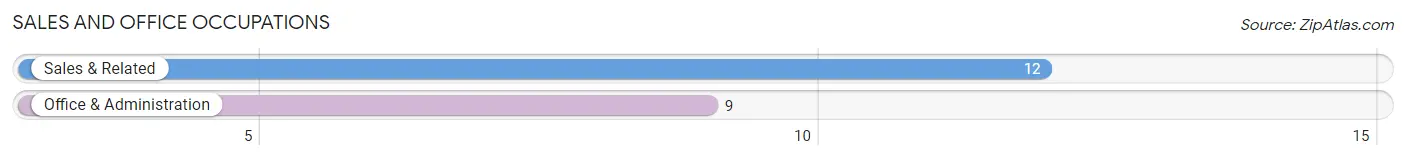
Sales and Office Occupations
The most common Sales and Office occupations in Latham are Sales & Related (12 | 4.9%), and Office & Administration (9 | 3.7%).
Sales and Office Occupations by Sex
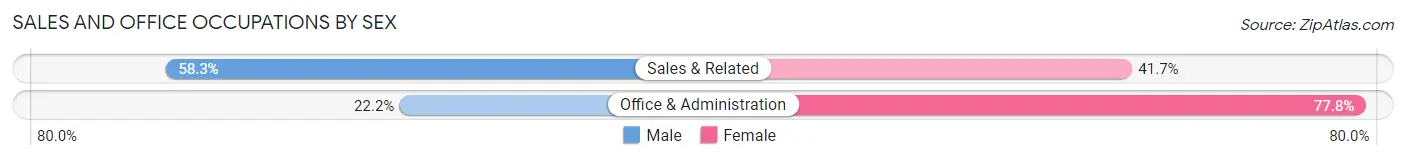
| Occupation | Male | Female |
| Sales & Related | 7 (58.3%) | 5 (41.7%) |
| Office & Administration | 2 (22.2%) | 7 (77.8%) |
| Total (Category) | 9 (42.9%) | 12 (57.1%) |
| Total (Overall) | 132 (53.7%) | 114 (46.3%) |
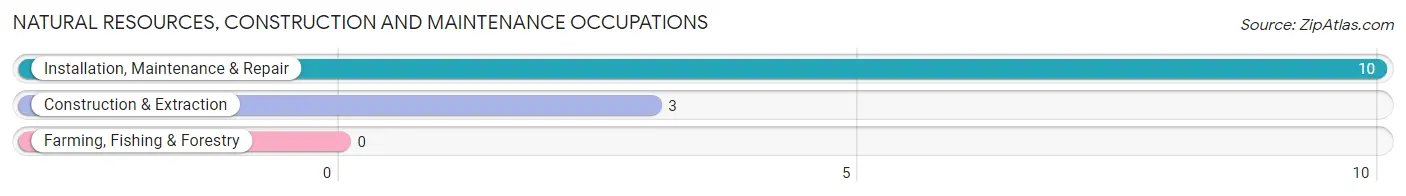
Natural Resources, Construction and Maintenance Occupations
The most common Natural Resources, Construction and Maintenance occupations in Latham are Installation, Maintenance & Repair (10 | 4.1%), and Construction & Extraction (3 | 1.2%).
Natural Resources, Construction and Maintenance Occupations by Sex
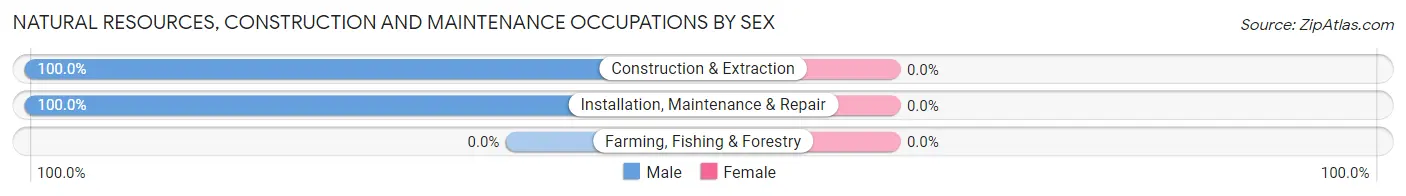
| Occupation | Male | Female |
| Farming, Fishing & Forestry | 0 (0.0%) | 0 (0.0%) |
| Construction & Extraction | 3 (100.0%) | 0 (0.0%) |
| Installation, Maintenance & Repair | 10 (100.0%) | 0 (0.0%) |
| Total (Category) | 13 (100.0%) | 0 (0.0%) |
| Total (Overall) | 132 (53.7%) | 114 (46.3%) |
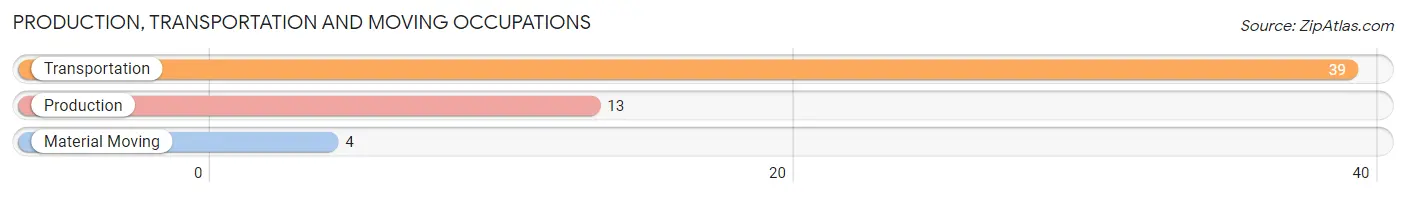
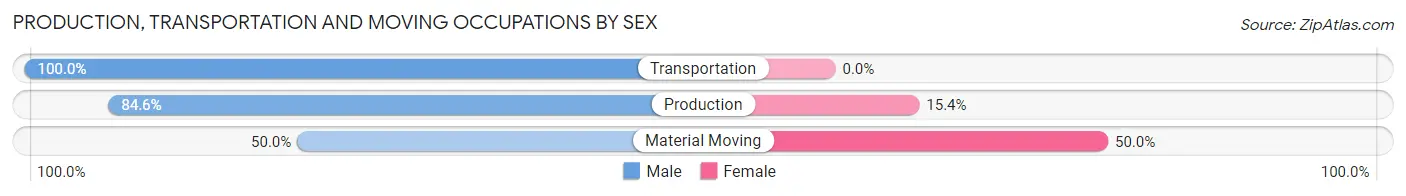
Production, Transportation and Moving Occupations
The most common Production, Transportation and Moving occupations in Latham are Transportation (39 | 15.9%), Production (13 | 5.3%), and Material Moving (4 | 1.6%).
Production, Transportation and Moving Occupations by Sex
| Occupation | Male | Female |
| Production | 11 (84.6%) | 2 (15.4%) |
| Transportation | 39 (100.0%) | 0 (0.0%) |
| Material Moving | 2 (50.0%) | 2 (50.0%) |
| Total (Category) | 52 (92.9%) | 4 (7.1%) |
| Total (Overall) | 132 (53.7%) | 114 (46.3%) |
Employment Industries by Sex in Latham
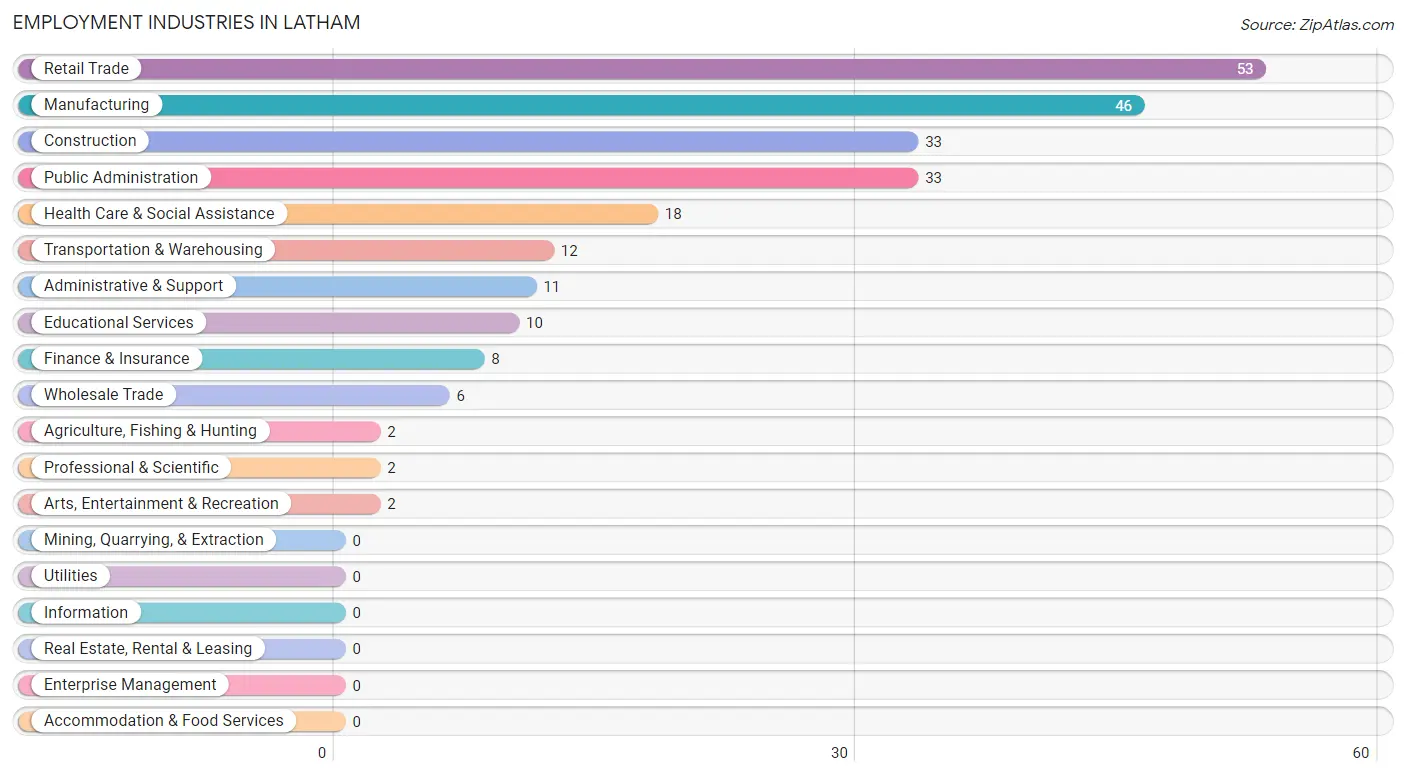
Employment Industries in Latham
The major employment industries in Latham include Retail Trade (53 | 21.5%), Manufacturing (46 | 18.7%), Construction (33 | 13.4%), Public Administration (33 | 13.4%), and Health Care & Social Assistance (18 | 7.3%).
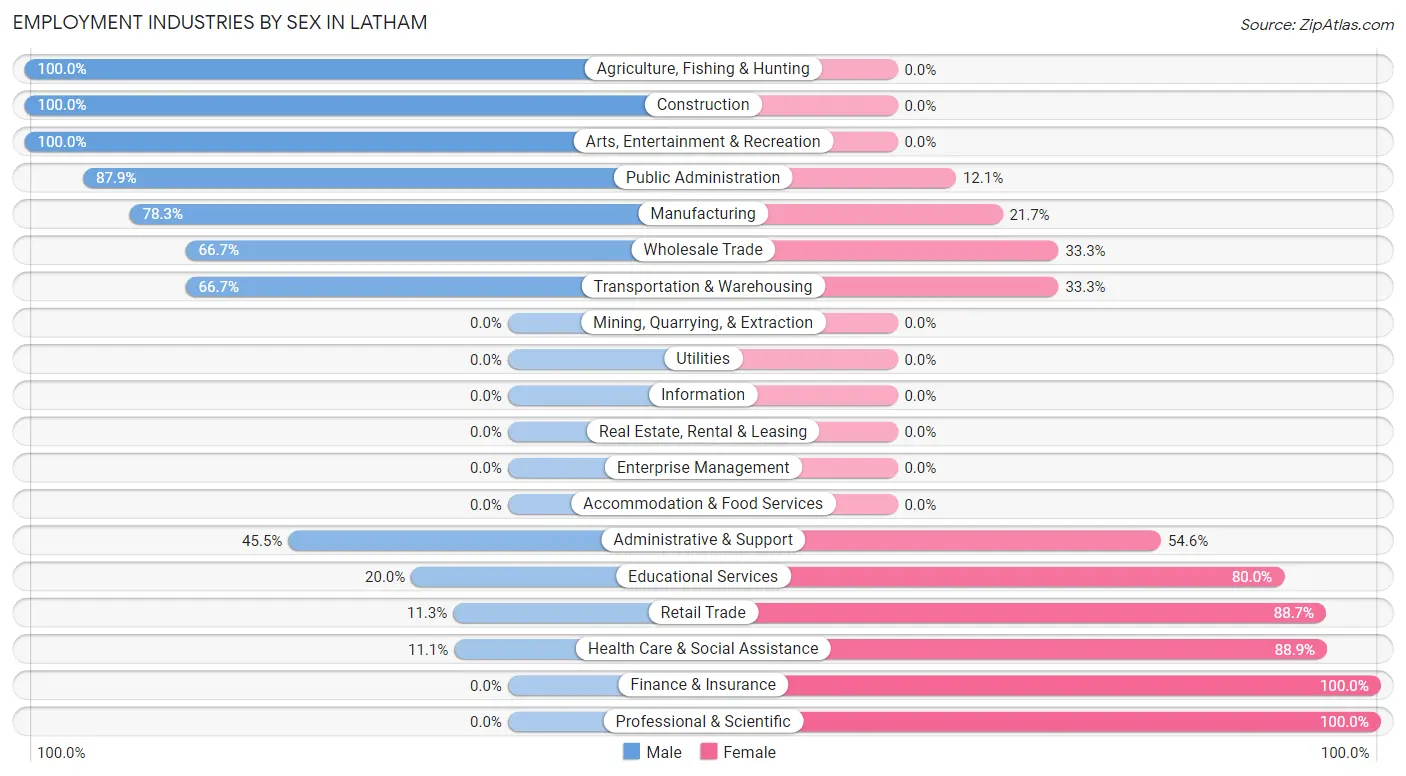
Employment Industries by Sex in Latham
The Latham industries that see more men than women are Agriculture, Fishing & Hunting (100.0%), Construction (100.0%), and Arts, Entertainment & Recreation (100.0%), whereas the industries that tend to have a higher number of women are Finance & Insurance (100.0%), Professional & Scientific (100.0%), and Health Care & Social Assistance (88.9%).
| Industry | Male | Female |
| Agriculture, Fishing & Hunting | 2 (100.0%) | 0 (0.0%) |
| Mining, Quarrying, & Extraction | 0 (0.0%) | 0 (0.0%) |
| Construction | 33 (100.0%) | 0 (0.0%) |
| Manufacturing | 36 (78.3%) | 10 (21.7%) |
| Wholesale Trade | 4 (66.7%) | 2 (33.3%) |
| Retail Trade | 6 (11.3%) | 47 (88.7%) |
| Transportation & Warehousing | 8 (66.7%) | 4 (33.3%) |
| Utilities | 0 (0.0%) | 0 (0.0%) |
| Information | 0 (0.0%) | 0 (0.0%) |
| Finance & Insurance | 0 (0.0%) | 8 (100.0%) |
| Real Estate, Rental & Leasing | 0 (0.0%) | 0 (0.0%) |
| Professional & Scientific | 0 (0.0%) | 2 (100.0%) |
| Enterprise Management | 0 (0.0%) | 0 (0.0%) |
| Administrative & Support | 5 (45.5%) | 6 (54.5%) |
| Educational Services | 2 (20.0%) | 8 (80.0%) |
| Health Care & Social Assistance | 2 (11.1%) | 16 (88.9%) |
| Arts, Entertainment & Recreation | 2 (100.0%) | 0 (0.0%) |
| Accommodation & Food Services | 0 (0.0%) | 0 (0.0%) |
| Public Administration | 29 (87.9%) | 4 (12.1%) |
| Total | 132 (53.7%) | 114 (46.3%) |
Education in Latham
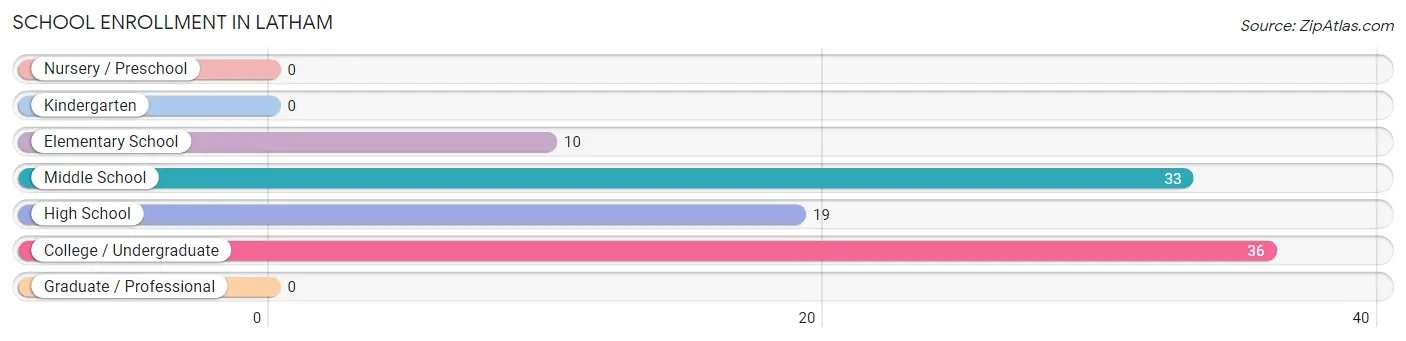
School Enrollment in Latham
The most common levels of schooling among the 98 students in Latham are college / undergraduate (36 | 36.7%), middle school (33 | 33.7%), and high school (19 | 19.4%).
| School Level | # Students | % Students |
| Nursery / Preschool | 0 | 0.0% |
| Kindergarten | 0 | 0.0% |
| Elementary School | 10 | 10.2% |
| Middle School | 33 | 33.7% |
| High School | 19 | 19.4% |
| College / Undergraduate | 36 | 36.7% |
| Graduate / Professional | 0 | 0.0% |
| Total | 98 | 100.0% |
School Enrollment by Age by Funding Source in Latham
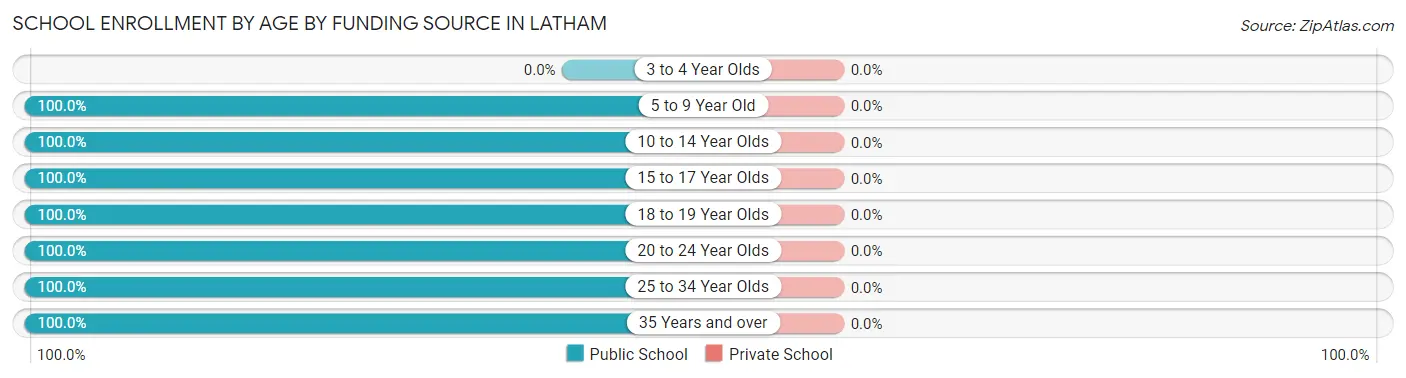
| Age Bracket | Public School | Private School |
| 3 to 4 Year Olds | 0 (0.0%) | 0 (0.0%) |
| 5 to 9 Year Old | 10 (100.0%) | 0 (0.0%) |
| 10 to 14 Year Olds | 34 (100.0%) | 0 (0.0%) |
| 15 to 17 Year Olds | 11 (100.0%) | 0 (0.0%) |
| 18 to 19 Year Olds | 11 (100.0%) | 0 (0.0%) |
| 20 to 24 Year Olds | 22 (100.0%) | 0 (0.0%) |
| 25 to 34 Year Olds | 8 (100.0%) | 0 (0.0%) |
| 35 Years and over | 2 (100.0%) | 0 (0.0%) |
| Total | 98 (100.0%) | 0 (0.0%) |
Educational Attainment by Field of Study in Latham
Psychology (26 | 53.1%), education (9 | 18.4%), business (8 | 16.3%), multidisciplinary studies (3 | 6.1%), and bio, nature & agricultural (2 | 4.1%) are the most common fields of study among 49 individuals in Latham who have obtained a bachelor's degree or higher.
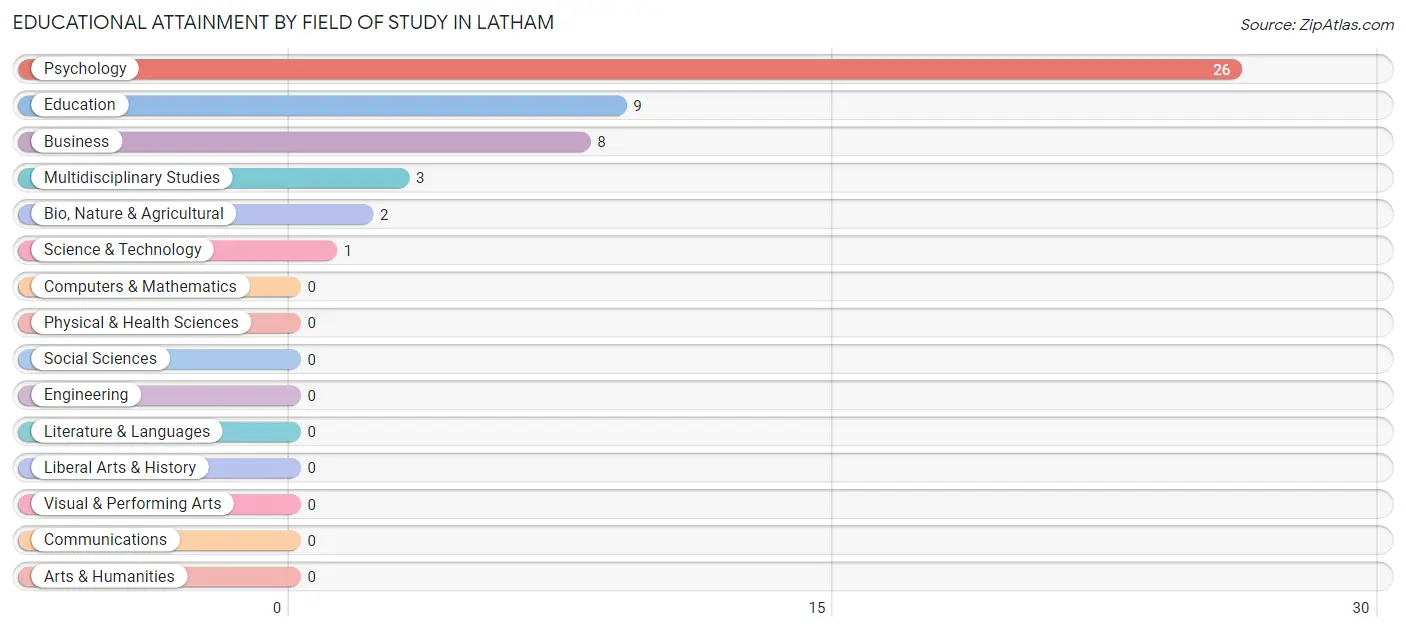
| Field of Study | # Graduates | % Graduates |
| Computers & Mathematics | 0 | 0.0% |
| Bio, Nature & Agricultural | 2 | 4.1% |
| Physical & Health Sciences | 0 | 0.0% |
| Psychology | 26 | 53.1% |
| Social Sciences | 0 | 0.0% |
| Engineering | 0 | 0.0% |
| Multidisciplinary Studies | 3 | 6.1% |
| Science & Technology | 1 | 2.0% |
| Business | 8 | 16.3% |
| Education | 9 | 18.4% |
| Literature & Languages | 0 | 0.0% |
| Liberal Arts & History | 0 | 0.0% |
| Visual & Performing Arts | 0 | 0.0% |
| Communications | 0 | 0.0% |
| Arts & Humanities | 0 | 0.0% |
| Total | 49 | 100.0% |
Transportation & Commute in Latham
Vehicle Availability by Sex in Latham
The most prevalent vehicle ownership categories in Latham are males with 2 vehicles (79, accounting for 56.4%) and females with 2 vehicles (62, making up 70.5%).
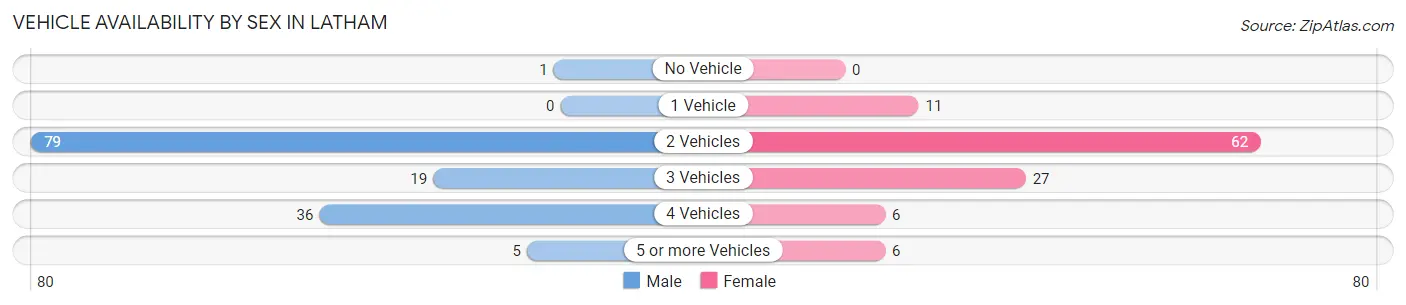
| Vehicles Available | Male | Female |
| No Vehicle | 1 (0.7%) | 0 (0.0%) |
| 1 Vehicle | 0 (0.0%) | 11 (9.8%) |
| 2 Vehicles | 79 (56.4%) | 62 (55.4%) |
| 3 Vehicles | 19 (13.6%) | 27 (24.1%) |
| 4 Vehicles | 36 (25.7%) | 6 (5.4%) |
| 5 or more Vehicles | 5 (3.6%) | 6 (5.4%) |
| Total | 140 (100.0%) | 112 (100.0%) |
Commute Time in Latham
The most frequently occuring commute durations in Latham are 25 to 29 minutes (76 commuters, 30.6%), 20 to 24 minutes (65 commuters, 26.2%), and 10 to 14 minutes (55 commuters, 22.2%).
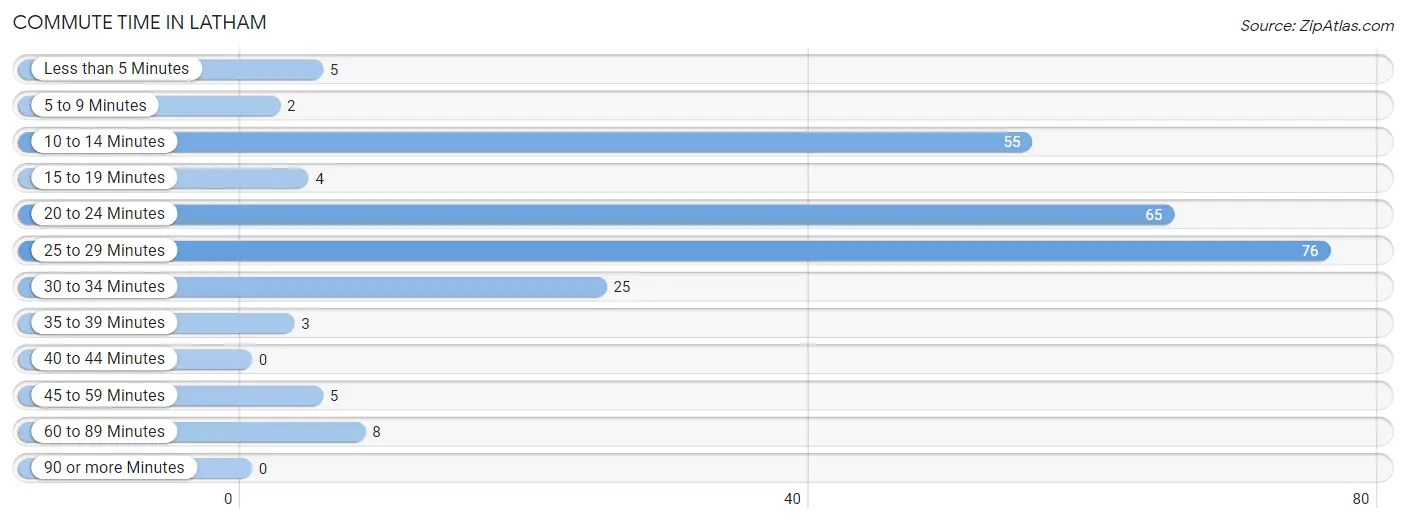
| Commute Time | # Commuters | % Commuters |
| Less than 5 Minutes | 5 | 2.0% |
| 5 to 9 Minutes | 2 | 0.8% |
| 10 to 14 Minutes | 55 | 22.2% |
| 15 to 19 Minutes | 4 | 1.6% |
| 20 to 24 Minutes | 65 | 26.2% |
| 25 to 29 Minutes | 76 | 30.6% |
| 30 to 34 Minutes | 25 | 10.1% |
| 35 to 39 Minutes | 3 | 1.2% |
| 40 to 44 Minutes | 0 | 0.0% |
| 45 to 59 Minutes | 5 | 2.0% |
| 60 to 89 Minutes | 8 | 3.2% |
| 90 or more Minutes | 0 | 0.0% |
Commute Time by Sex in Latham
The most common commute times in Latham are 20 to 24 minutes (58 commuters, 42.0%) for males and 10 to 14 minutes (50 commuters, 45.5%) for females.
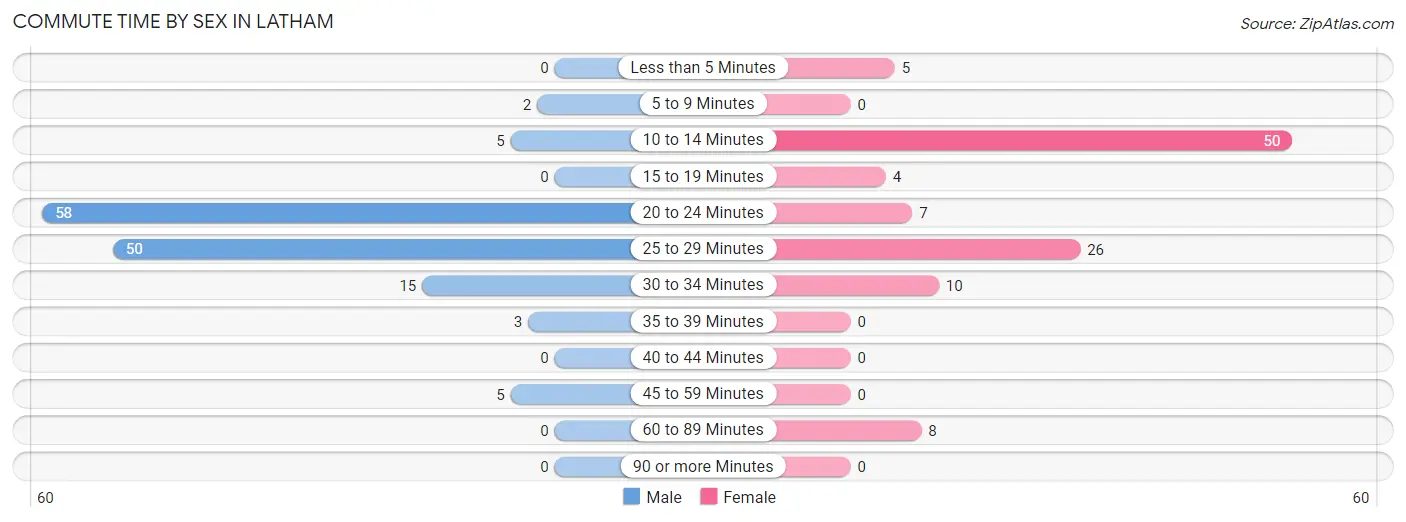
| Commute Time | Male | Female |
| Less than 5 Minutes | 0 (0.0%) | 5 (4.5%) |
| 5 to 9 Minutes | 2 (1.5%) | 0 (0.0%) |
| 10 to 14 Minutes | 5 (3.6%) | 50 (45.5%) |
| 15 to 19 Minutes | 0 (0.0%) | 4 (3.6%) |
| 20 to 24 Minutes | 58 (42.0%) | 7 (6.4%) |
| 25 to 29 Minutes | 50 (36.2%) | 26 (23.6%) |
| 30 to 34 Minutes | 15 (10.9%) | 10 (9.1%) |
| 35 to 39 Minutes | 3 (2.2%) | 0 (0.0%) |
| 40 to 44 Minutes | 0 (0.0%) | 0 (0.0%) |
| 45 to 59 Minutes | 5 (3.6%) | 0 (0.0%) |
| 60 to 89 Minutes | 0 (0.0%) | 8 (7.3%) |
| 90 or more Minutes | 0 (0.0%) | 0 (0.0%) |
Time of Departure to Work by Sex in Latham
The most frequent times of departure to work in Latham are 4:00 PM to 11:59 PM (33, 23.9%) for males and 12:00 PM to 3:59 PM (45, 40.9%) for females.
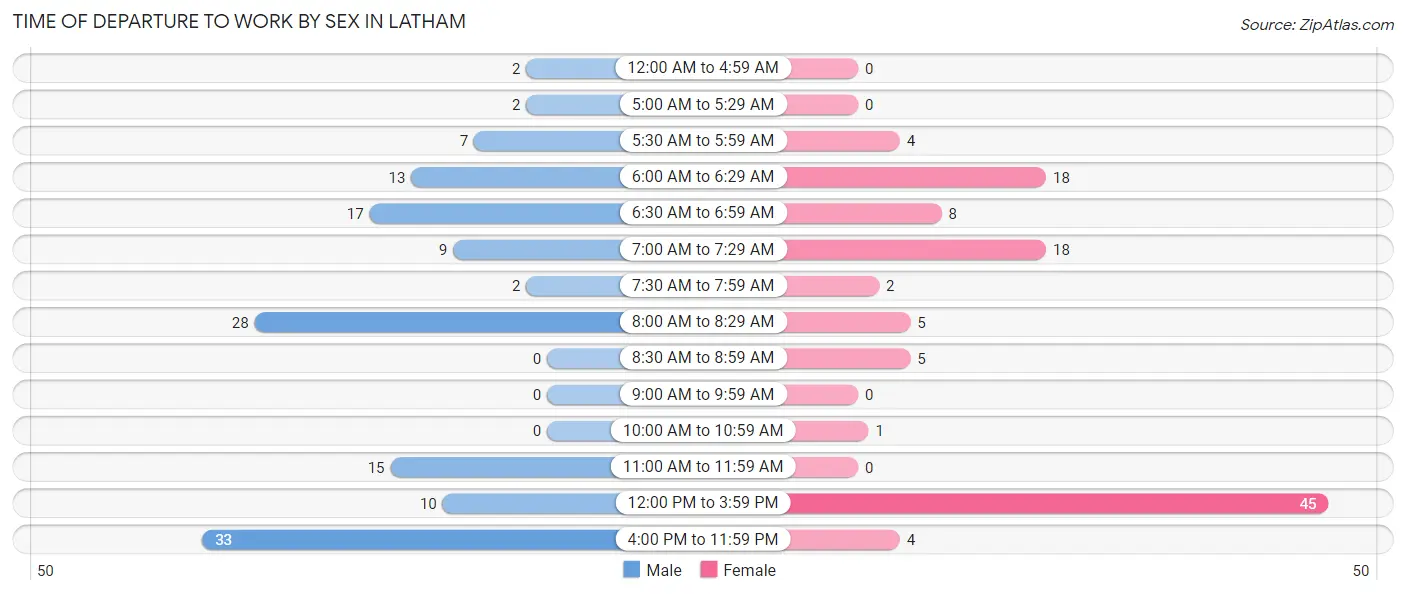
| Time of Departure | Male | Female |
| 12:00 AM to 4:59 AM | 2 (1.5%) | 0 (0.0%) |
| 5:00 AM to 5:29 AM | 2 (1.5%) | 0 (0.0%) |
| 5:30 AM to 5:59 AM | 7 (5.1%) | 4 (3.6%) |
| 6:00 AM to 6:29 AM | 13 (9.4%) | 18 (16.4%) |
| 6:30 AM to 6:59 AM | 17 (12.3%) | 8 (7.3%) |
| 7:00 AM to 7:29 AM | 9 (6.5%) | 18 (16.4%) |
| 7:30 AM to 7:59 AM | 2 (1.5%) | 2 (1.8%) |
| 8:00 AM to 8:29 AM | 28 (20.3%) | 5 (4.5%) |
| 8:30 AM to 8:59 AM | 0 (0.0%) | 5 (4.5%) |
| 9:00 AM to 9:59 AM | 0 (0.0%) | 0 (0.0%) |
| 10:00 AM to 10:59 AM | 0 (0.0%) | 1 (0.9%) |
| 11:00 AM to 11:59 AM | 15 (10.9%) | 0 (0.0%) |
| 12:00 PM to 3:59 PM | 10 (7.2%) | 45 (40.9%) |
| 4:00 PM to 11:59 PM | 33 (23.9%) | 4 (3.6%) |
| Total | 138 (100.0%) | 110 (100.0%) |
Housing Occupancy in Latham
Occupancy by Ownership in Latham
Of the total 193 dwellings in Latham, owner-occupied units account for 115 (59.6%), while renter-occupied units make up 78 (40.4%).
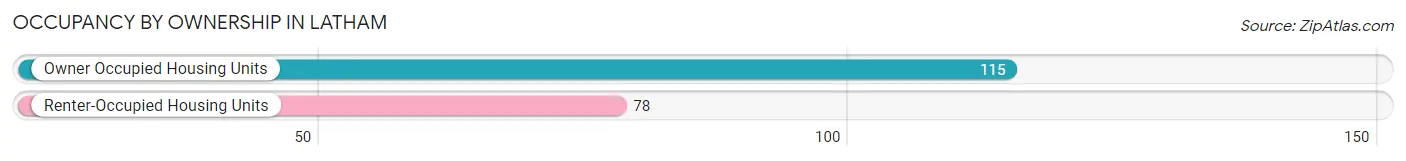
| Occupancy | # Housing Units | % Housing Units |
| Owner Occupied Housing Units | 115 | 59.6% |
| Renter-Occupied Housing Units | 78 | 40.4% |
| Total Occupied Housing Units | 193 | 100.0% |
Occupancy by Household Size in Latham
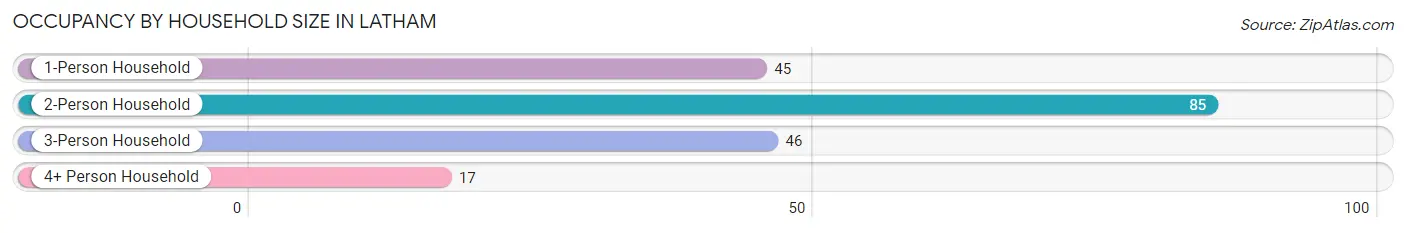
| Household Size | # Housing Units | % Housing Units |
| 1-Person Household | 45 | 23.3% |
| 2-Person Household | 85 | 44.0% |
| 3-Person Household | 46 | 23.8% |
| 4+ Person Household | 17 | 8.8% |
| Total Housing Units | 193 | 100.0% |
Occupancy by Ownership by Household Size in Latham
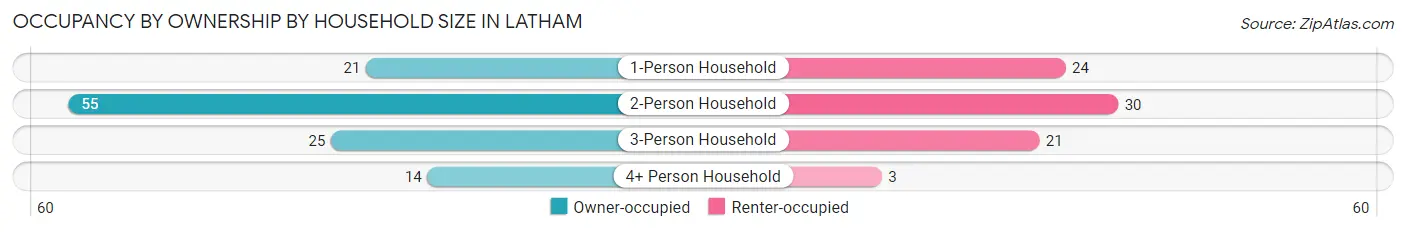
| Household Size | Owner-occupied | Renter-occupied |
| 1-Person Household | 21 (46.7%) | 24 (53.3%) |
| 2-Person Household | 55 (64.7%) | 30 (35.3%) |
| 3-Person Household | 25 (54.3%) | 21 (45.7%) |
| 4+ Person Household | 14 (82.4%) | 3 (17.6%) |
| Total Housing Units | 115 (59.6%) | 78 (40.4%) |
Occupancy by Educational Attainment in Latham
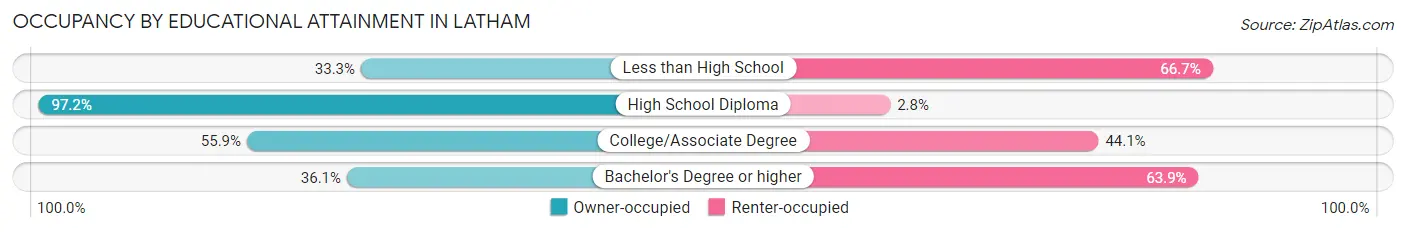
| Household Size | Owner-occupied | Renter-occupied |
| Less than High School | 1 (33.3%) | 2 (66.7%) |
| High School Diploma | 35 (97.2%) | 1 (2.8%) |
| College/Associate Degree | 66 (55.9%) | 52 (44.1%) |
| Bachelor's Degree or higher | 13 (36.1%) | 23 (63.9%) |
Occupancy by Age of Householder in Latham
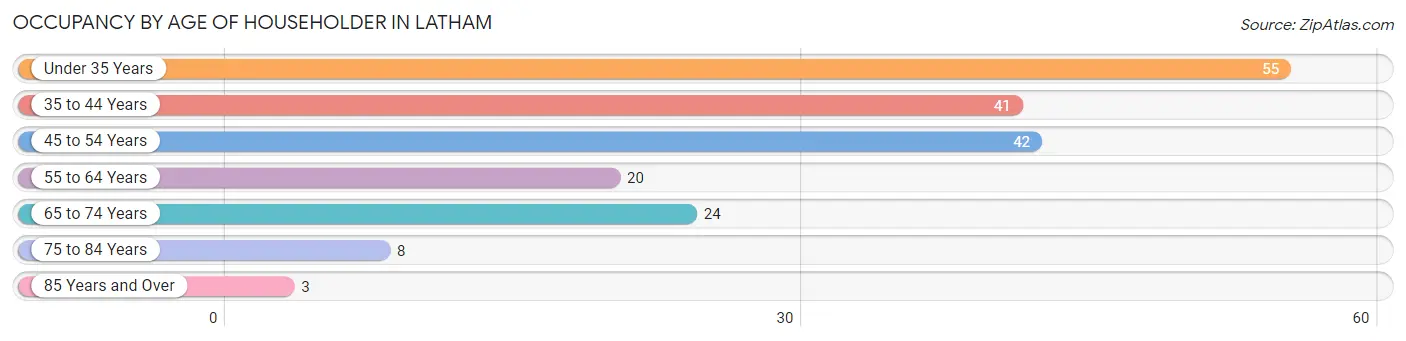
| Age Bracket | # Households | % Households |
| Under 35 Years | 55 | 28.5% |
| 35 to 44 Years | 41 | 21.2% |
| 45 to 54 Years | 42 | 21.8% |
| 55 to 64 Years | 20 | 10.4% |
| 65 to 74 Years | 24 | 12.4% |
| 75 to 84 Years | 8 | 4.2% |
| 85 Years and Over | 3 | 1.5% |
| Total | 193 | 100.0% |
Housing Finances in Latham
Median Income by Occupancy in Latham
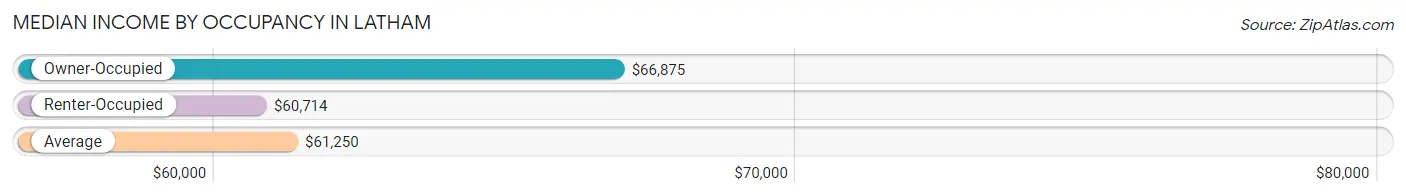
| Occupancy Type | # Households | Median Income |
| Owner-Occupied | 115 (59.6%) | $66,875 |
| Renter-Occupied | 78 (40.4%) | $60,714 |
| Average | 193 (100.0%) | $61,250 |
Occupancy by Householder Income Bracket in Latham
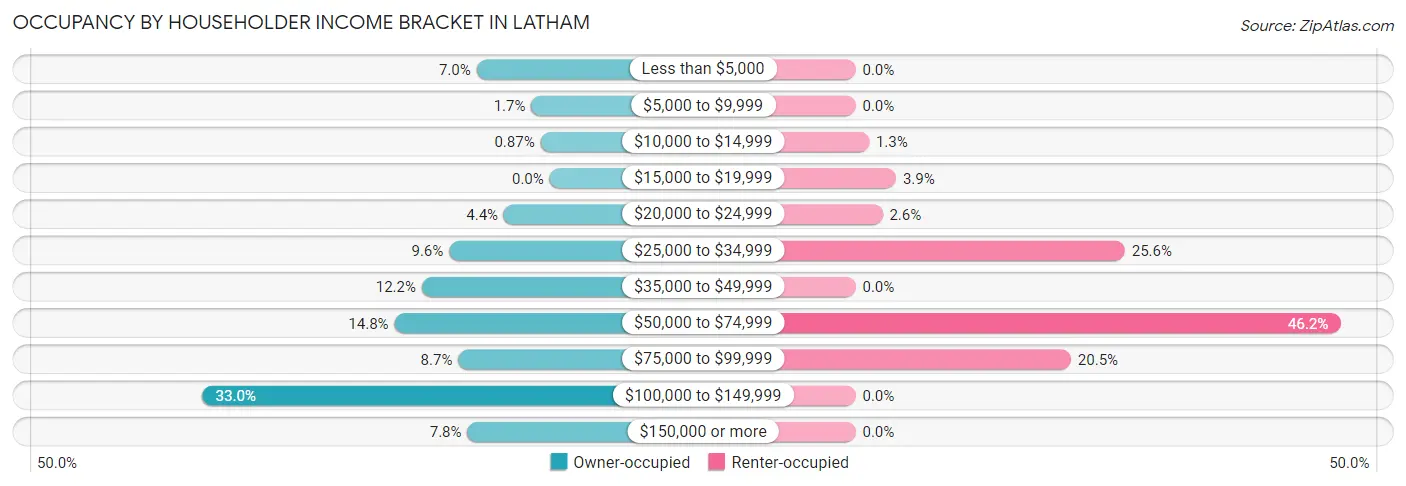
| Income Bracket | Owner-occupied | Renter-occupied |
| Less than $5,000 | 8 (7.0%) | 0 (0.0%) |
| $5,000 to $9,999 | 2 (1.7%) | 0 (0.0%) |
| $10,000 to $14,999 | 1 (0.9%) | 1 (1.3%) |
| $15,000 to $19,999 | 0 (0.0%) | 3 (3.8%) |
| $20,000 to $24,999 | 5 (4.3%) | 2 (2.6%) |
| $25,000 to $34,999 | 11 (9.6%) | 20 (25.6%) |
| $35,000 to $49,999 | 14 (12.2%) | 0 (0.0%) |
| $50,000 to $74,999 | 17 (14.8%) | 36 (46.2%) |
| $75,000 to $99,999 | 10 (8.7%) | 16 (20.5%) |
| $100,000 to $149,999 | 38 (33.0%) | 0 (0.0%) |
| $150,000 or more | 9 (7.8%) | 0 (0.0%) |
| Total | 115 (100.0%) | 78 (100.0%) |
Monthly Housing Cost Tiers in Latham
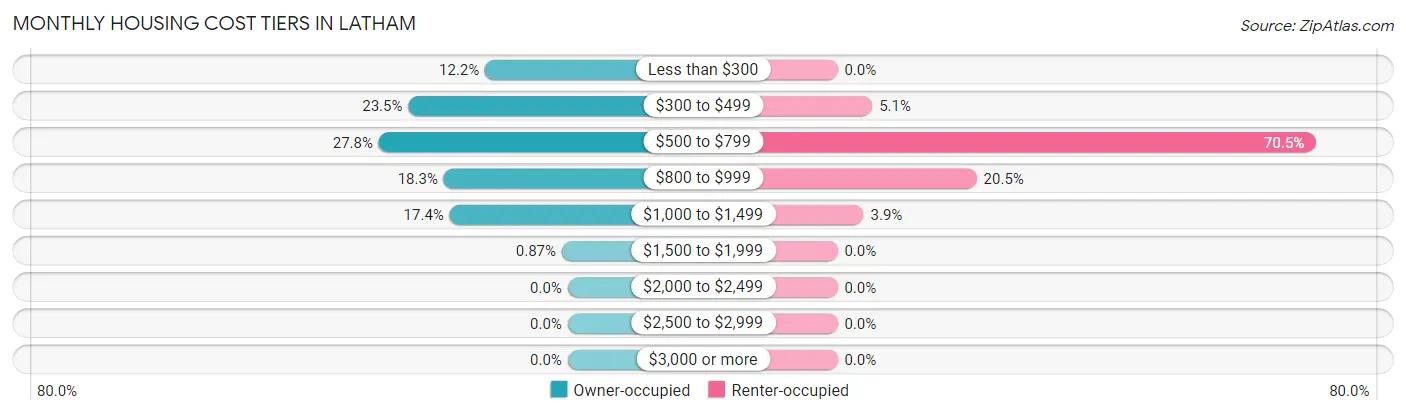
| Monthly Cost | Owner-occupied | Renter-occupied |
| Less than $300 | 14 (12.2%) | 0 (0.0%) |
| $300 to $499 | 27 (23.5%) | 4 (5.1%) |
| $500 to $799 | 32 (27.8%) | 55 (70.5%) |
| $800 to $999 | 21 (18.3%) | 16 (20.5%) |
| $1,000 to $1,499 | 20 (17.4%) | 3 (3.8%) |
| $1,500 to $1,999 | 1 (0.9%) | 0 (0.0%) |
| $2,000 to $2,499 | 0 (0.0%) | 0 (0.0%) |
| $2,500 to $2,999 | 0 (0.0%) | 0 (0.0%) |
| $3,000 or more | 0 (0.0%) | 0 (0.0%) |
| Total | 115 (100.0%) | 78 (100.0%) |
Physical Housing Characteristics in Latham
Housing Structures in Latham
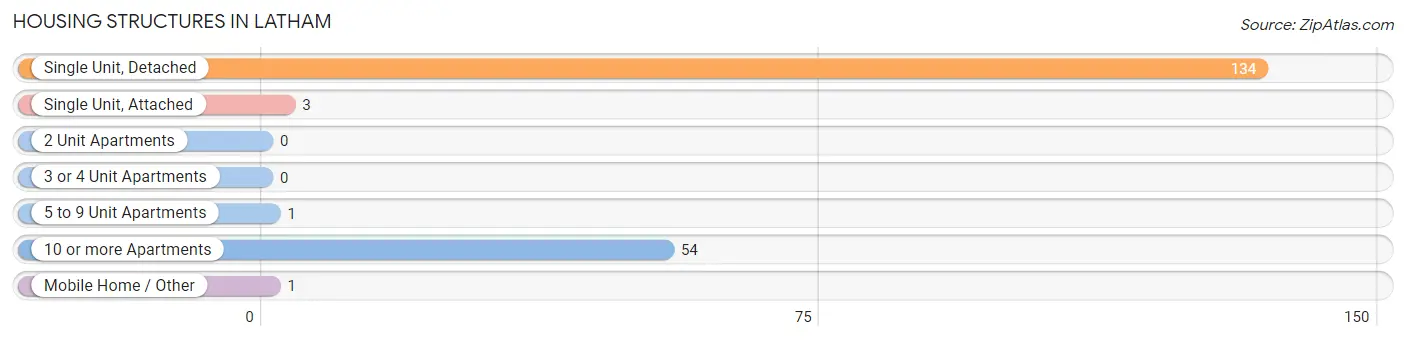
| Structure Type | # Housing Units | % Housing Units |
| Single Unit, Detached | 134 | 69.4% |
| Single Unit, Attached | 3 | 1.5% |
| 2 Unit Apartments | 0 | 0.0% |
| 3 or 4 Unit Apartments | 0 | 0.0% |
| 5 to 9 Unit Apartments | 1 | 0.5% |
| 10 or more Apartments | 54 | 28.0% |
| Mobile Home / Other | 1 | 0.5% |
| Total | 193 | 100.0% |
Housing Structures by Occupancy in Latham
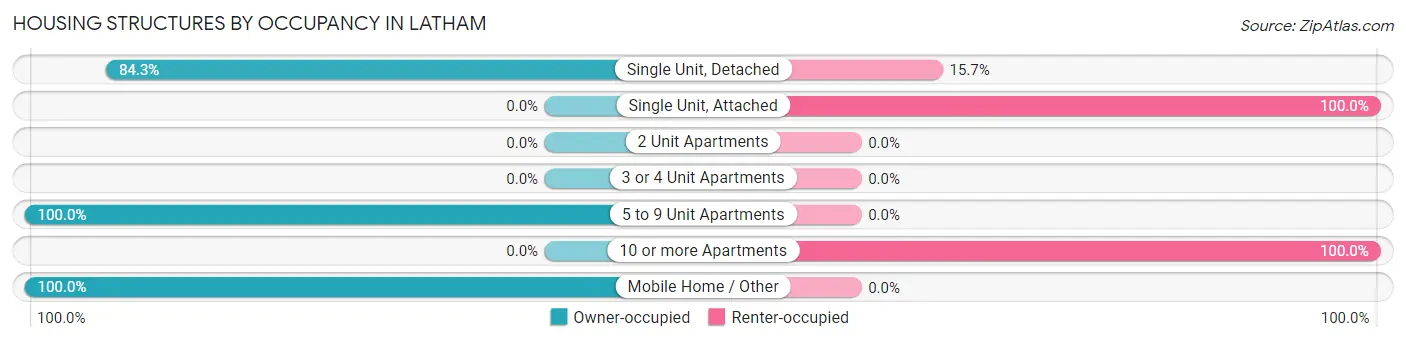
| Structure Type | Owner-occupied | Renter-occupied |
| Single Unit, Detached | 113 (84.3%) | 21 (15.7%) |
| Single Unit, Attached | 0 (0.0%) | 3 (100.0%) |
| 2 Unit Apartments | 0 (0.0%) | 0 (0.0%) |
| 3 or 4 Unit Apartments | 0 (0.0%) | 0 (0.0%) |
| 5 to 9 Unit Apartments | 1 (100.0%) | 0 (0.0%) |
| 10 or more Apartments | 0 (0.0%) | 54 (100.0%) |
| Mobile Home / Other | 1 (100.0%) | 0 (0.0%) |
| Total | 115 (59.6%) | 78 (40.4%) |
Housing Structures by Number of Rooms in Latham
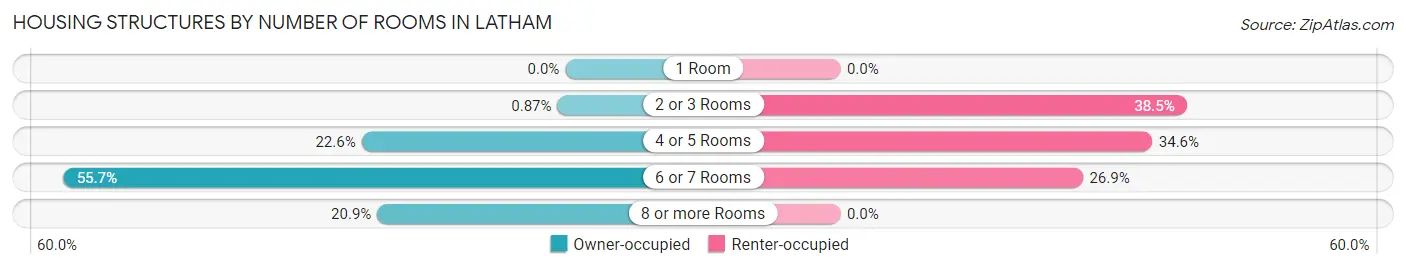
| Number of Rooms | Owner-occupied | Renter-occupied |
| 1 Room | 0 (0.0%) | 0 (0.0%) |
| 2 or 3 Rooms | 1 (0.9%) | 30 (38.5%) |
| 4 or 5 Rooms | 26 (22.6%) | 27 (34.6%) |
| 6 or 7 Rooms | 64 (55.6%) | 21 (26.9%) |
| 8 or more Rooms | 24 (20.9%) | 0 (0.0%) |
| Total | 115 (100.0%) | 78 (100.0%) |
Housing Structure by Heating Type in Latham
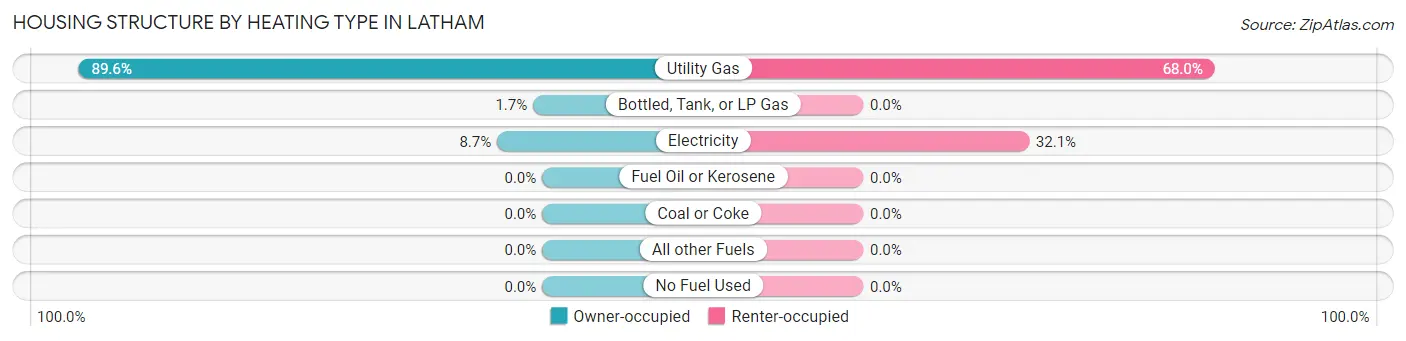
| Heating Type | Owner-occupied | Renter-occupied |
| Utility Gas | 103 (89.6%) | 53 (67.9%) |
| Bottled, Tank, or LP Gas | 2 (1.7%) | 0 (0.0%) |
| Electricity | 10 (8.7%) | 25 (32.1%) |
| Fuel Oil or Kerosene | 0 (0.0%) | 0 (0.0%) |
| Coal or Coke | 0 (0.0%) | 0 (0.0%) |
| All other Fuels | 0 (0.0%) | 0 (0.0%) |
| No Fuel Used | 0 (0.0%) | 0 (0.0%) |
| Total | 115 (100.0%) | 78 (100.0%) |
Household Vehicle Usage in Latham
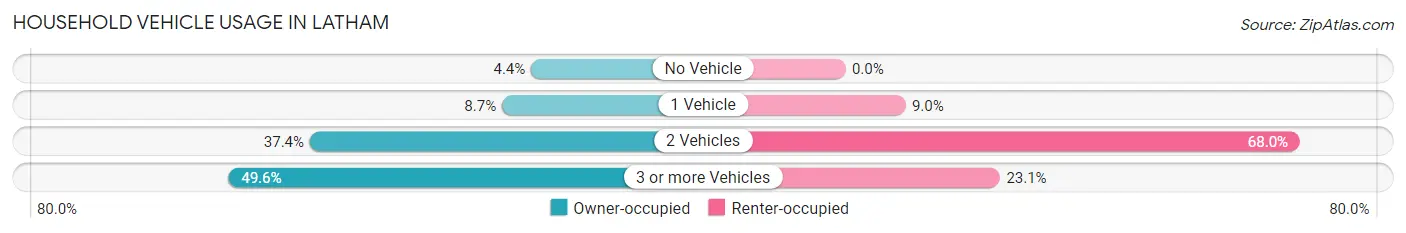
| Vehicles per Household | Owner-occupied | Renter-occupied |
| No Vehicle | 5 (4.3%) | 0 (0.0%) |
| 1 Vehicle | 10 (8.7%) | 7 (9.0%) |
| 2 Vehicles | 43 (37.4%) | 53 (67.9%) |
| 3 or more Vehicles | 57 (49.6%) | 18 (23.1%) |
| Total | 115 (100.0%) | 78 (100.0%) |
Real Estate & Mortgages in Latham
Real Estate and Mortgage Overview in Latham
| Characteristic | Without Mortgage | With Mortgage |
| Housing Units | 71 | 44 |
| Median Property Value | $76,800 | $85,800 |
| Median Household Income | $48,750 | $8 |
| Monthly Housing Costs | $463 | $0 |
| Real Estate Taxes | $1,617 | $0 |
Property Value by Mortgage Status in Latham
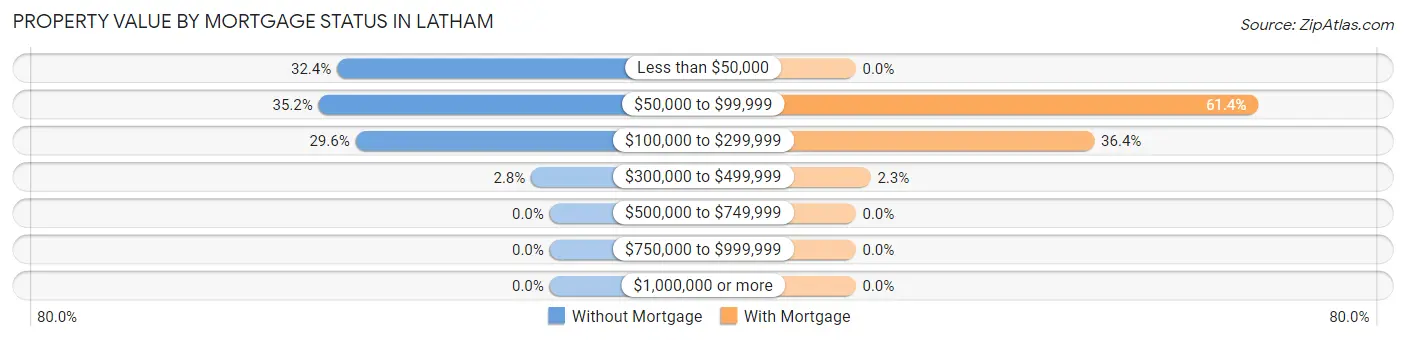
| Property Value | Without Mortgage | With Mortgage |
| Less than $50,000 | 23 (32.4%) | 0 (0.0%) |
| $50,000 to $99,999 | 25 (35.2%) | 27 (61.4%) |
| $100,000 to $299,999 | 21 (29.6%) | 16 (36.4%) |
| $300,000 to $499,999 | 2 (2.8%) | 1 (2.3%) |
| $500,000 to $749,999 | 0 (0.0%) | 0 (0.0%) |
| $750,000 to $999,999 | 0 (0.0%) | 0 (0.0%) |
| $1,000,000 or more | 0 (0.0%) | 0 (0.0%) |
| Total | 71 (100.0%) | 44 (100.0%) |
Household Income by Mortgage Status in Latham
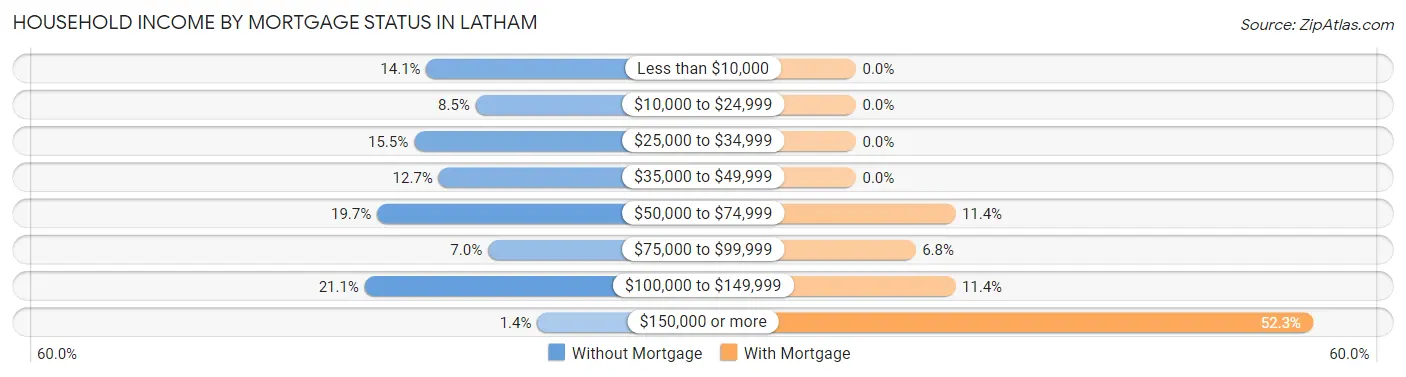
| Household Income | Without Mortgage | With Mortgage |
| Less than $10,000 | 10 (14.1%) | 0 (0.0%) |
| $10,000 to $24,999 | 6 (8.5%) | 0 (0.0%) |
| $25,000 to $34,999 | 11 (15.5%) | 0 (0.0%) |
| $35,000 to $49,999 | 9 (12.7%) | 0 (0.0%) |
| $50,000 to $74,999 | 14 (19.7%) | 5 (11.4%) |
| $75,000 to $99,999 | 5 (7.0%) | 3 (6.8%) |
| $100,000 to $149,999 | 15 (21.1%) | 5 (11.4%) |
| $150,000 or more | 1 (1.4%) | 23 (52.3%) |
| Total | 71 (100.0%) | 44 (100.0%) |
Property Value to Household Income Ratio in Latham
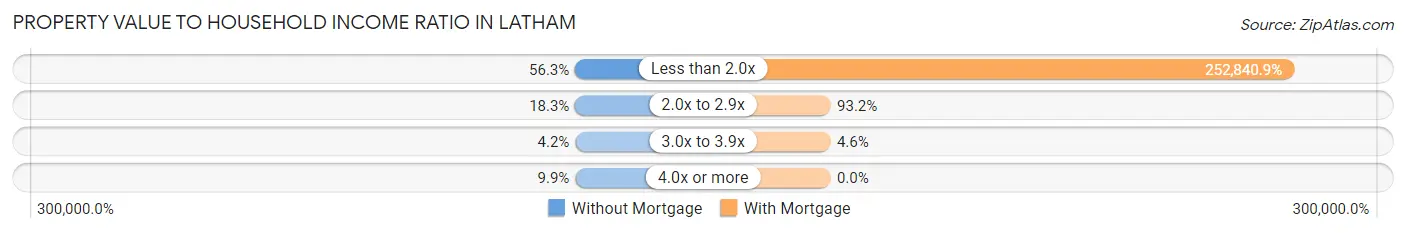
| Value-to-Income Ratio | Without Mortgage | With Mortgage |
| Less than 2.0x | 40 (56.3%) | 111,250 (252,840.9%) |
| 2.0x to 2.9x | 13 (18.3%) | 41 (93.2%) |
| 3.0x to 3.9x | 3 (4.2%) | 2 (4.5%) |
| 4.0x or more | 7 (9.9%) | 0 (0.0%) |
| Total | 71 (100.0%) | 44 (100.0%) |
Real Estate Taxes by Mortgage Status in Latham
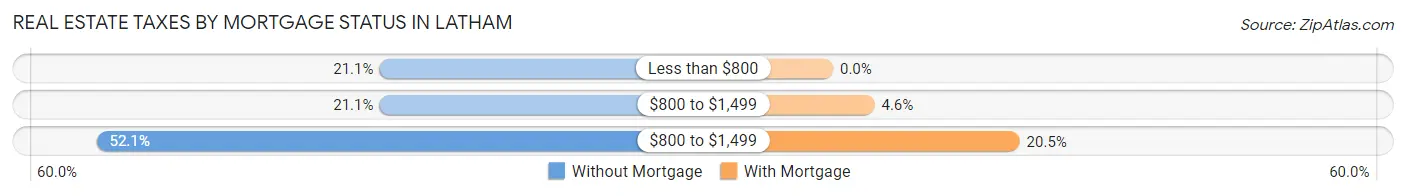
| Property Taxes | Without Mortgage | With Mortgage |
| Less than $800 | 15 (21.1%) | 0 (0.0%) |
| $800 to $1,499 | 15 (21.1%) | 2 (4.5%) |
| $800 to $1,499 | 37 (52.1%) | 9 (20.4%) |
| Total | 71 (100.0%) | 44 (100.0%) |
Health & Disability in Latham
Health Insurance Coverage by Age in Latham
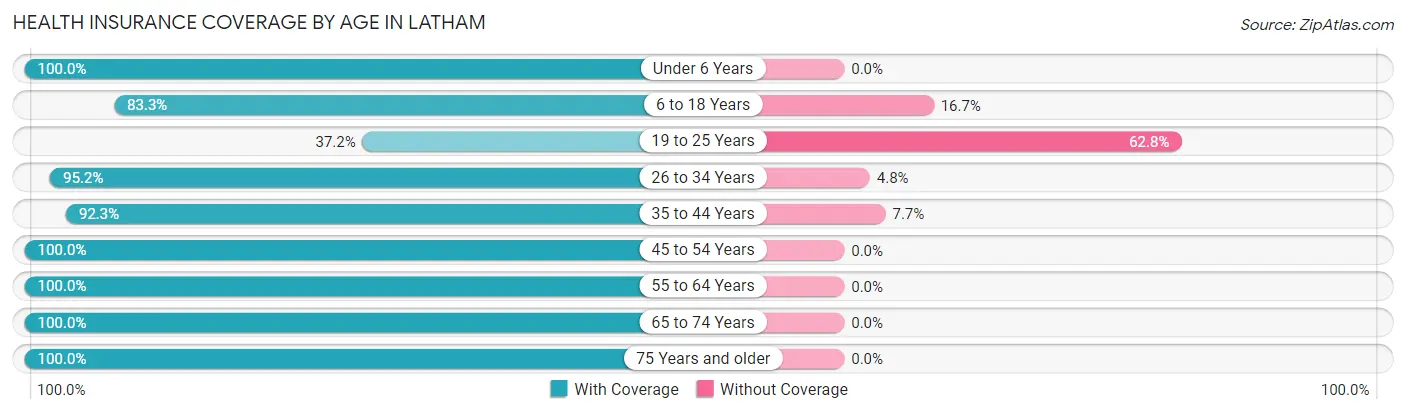
| Age Bracket | With Coverage | Without Coverage |
| Under 6 Years | 16 (100.0%) | 0 (0.0%) |
| 6 to 18 Years | 55 (83.3%) | 11 (16.7%) |
| 19 to 25 Years | 42 (37.2%) | 71 (62.8%) |
| 26 to 34 Years | 20 (95.2%) | 1 (4.8%) |
| 35 to 44 Years | 48 (92.3%) | 4 (7.7%) |
| 45 to 54 Years | 63 (100.0%) | 0 (0.0%) |
| 55 to 64 Years | 44 (100.0%) | 0 (0.0%) |
| 65 to 74 Years | 45 (100.0%) | 0 (0.0%) |
| 75 Years and older | 20 (100.0%) | 0 (0.0%) |
| Total | 353 (80.2%) | 87 (19.8%) |
Health Insurance Coverage by Citizenship Status in Latham
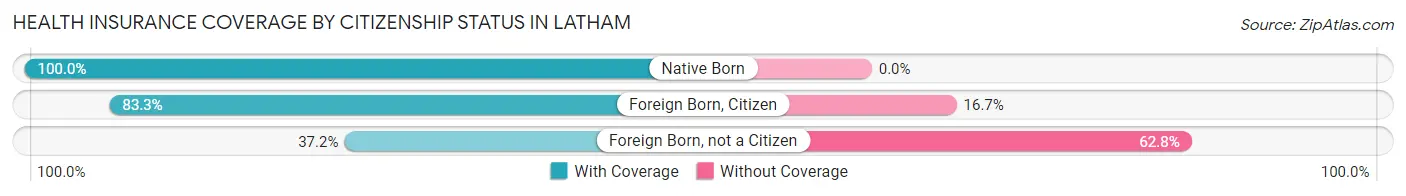
| Citizenship Status | With Coverage | Without Coverage |
| Native Born | 16 (100.0%) | 0 (0.0%) |
| Foreign Born, Citizen | 55 (83.3%) | 11 (16.7%) |
| Foreign Born, not a Citizen | 42 (37.2%) | 71 (62.8%) |
Health Insurance Coverage by Household Income in Latham
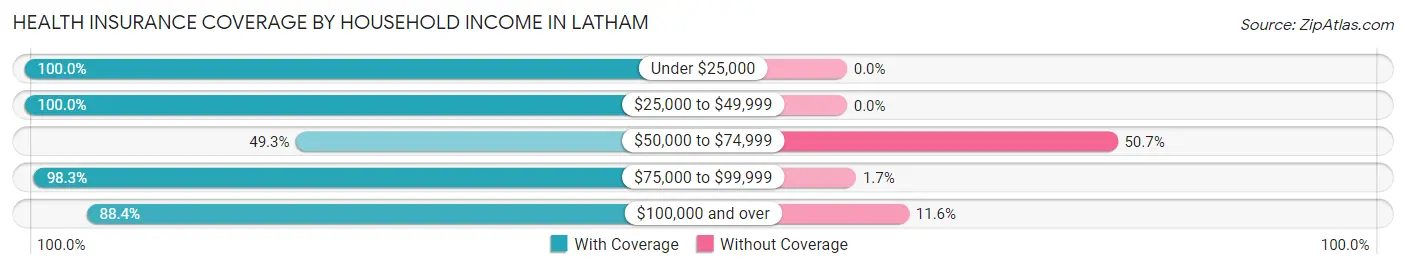
| Household Income | With Coverage | Without Coverage |
| Under $25,000 | 34 (100.0%) | 0 (0.0%) |
| $25,000 to $49,999 | 79 (100.0%) | 0 (0.0%) |
| $50,000 to $74,999 | 69 (49.3%) | 71 (50.7%) |
| $75,000 to $99,999 | 57 (98.3%) | 1 (1.7%) |
| $100,000 and over | 114 (88.4%) | 15 (11.6%) |
Public vs Private Health Insurance Coverage by Age in Latham
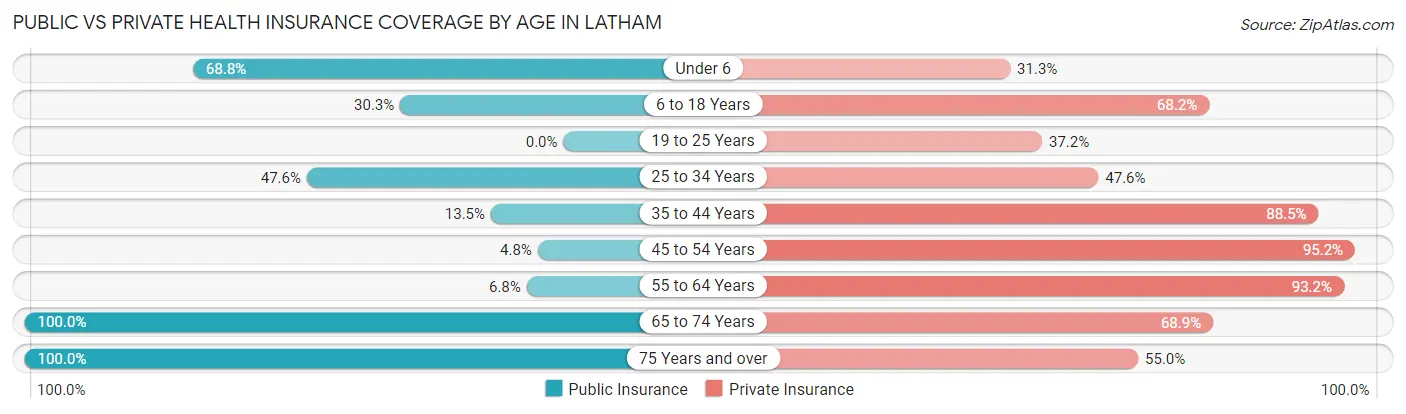
| Age Bracket | Public Insurance | Private Insurance |
| Under 6 | 11 (68.8%) | 5 (31.2%) |
| 6 to 18 Years | 20 (30.3%) | 45 (68.2%) |
| 19 to 25 Years | 0 (0.0%) | 42 (37.2%) |
| 25 to 34 Years | 10 (47.6%) | 10 (47.6%) |
| 35 to 44 Years | 7 (13.5%) | 46 (88.5%) |
| 45 to 54 Years | 3 (4.8%) | 60 (95.2%) |
| 55 to 64 Years | 3 (6.8%) | 41 (93.2%) |
| 65 to 74 Years | 45 (100.0%) | 31 (68.9%) |
| 75 Years and over | 20 (100.0%) | 11 (55.0%) |
| Total | 119 (27.1%) | 291 (66.1%) |
Disability Status by Sex by Age in Latham
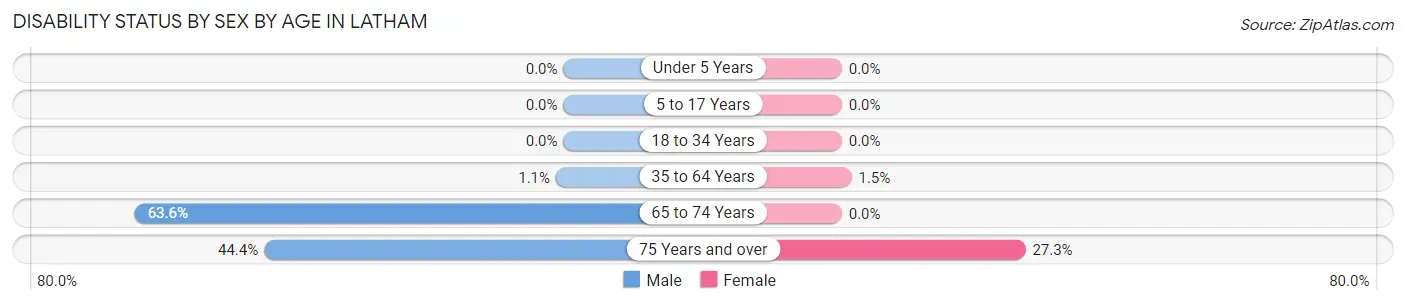
| Age Bracket | Male | Female |
| Under 5 Years | 0 (0.0%) | 0 (0.0%) |
| 5 to 17 Years | 0 (0.0%) | 0 (0.0%) |
| 18 to 34 Years | 0 (0.0%) | 0 (0.0%) |
| 35 to 64 Years | 1 (1.1%) | 1 (1.5%) |
| 65 to 74 Years | 14 (63.6%) | 0 (0.0%) |
| 75 Years and over | 4 (44.4%) | 3 (27.3%) |
Disability Class by Sex by Age in Latham
Disability Class: Hearing Difficulty
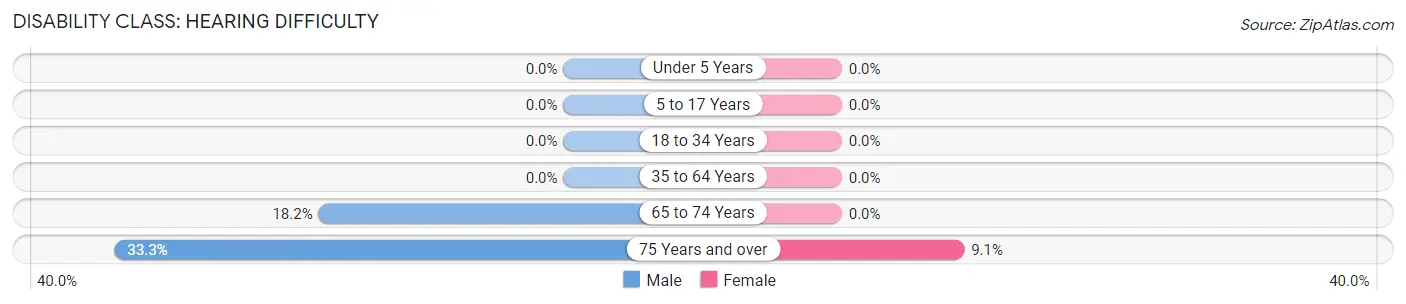
| Age Bracket | Male | Female |
| Under 5 Years | 0 (0.0%) | 0 (0.0%) |
| 5 to 17 Years | 0 (0.0%) | 0 (0.0%) |
| 18 to 34 Years | 0 (0.0%) | 0 (0.0%) |
| 35 to 64 Years | 0 (0.0%) | 0 (0.0%) |
| 65 to 74 Years | 4 (18.2%) | 0 (0.0%) |
| 75 Years and over | 3 (33.3%) | 1 (9.1%) |
Disability Class: Vision Difficulty
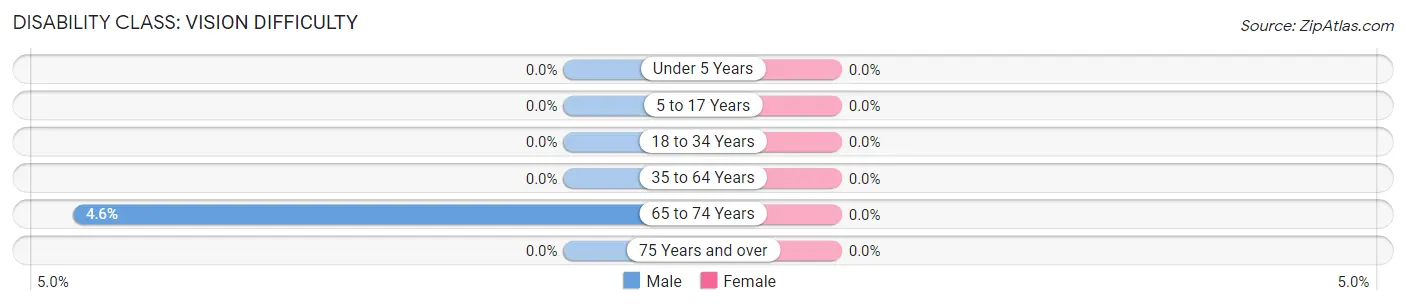
| Age Bracket | Male | Female |
| Under 5 Years | 0 (0.0%) | 0 (0.0%) |
| 5 to 17 Years | 0 (0.0%) | 0 (0.0%) |
| 18 to 34 Years | 0 (0.0%) | 0 (0.0%) |
| 35 to 64 Years | 0 (0.0%) | 0 (0.0%) |
| 65 to 74 Years | 1 (4.5%) | 0 (0.0%) |
| 75 Years and over | 0 (0.0%) | 0 (0.0%) |
Disability Class: Cognitive Difficulty
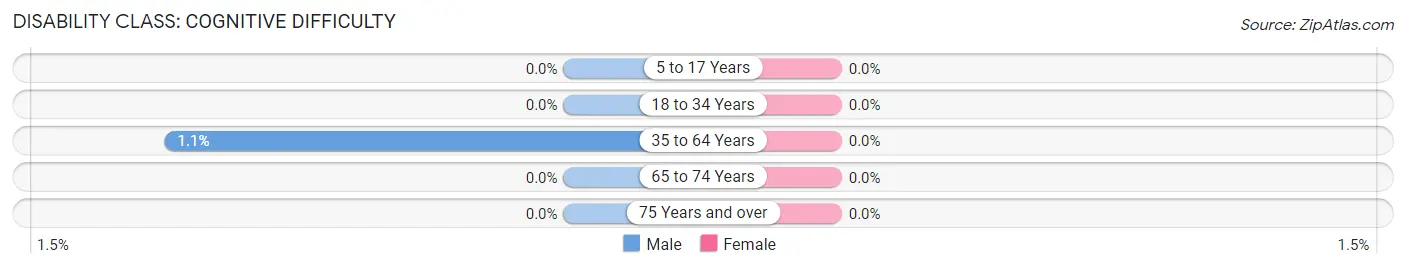
| Age Bracket | Male | Female |
| 5 to 17 Years | 0 (0.0%) | 0 (0.0%) |
| 18 to 34 Years | 0 (0.0%) | 0 (0.0%) |
| 35 to 64 Years | 1 (1.1%) | 0 (0.0%) |
| 65 to 74 Years | 0 (0.0%) | 0 (0.0%) |
| 75 Years and over | 0 (0.0%) | 0 (0.0%) |
Disability Class: Ambulatory Difficulty
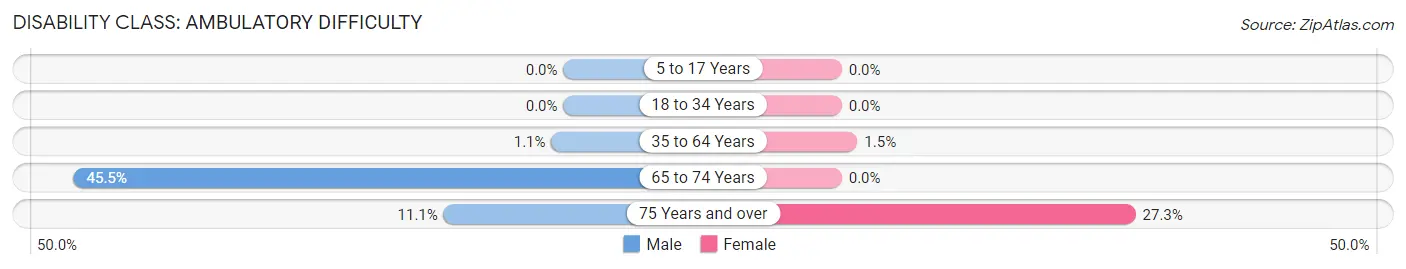
| Age Bracket | Male | Female |
| 5 to 17 Years | 0 (0.0%) | 0 (0.0%) |
| 18 to 34 Years | 0 (0.0%) | 0 (0.0%) |
| 35 to 64 Years | 1 (1.1%) | 1 (1.5%) |
| 65 to 74 Years | 10 (45.5%) | 0 (0.0%) |
| 75 Years and over | 1 (11.1%) | 3 (27.3%) |
Disability Class: Self-Care Difficulty
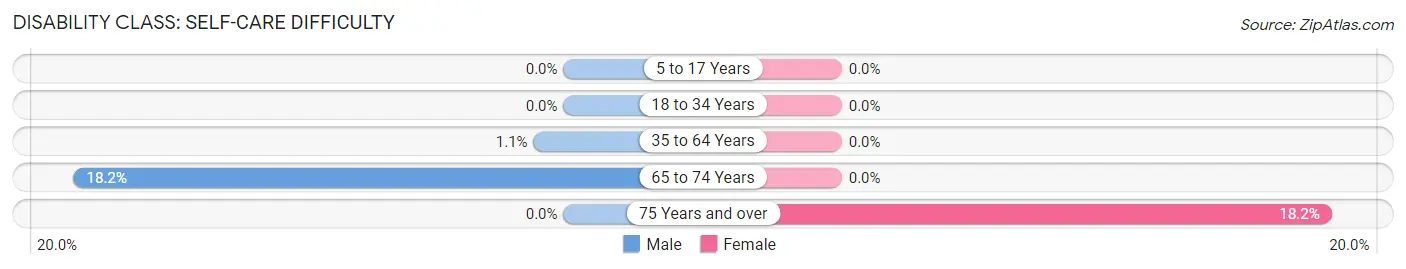
| Age Bracket | Male | Female |
| 5 to 17 Years | 0 (0.0%) | 0 (0.0%) |
| 18 to 34 Years | 0 (0.0%) | 0 (0.0%) |
| 35 to 64 Years | 1 (1.1%) | 0 (0.0%) |
| 65 to 74 Years | 4 (18.2%) | 0 (0.0%) |
| 75 Years and over | 0 (0.0%) | 2 (18.2%) |
Technology Access in Latham
Computing Device Access in Latham
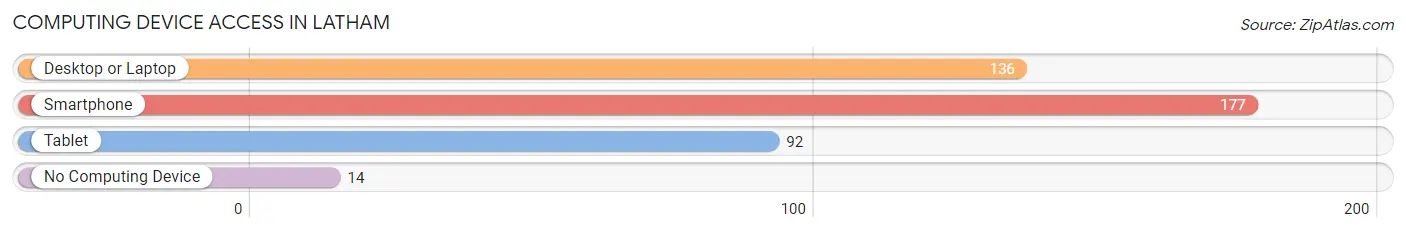
| Device Type | # Households | % Households |
| Desktop or Laptop | 136 | 70.5% |
| Smartphone | 177 | 91.7% |
| Tablet | 92 | 47.7% |
| No Computing Device | 14 | 7.2% |
| Total | 193 | 100.0% |
Internet Access in Latham
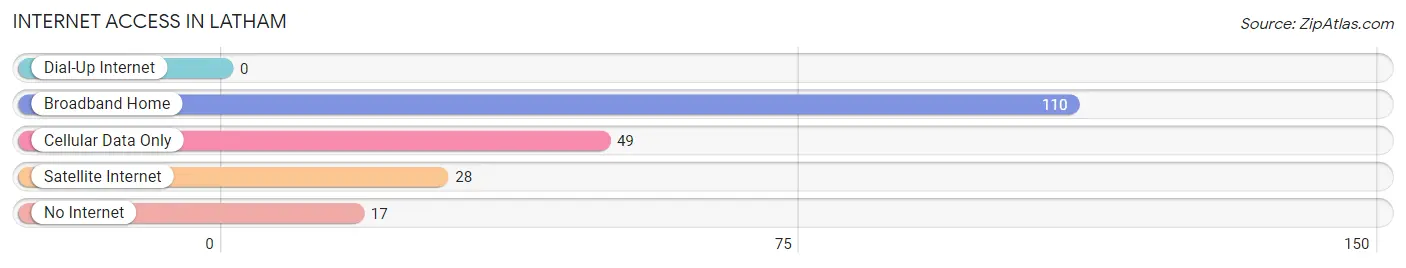
| Internet Type | # Households | % Households |
| Dial-Up Internet | 0 | 0.0% |
| Broadband Home | 110 | 57.0% |
| Cellular Data Only | 49 | 25.4% |
| Satellite Internet | 28 | 14.5% |
| No Internet | 17 | 8.8% |
| Total | 193 | 100.0% |
Latham Summary
Latham is a small village located in Sangamon County, Illinois. It is situated on the banks of the Sangamon River, about 10 miles south of Springfield. The village has a population of about 1,000 people and is part of the Springfield Metropolitan Statistical Area.
History
Latham was founded in 1836 by William Latham, a settler from Kentucky. He purchased the land from the federal government and established a small trading post. The village was originally known as Latham’s Station, but the name was changed to Latham in 1837.
The village grew slowly over the years, but it was not until the arrival of the railroad in 1871 that it began to experience significant growth. The railroad brought new businesses and industries to the area, and the population of the village began to increase.
In the late 19th century, Latham was a thriving agricultural community. The village was home to several grain elevators, a flour mill, and a number of other businesses. The village also had a number of churches, schools, and other civic organizations.
Geography
Latham is located in the central part of Sangamon County, about 10 miles south of Springfield. The village is situated on the banks of the Sangamon River, which flows through the area. The village is surrounded by rolling hills and farmland.
The climate in Latham is typical of the Midwest, with hot summers and cold winters. The average temperature in the summer is around 80 degrees Fahrenheit, and the average temperature in the winter is around 30 degrees Fahrenheit.
Economy
The economy of Latham is largely based on agriculture. The village is home to several grain elevators, a flour mill, and a number of other businesses related to agriculture. The village also has a number of small businesses, including restaurants, retail stores, and service providers.
The village is also home to a number of manufacturing companies, including a plastics factory and a metal fabrication plant. The village is also home to a number of small businesses, including restaurants, retail stores, and service providers.
Demographics
As of the 2010 census, the population of Latham was 1,000 people. The racial makeup of the village was 97.2% White, 0.7% African American, 0.3% Native American, 0.2% Asian, and 1.6% from other races. The median household income in the village was $45,000, and the median family income was $50,000.
The village is served by the Latham-Hillsboro School District, which includes two elementary schools, one middle school, and one high school. The village is also home to a number of churches, including the Latham United Methodist Church, the Latham Baptist Church, and the Latham Presbyterian Church.
Conclusion
Latham is a small village located in Sangamon County, Illinois. It is situated on the banks of the Sangamon River, about 10 miles south of Springfield. The village has a population of about 1,000 people and is part of the Springfield Metropolitan Statistical Area. The economy of Latham is largely based on agriculture, and the village is home to several grain elevators, a flour mill, and a number of other businesses related to agriculture. The village is also home to a number of manufacturing companies, including a plastics factory and a metal fabrication plant. The village is served by the Latham-Hillsboro School District, and is home to a number of churches.
Common Questions
What is Per Capita Income in Latham?
Per Capita income in Latham is $29,293.
What is the Median Family Income in Latham?
Median Family Income in Latham is $78,750.
What is the Median Household income in Latham?
Median Household Income in Latham is $61,250.
What is Income or Wage Gap in Latham?
Income or Wage Gap in Latham is 61.7%.
Women in Latham earn 38.3 cents for every dollar earned by a man.
What is Inequality or Gini Index in Latham?
Inequality or Gini Index in Latham is 0.35.
What is the Total Population of Latham?
Total Population of Latham is 450.
What is the Total Male Population of Latham?
Total Male Population of Latham is 252.
What is the Total Female Population of Latham?
Total Female Population of Latham is 198.
What is the Ratio of Males per 100 Females in Latham?
There are 127.27 Males per 100 Females in Latham.
What is the Ratio of Females per 100 Males in Latham?
There are 78.57 Females per 100 Males in Latham.
What is the Median Population Age in Latham?
Median Population Age in Latham is 34.5 Years.
What is the Average Family Size in Latham
Average Family Size in Latham is 2.9 People.
What is the Average Household Size in Latham
Average Household Size in Latham is 2.3 People.
How Large is the Labor Force in Latham?
There are 268 People in the Labor Forcein in Latham.
What is the Percentage of People in the Labor Force in Latham?
68.7% of People are in the Labor Force in Latham.
What is the Unemployment Rate in Latham?
Unemployment Rate in Latham is 4.7%.