East Carondelet, IL Map & Demographics
East Carondelet Map
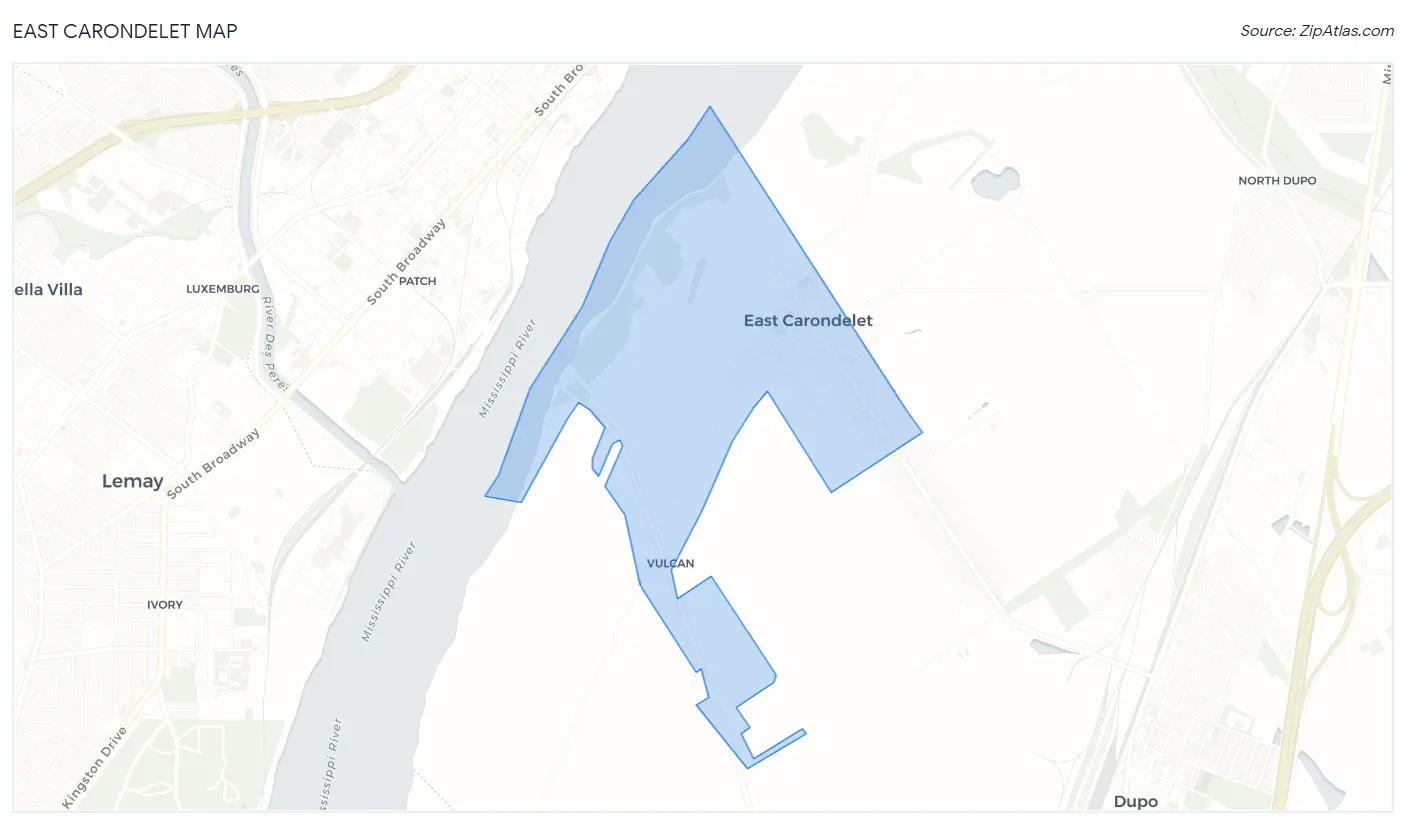
East Carondelet Overview
$26,838
PER CAPITA INCOME
$63,750
AVG FAMILY INCOME
$57,000
AVG HOUSEHOLD INCOME
21.3%
WAGE / INCOME GAP [ % ]
78.7¢/ $1
WAGE / INCOME GAP [ $ ]
$7,546
FAMILY INCOME DEFICIT
0.45
INEQUALITY / GINI INDEX
267
TOTAL POPULATION
115
MALE POPULATION
152
FEMALE POPULATION
75.66
MALES / 100 FEMALES
132.17
FEMALES / 100 MALES
37.4
MEDIAN AGE
3.6
AVG FAMILY SIZE
2.6
AVG HOUSEHOLD SIZE
134
LABOR FORCE [ PEOPLE ]
65.0%
PERCENT IN LABOR FORCE
4.5%
UNEMPLOYMENT RATE
East Carondelet Zip Codes
East Carondelet Area Codes
Income in East Carondelet
Income Overview in East Carondelet
Per Capita Income in East Carondelet is $26,838, while median incomes of families and households are $63,750 and $57,000 respectively.
| Characteristic | Number | Measure |
| Per Capita Income | 267 | $26,838 |
| Median Family Income | 59 | $63,750 |
| Mean Family Income | 59 | $80,205 |
| Median Household Income | 102 | $57,000 |
| Mean Household Income | 102 | $66,293 |
| Income Deficit | 59 | $7,546 |
| Wage / Income Gap (%) | 267 | 21.30% |
| Wage / Income Gap ($) | 267 | 78.70¢ per $1 |
| Gini / Inequality Index | 267 | 0.45 |
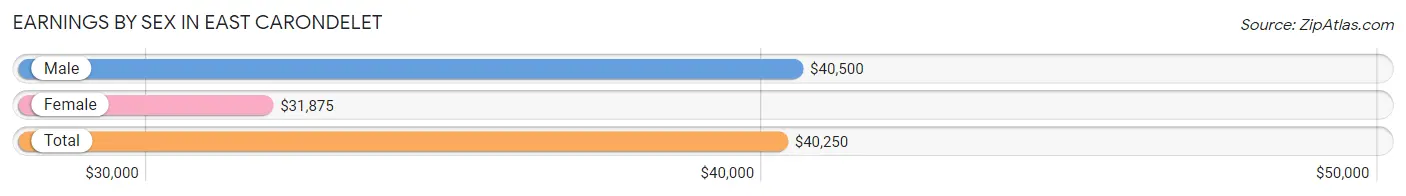
Earnings by Sex in East Carondelet
Average Earnings in East Carondelet are $40,250, $40,500 for men and $31,875 for women, a difference of 21.3%.
| Sex | Number | Average Earnings |
| Male | 68 (51.1%) | $40,500 |
| Female | 65 (48.9%) | $31,875 |
| Total | 133 (100.0%) | $40,250 |
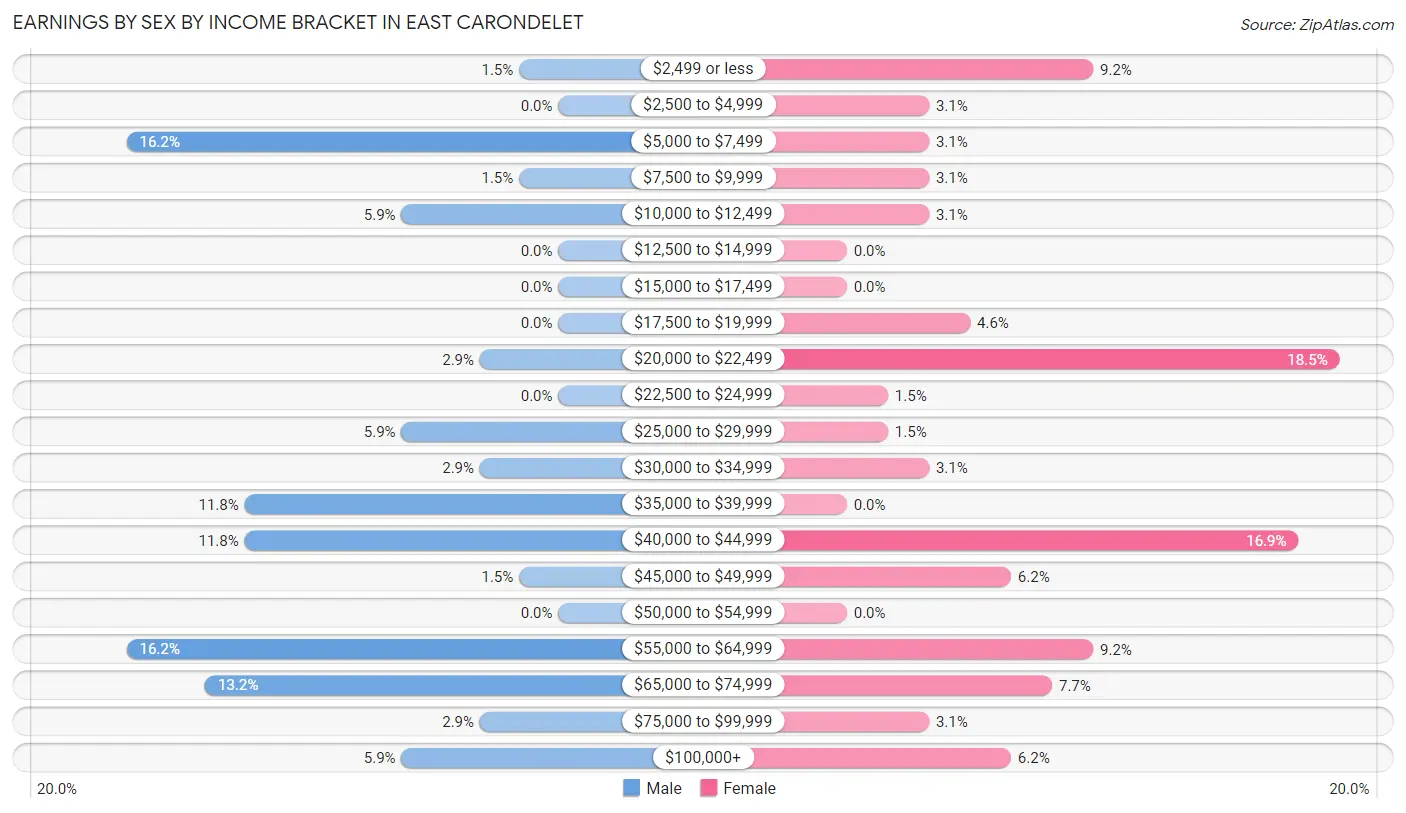
Earnings by Sex by Income Bracket in East Carondelet
The most common earnings brackets in East Carondelet are $5,000 to $7,499 for men (11 | 16.2%) and $20,000 to $22,499 for women (12 | 18.5%).
| Income | Male | Female |
| $2,499 or less | 1 (1.5%) | 6 (9.2%) |
| $2,500 to $4,999 | 0 (0.0%) | 2 (3.1%) |
| $5,000 to $7,499 | 11 (16.2%) | 2 (3.1%) |
| $7,500 to $9,999 | 1 (1.5%) | 2 (3.1%) |
| $10,000 to $12,499 | 4 (5.9%) | 2 (3.1%) |
| $12,500 to $14,999 | 0 (0.0%) | 0 (0.0%) |
| $15,000 to $17,499 | 0 (0.0%) | 0 (0.0%) |
| $17,500 to $19,999 | 0 (0.0%) | 3 (4.6%) |
| $20,000 to $22,499 | 2 (2.9%) | 12 (18.5%) |
| $22,500 to $24,999 | 0 (0.0%) | 1 (1.5%) |
| $25,000 to $29,999 | 4 (5.9%) | 1 (1.5%) |
| $30,000 to $34,999 | 2 (2.9%) | 2 (3.1%) |
| $35,000 to $39,999 | 8 (11.8%) | 0 (0.0%) |
| $40,000 to $44,999 | 8 (11.8%) | 11 (16.9%) |
| $45,000 to $49,999 | 1 (1.5%) | 4 (6.1%) |
| $50,000 to $54,999 | 0 (0.0%) | 0 (0.0%) |
| $55,000 to $64,999 | 11 (16.2%) | 6 (9.2%) |
| $65,000 to $74,999 | 9 (13.2%) | 5 (7.7%) |
| $75,000 to $99,999 | 2 (2.9%) | 2 (3.1%) |
| $100,000+ | 4 (5.9%) | 4 (6.1%) |
| Total | 68 (100.0%) | 65 (100.0%) |
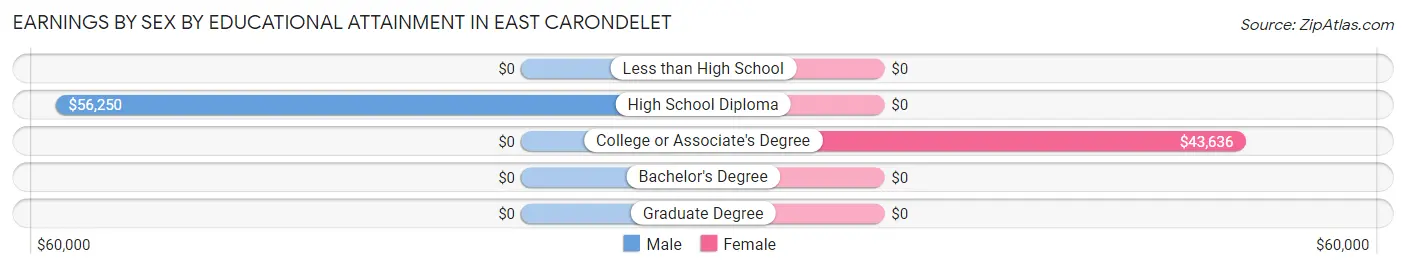
Earnings by Sex by Educational Attainment in East Carondelet
Average earnings in East Carondelet are $46,250 for men and $43,295 for women, a difference of 6.4%. Men with an educational attainment of high school diploma enjoy the highest average annual earnings of $56,250, while those with high school diploma education earn the least with $56,250. Women with an educational attainment of college or associate's degree earn the most with the average annual earnings of $43,636, while those with college or associate's degree education have the smallest earnings of $43,636.
| Educational Attainment | Male Income | Female Income |
| Less than High School | - | - |
| High School Diploma | $56,250 | $0 |
| College or Associate's Degree | - | - |
| Bachelor's Degree | - | - |
| Graduate Degree | - | - |
| Total | $46,250 | $43,295 |
Family Income in East Carondelet
Family Income Brackets in East Carondelet
According to the East Carondelet family income data, there are 12 families falling into the $50,000 to $74,999 income range, which is the most common income bracket and makes up 20.3% of all families. Conversely, the $10,000 to $14,999 income bracket is the least frequent group with only 1 families (1.7%) belonging to this category.
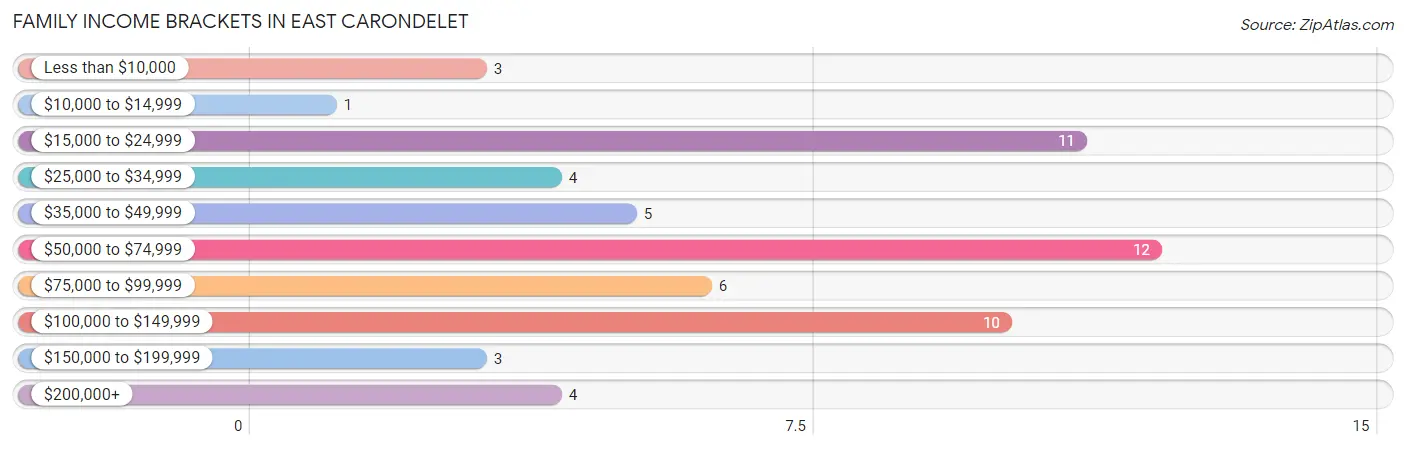
| Income Bracket | # Families | % Families |
| Less than $10,000 | 3 | 5.1% |
| $10,000 to $14,999 | 1 | 1.7% |
| $15,000 to $24,999 | 11 | 18.6% |
| $25,000 to $34,999 | 4 | 6.8% |
| $35,000 to $49,999 | 5 | 8.5% |
| $50,000 to $74,999 | 12 | 20.3% |
| $75,000 to $99,999 | 6 | 10.2% |
| $100,000 to $149,999 | 10 | 16.9% |
| $150,000 to $199,999 | 3 | 5.1% |
| $200,000+ | 4 | 6.8% |
Family Income by Famaliy Size in East Carondelet
2-person families (23 | 39.0%) account for the highest median family income in East Carondelet with $47,917 per family, while 2-person families (23 | 39.0%) have the highest median income of $23,958 per family member.
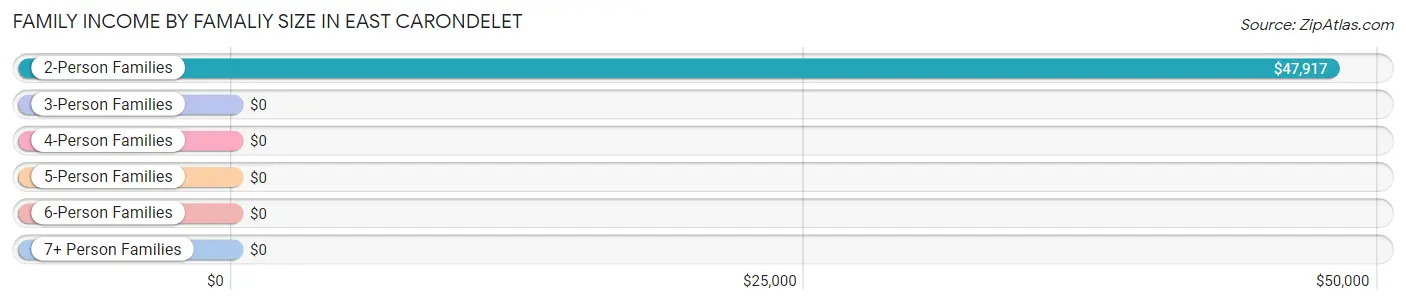
| Income Bracket | # Families | Median Income |
| 2-Person Families | 23 (39.0%) | $47,917 |
| 3-Person Families | 12 (20.3%) | $0 |
| 4-Person Families | 15 (25.4%) | $0 |
| 5-Person Families | 7 (11.9%) | $0 |
| 6-Person Families | 2 (3.4%) | $0 |
| 7+ Person Families | 0 (0.0%) | $0 |
| Total | 59 (100.0%) | $63,750 |
Family Income by Number of Earners in East Carondelet
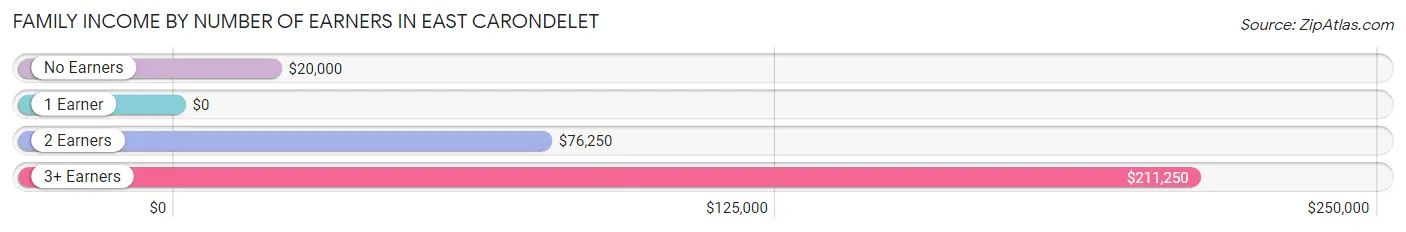
| Number of Earners | # Families | Median Income |
| No Earners | 12 (20.3%) | $20,000 |
| 1 Earner | 17 (28.8%) | $0 |
| 2 Earners | 24 (40.7%) | $76,250 |
| 3+ Earners | 6 (10.2%) | $211,250 |
| Total | 59 (100.0%) | $63,750 |
Household Income in East Carondelet
Household Income Brackets in East Carondelet
With 26 households falling in the category, the $50,000 to $74,999 income range is the most frequent in East Carondelet, accounting for 25.5% of all households. In contrast, only 3 households (2.9%) fall into the $150,000 to $199,999 income bracket, making it the least populous group.
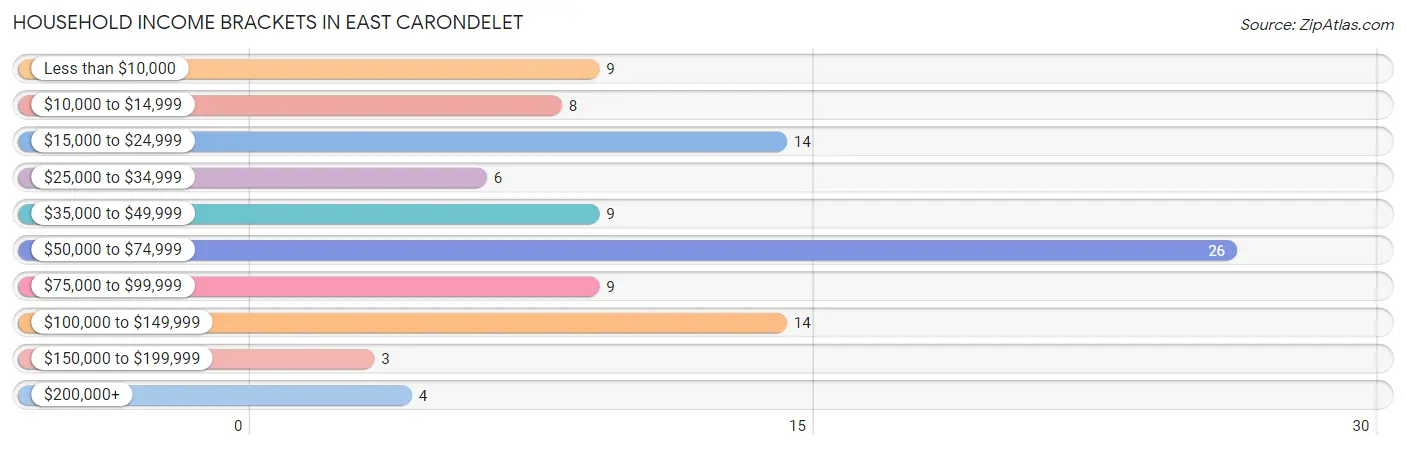
| Income Bracket | # Households | % Households |
| Less than $10,000 | 9 | 8.8% |
| $10,000 to $14,999 | 8 | 7.8% |
| $15,000 to $24,999 | 14 | 13.7% |
| $25,000 to $34,999 | 6 | 5.9% |
| $35,000 to $49,999 | 9 | 8.8% |
| $50,000 to $74,999 | 26 | 25.5% |
| $75,000 to $99,999 | 9 | 8.8% |
| $100,000 to $149,999 | 14 | 13.7% |
| $150,000 to $199,999 | 3 | 2.9% |
| $200,000+ | 4 | 3.9% |
Household Income by Householder Age in East Carondelet
The median household income in East Carondelet is $57,000, with the highest median household income of $63,929 found in the 45 to 64 years age bracket for the primary householder. A total of 44 households (43.1%) fall into this category. Meanwhile, the 15 to 24 years age bracket for the primary householder has the lowest median household income of $0, with 3 households (2.9%) in this group.
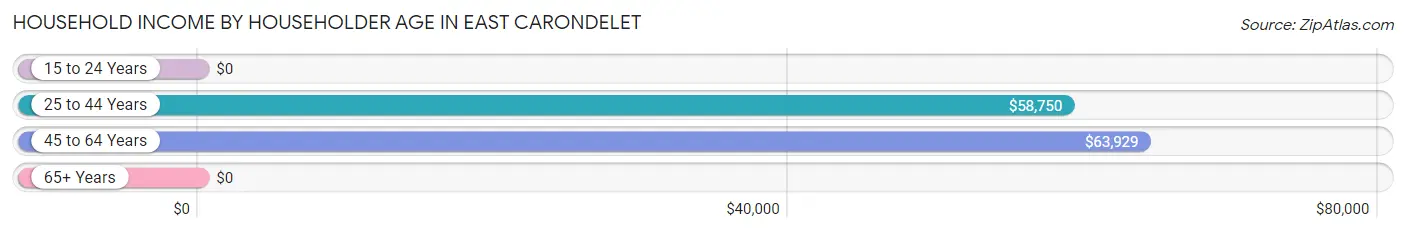
| Income Bracket | # Households | Median Income |
| 15 to 24 Years | 3 (2.9%) | $0 |
| 25 to 44 Years | 24 (23.5%) | $58,750 |
| 45 to 64 Years | 44 (43.1%) | $63,929 |
| 65+ Years | 31 (30.4%) | $0 |
| Total | 102 (100.0%) | $57,000 |
Poverty in East Carondelet
Income Below Poverty by Sex and Age in East Carondelet
With 8.7% poverty level for males and 35.5% for females among the residents of East Carondelet, 75 year old and over males and 15 year old females are the most vulnerable to poverty, with 2 males (40.0%) and 3 females (100.0%) in their respective age groups living below the poverty level.
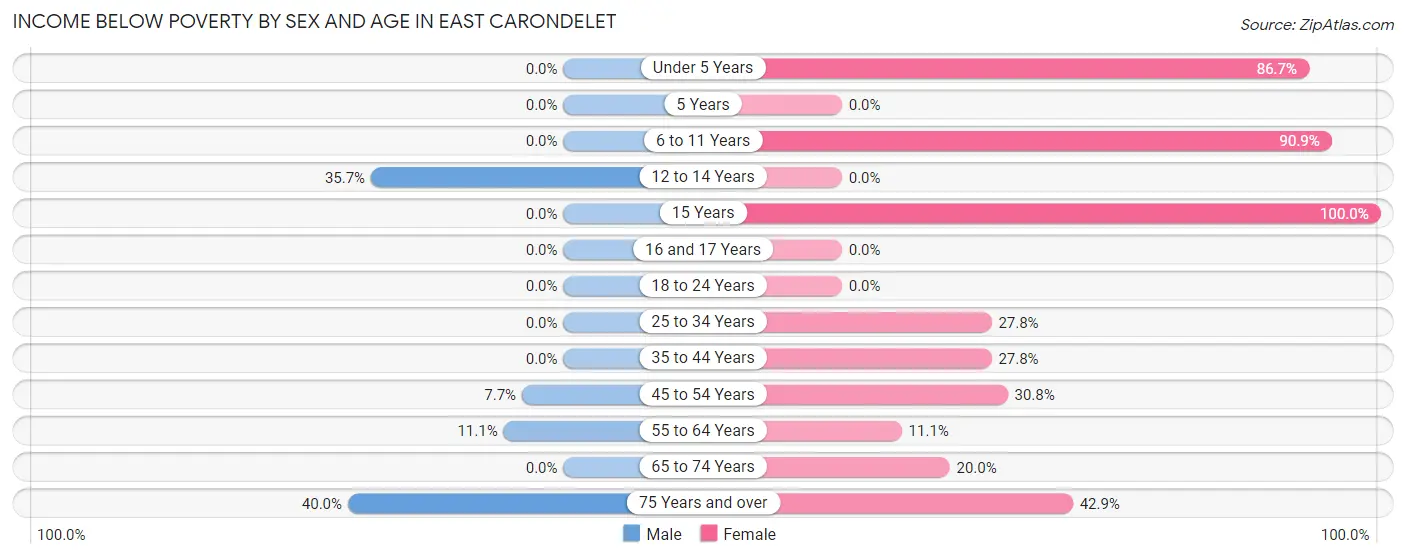
| Age Bracket | Male | Female |
| Under 5 Years | 0 (0.0%) | 13 (86.7%) |
| 5 Years | 0 (0.0%) | 0 (0.0%) |
| 6 to 11 Years | 0 (0.0%) | 10 (90.9%) |
| 12 to 14 Years | 5 (35.7%) | 0 (0.0%) |
| 15 Years | 0 (0.0%) | 3 (100.0%) |
| 16 and 17 Years | 0 (0.0%) | 0 (0.0%) |
| 18 to 24 Years | 0 (0.0%) | 0 (0.0%) |
| 25 to 34 Years | 0 (0.0%) | 5 (27.8%) |
| 35 to 44 Years | 0 (0.0%) | 5 (27.8%) |
| 45 to 54 Years | 1 (7.7%) | 8 (30.8%) |
| 55 to 64 Years | 2 (11.1%) | 1 (11.1%) |
| 65 to 74 Years | 0 (0.0%) | 3 (20.0%) |
| 75 Years and over | 2 (40.0%) | 6 (42.9%) |
| Total | 10 (8.7%) | 54 (35.5%) |
Income Above Poverty by Sex and Age in East Carondelet
According to the poverty statistics in East Carondelet, males aged 5 years and females aged 5 years are the age groups that are most secure financially, with 100.0% of males and 100.0% of females in these age groups living above the poverty line.
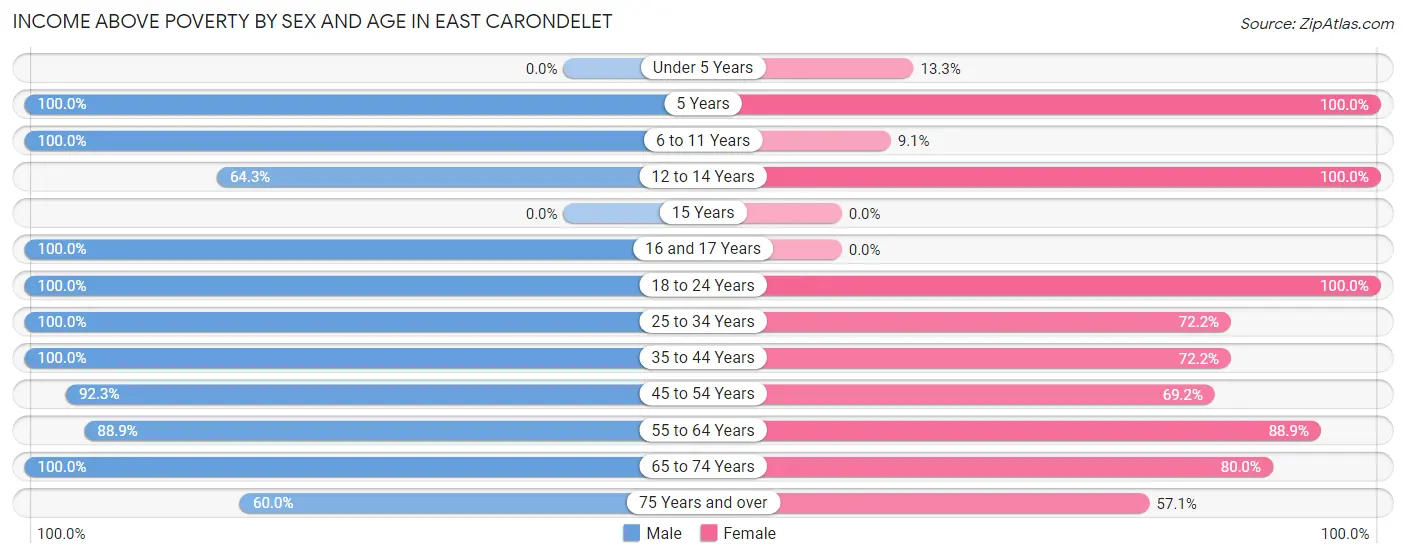
| Age Bracket | Male | Female |
| Under 5 Years | 0 (0.0%) | 2 (13.3%) |
| 5 Years | 1 (100.0%) | 2 (100.0%) |
| 6 to 11 Years | 2 (100.0%) | 1 (9.1%) |
| 12 to 14 Years | 9 (64.3%) | 13 (100.0%) |
| 15 Years | 0 (0.0%) | 0 (0.0%) |
| 16 and 17 Years | 2 (100.0%) | 0 (0.0%) |
| 18 to 24 Years | 18 (100.0%) | 8 (100.0%) |
| 25 to 34 Years | 21 (100.0%) | 13 (72.2%) |
| 35 to 44 Years | 9 (100.0%) | 13 (72.2%) |
| 45 to 54 Years | 12 (92.3%) | 18 (69.2%) |
| 55 to 64 Years | 16 (88.9%) | 8 (88.9%) |
| 65 to 74 Years | 12 (100.0%) | 12 (80.0%) |
| 75 Years and over | 3 (60.0%) | 8 (57.1%) |
| Total | 105 (91.3%) | 98 (64.5%) |
Income Below Poverty Among Married-Couple Families in East Carondelet
The poverty statistics for married-couple families in East Carondelet show that 8.8% or 3 of the total 34 families live below the poverty line. Families with no children have the highest poverty rate of 12.5%, comprising of 3 families. On the other hand, families with 1 or 2 children have the lowest poverty rate of 0.0%, which includes 0 families.
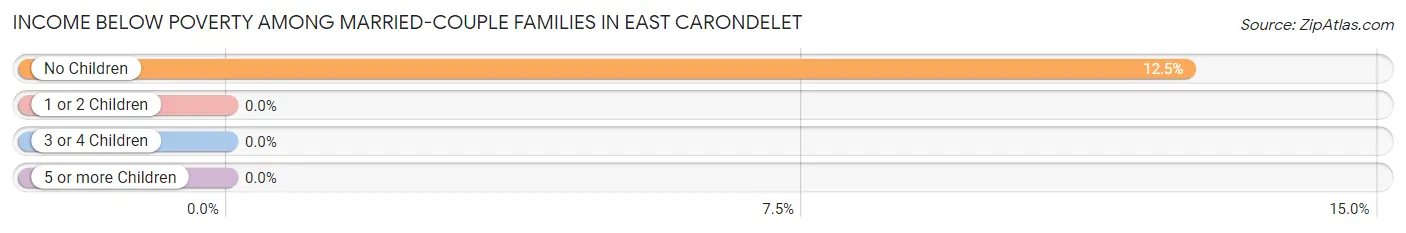
| Children | Above Poverty | Below Poverty |
| No Children | 21 (87.5%) | 3 (12.5%) |
| 1 or 2 Children | 9 (100.0%) | 0 (0.0%) |
| 3 or 4 Children | 1 (100.0%) | 0 (0.0%) |
| 5 or more Children | 0 (0.0%) | 0 (0.0%) |
| Total | 31 (91.2%) | 3 (8.8%) |
Income Below Poverty Among Single-Parent Households in East Carondelet
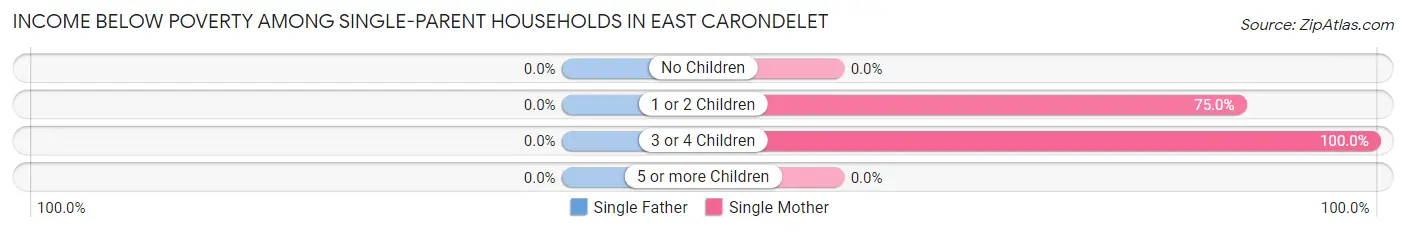
| Children | Single Father | Single Mother |
| No Children | 0 (0.0%) | 0 (0.0%) |
| 1 or 2 Children | 0 (0.0%) | 6 (75.0%) |
| 3 or 4 Children | 0 (0.0%) | 4 (100.0%) |
| 5 or more Children | 0 (0.0%) | 0 (0.0%) |
| Total | 0 (0.0%) | 10 (62.5%) |
Income Below Poverty Among Married-Couple vs Single-Parent Households in East Carondelet
The poverty data for East Carondelet shows that 3 of the married-couple family households (8.8%) and 10 of the single-parent households (40.0%) are living below the poverty level. Within the married-couple family households, those with no children have the highest poverty rate, with 3 households (12.5%) falling below the poverty line. Among the single-parent households, those with 3 or 4 children have the highest poverty rate, with 4 household (100.0%) living below poverty.
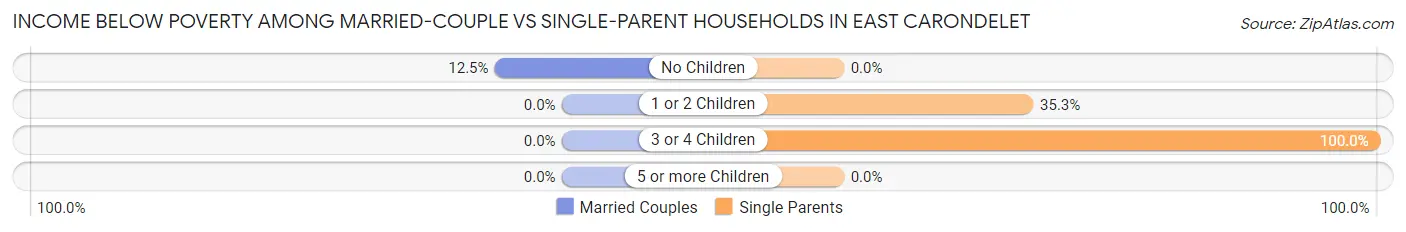
| Children | Married-Couple Families | Single-Parent Households |
| No Children | 3 (12.5%) | 0 (0.0%) |
| 1 or 2 Children | 0 (0.0%) | 6 (35.3%) |
| 3 or 4 Children | 0 (0.0%) | 4 (100.0%) |
| 5 or more Children | 0 (0.0%) | 0 (0.0%) |
| Total | 3 (8.8%) | 10 (40.0%) |
Race in East Carondelet
The most populous races in East Carondelet are White / Caucasian (198 | 74.2%), Black / African American (56 | 21.0%), and Two or more Races (13 | 4.9%).
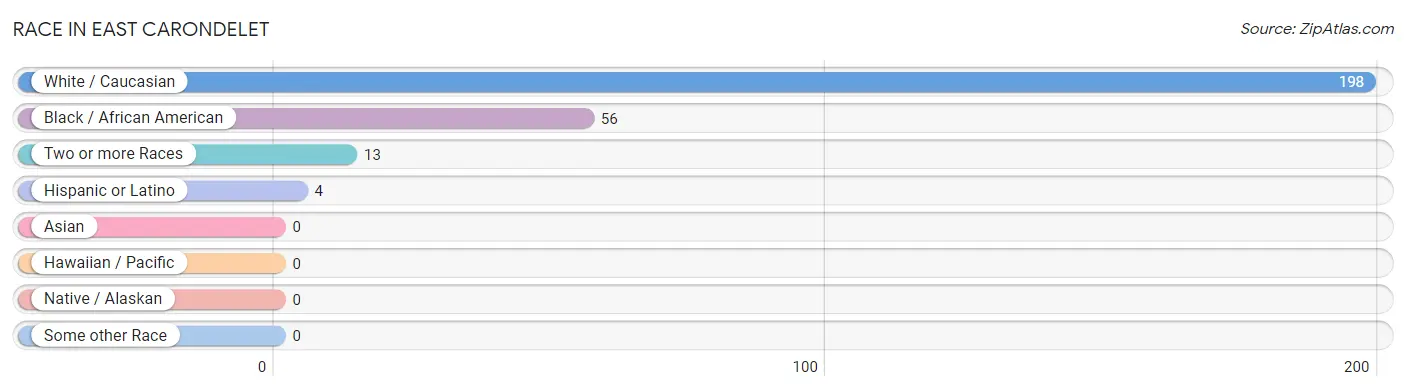
| Race | # Population | % Population |
| Asian | 0 | 0.0% |
| Black / African American | 56 | 21.0% |
| Hawaiian / Pacific | 0 | 0.0% |
| Hispanic or Latino | 4 | 1.5% |
| Native / Alaskan | 0 | 0.0% |
| White / Caucasian | 198 | 74.2% |
| Two or more Races | 13 | 4.9% |
| Some other Race | 0 | 0.0% |
| Total | 267 | 100.0% |
Ancestry in East Carondelet
The most populous ancestries reported in East Carondelet are Irish (28 | 10.5%), German (26 | 9.7%), Italian (11 | 4.1%), English (10 | 3.7%), and French (9 | 3.4%), together accounting for 31.5% of all East Carondelet residents.
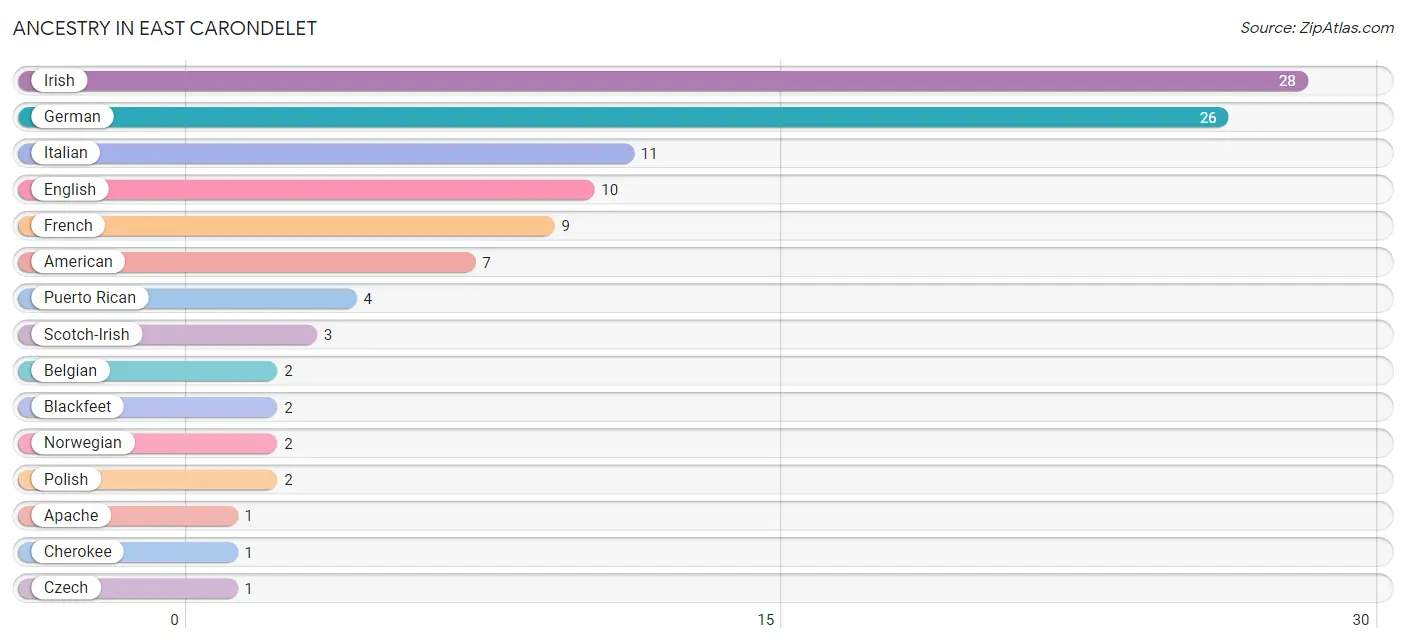
| Ancestry | # Population | % Population |
| American | 7 | 2.6% |
| Apache | 1 | 0.4% |
| Belgian | 2 | 0.7% |
| Blackfeet | 2 | 0.7% |
| Cherokee | 1 | 0.4% |
| Czech | 1 | 0.4% |
| English | 10 | 3.7% |
| French | 9 | 3.4% |
| German | 26 | 9.7% |
| Irish | 28 | 10.5% |
| Italian | 11 | 4.1% |
| Norwegian | 2 | 0.7% |
| Polish | 2 | 0.7% |
| Puerto Rican | 4 | 1.5% |
| Scotch-Irish | 3 | 1.1% | View All 15 Rows |
Immigrants in East Carondelet

| Immigration Origin | # Population | % Population | View All 0 Rows |
Sex and Age in East Carondelet
Sex and Age in East Carondelet
The most populous age groups in East Carondelet are 20 to 24 Years (17 | 14.8%) for men and 10 to 14 Years (18 | 11.8%) for women.
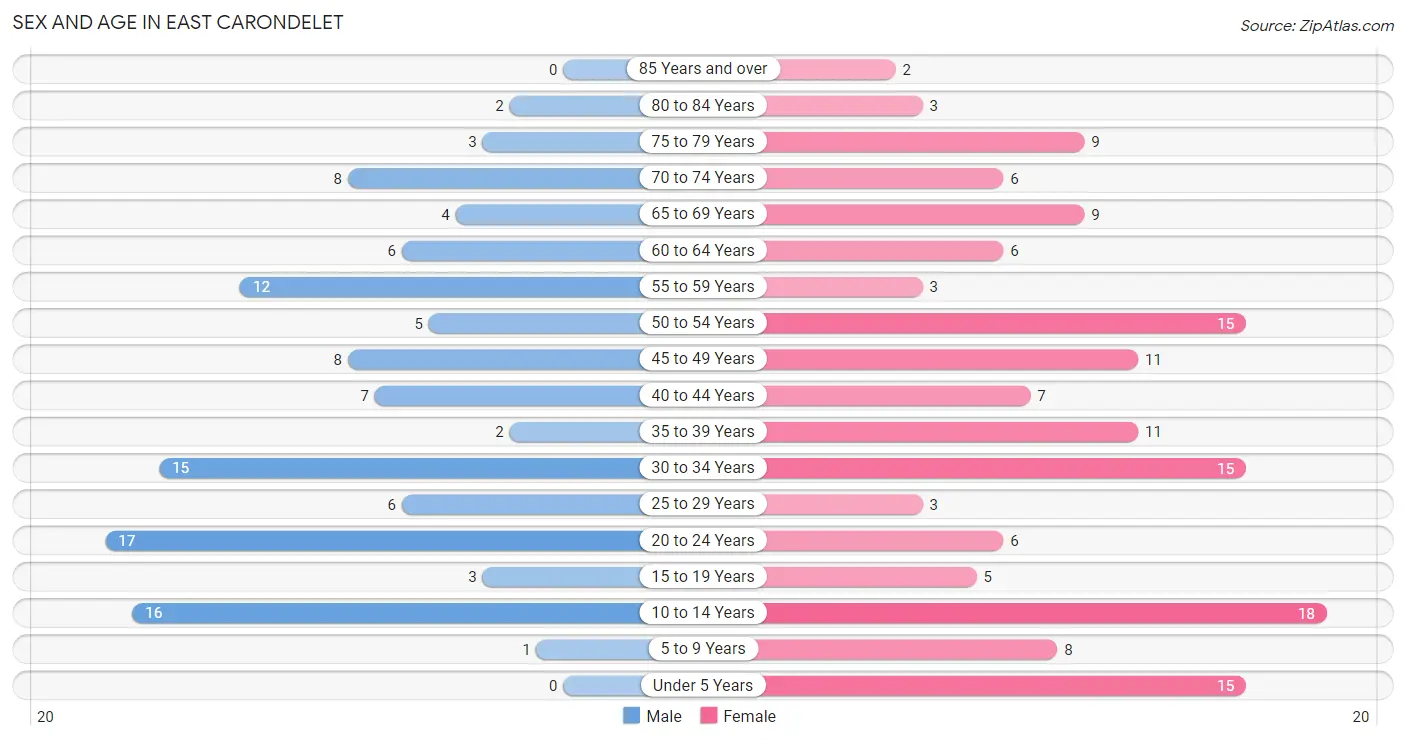
| Age Bracket | Male | Female |
| Under 5 Years | 0 (0.0%) | 15 (9.9%) |
| 5 to 9 Years | 1 (0.9%) | 8 (5.3%) |
| 10 to 14 Years | 16 (13.9%) | 18 (11.8%) |
| 15 to 19 Years | 3 (2.6%) | 5 (3.3%) |
| 20 to 24 Years | 17 (14.8%) | 6 (4.0%) |
| 25 to 29 Years | 6 (5.2%) | 3 (2.0%) |
| 30 to 34 Years | 15 (13.0%) | 15 (9.9%) |
| 35 to 39 Years | 2 (1.7%) | 11 (7.2%) |
| 40 to 44 Years | 7 (6.1%) | 7 (4.6%) |
| 45 to 49 Years | 8 (7.0%) | 11 (7.2%) |
| 50 to 54 Years | 5 (4.3%) | 15 (9.9%) |
| 55 to 59 Years | 12 (10.4%) | 3 (2.0%) |
| 60 to 64 Years | 6 (5.2%) | 6 (4.0%) |
| 65 to 69 Years | 4 (3.5%) | 9 (5.9%) |
| 70 to 74 Years | 8 (7.0%) | 6 (4.0%) |
| 75 to 79 Years | 3 (2.6%) | 9 (5.9%) |
| 80 to 84 Years | 2 (1.7%) | 3 (2.0%) |
| 85 Years and over | 0 (0.0%) | 2 (1.3%) |
| Total | 115 (100.0%) | 152 (100.0%) |
Families and Households in East Carondelet
Median Family Size in East Carondelet
The median family size in East Carondelet is 3.61 persons per family, with single male/father families (9 | 15.2%) accounting for the largest median family size of 3.78 persons per family. On the other hand, single female/mother families (16 | 27.1%) represent the smallest median family size with 3.38 persons per family.
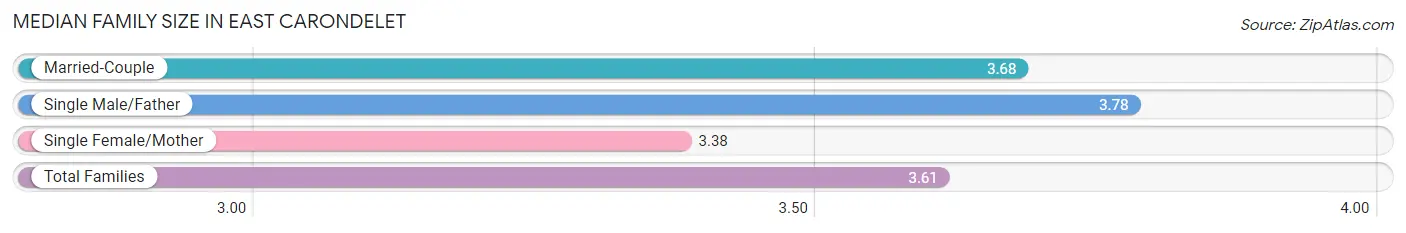
| Family Type | # Families | Family Size |
| Married-Couple | 34 (57.6%) | 3.68 |
| Single Male/Father | 9 (15.2%) | 3.78 |
| Single Female/Mother | 16 (27.1%) | 3.38 |
| Total Families | 59 (100.0%) | 3.61 |
Median Household Size in East Carondelet
The median household size in East Carondelet is 2.62 persons per household, with single male/father households (9 | 8.8%) accounting for the largest median household size of 4 persons per household. non-family households (43 | 42.2%) represent the smallest median household size with 1.14 persons per household.
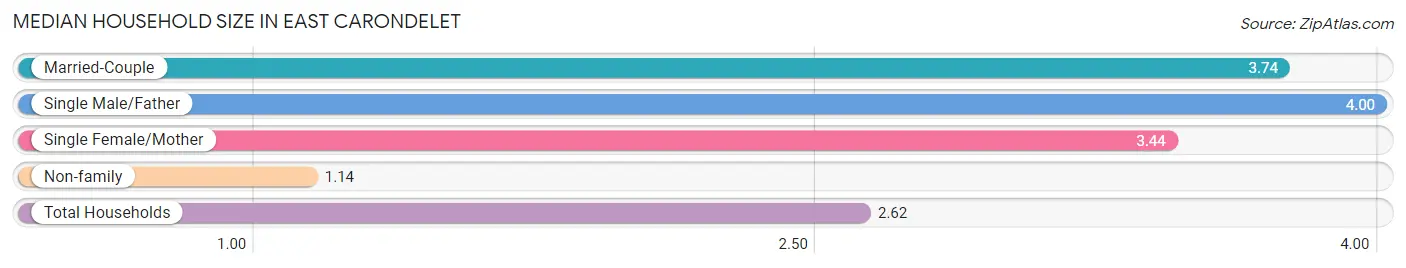
| Household Type | # Households | Household Size |
| Married-Couple | 34 (33.3%) | 3.74 |
| Single Male/Father | 9 (8.8%) | 4.00 |
| Single Female/Mother | 16 (15.7%) | 3.44 |
| Non-family | 43 (42.2%) | 1.14 |
| Total Households | 102 (100.0%) | 2.62 |
Household Size by Marriage Status in East Carondelet
Out of a total of 102 households in East Carondelet, 59 (57.8%) are family households, while 43 (42.2%) are nonfamily households. The most numerous type of family households are 2-person households, comprising 20, and the most common type of nonfamily households are 1-person households, comprising 38.
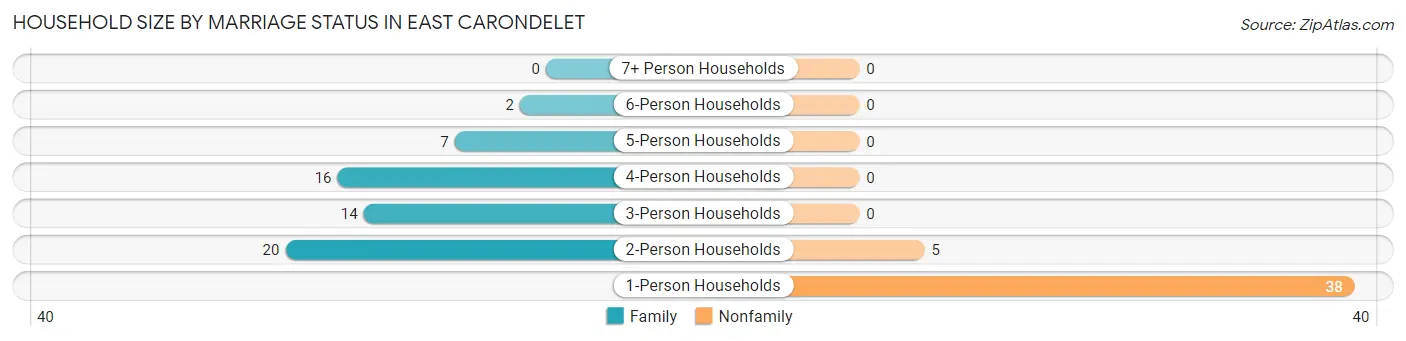
| Household Size | Family Households | Nonfamily Households |
| 1-Person Households | - | 38 (37.2%) |
| 2-Person Households | 20 (19.6%) | 5 (4.9%) |
| 3-Person Households | 14 (13.7%) | 0 (0.0%) |
| 4-Person Households | 16 (15.7%) | 0 (0.0%) |
| 5-Person Households | 7 (6.9%) | 0 (0.0%) |
| 6-Person Households | 2 (2.0%) | 0 (0.0%) |
| 7+ Person Households | 0 (0.0%) | 0 (0.0%) |
| Total | 59 (57.8%) | 43 (42.2%) |
Female Fertility in East Carondelet
Fertility by Age in East Carondelet
| Age Bracket | Women with Births | Births / 1,000 Women |
| 15 to 19 years | 0 (0.0%) | 0.0 |
| 20 to 34 years | 0 (0.0%) | 0.0 |
| 35 to 50 years | 0 (0.0%) | 0.0 |
| Total | 0 (0.0%) | 0.0 |
Fertility by Age by Marriage Status in East Carondelet
| Age Bracket | Married | Unmarried |
| 15 to 19 years | 0 (0.0%) | 0 (0.0%) |
| 20 to 34 years | 0 (0.0%) | 0 (0.0%) |
| 35 to 50 years | 0 (0.0%) | 0 (0.0%) |
| Total | 0 (0.0%) | 0 (0.0%) |
Fertility by Education in East Carondelet
| Educational Attainment | Women with Births | Births / 1,000 Women |
| Less than High School | 0 (0.0%) | 0.0 |
| High School Diploma | 0 (0.0%) | 0.0 |
| College or Associate's Degree | 0 (0.0%) | 0.0 |
| Bachelor's Degree | 0 (0.0%) | 0.0 |
| Graduate Degree | 0 (0.0%) | 0.0 |
| Total | 0 (0.0%) | 0.0 |
Fertility by Education by Marriage Status in East Carondelet
| Educational Attainment | Married | Unmarried |
| Less than High School | 0 (0.0%) | 0 (0.0%) |
| High School Diploma | 0 (0.0%) | 0 (0.0%) |
| College or Associate's Degree | 0 (0.0%) | 0 (0.0%) |
| Bachelor's Degree | 0 (0.0%) | 0 (0.0%) |
| Graduate Degree | 0 (0.0%) | 0 (0.0%) |
| Total | 0 (0.0%) | 0 (0.0%) |
Employment Characteristics in East Carondelet
Employment by Class of Employer in East Carondelet
Among the 127 employed individuals in East Carondelet, private company employees (114 | 89.8%), self-employed (not incorporated) (6 | 4.7%), and not-for-profit organizations (4 | 3.2%) make up the most common classes of employment.
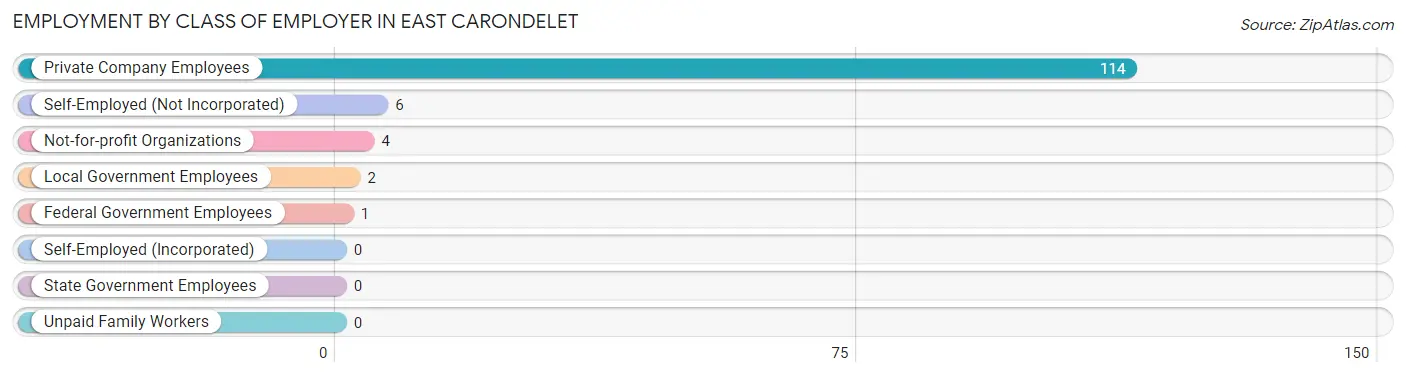
| Employer Class | # Employees | % Employees |
| Private Company Employees | 114 | 89.8% |
| Self-Employed (Incorporated) | 0 | 0.0% |
| Self-Employed (Not Incorporated) | 6 | 4.7% |
| Not-for-profit Organizations | 4 | 3.2% |
| Local Government Employees | 2 | 1.6% |
| State Government Employees | 0 | 0.0% |
| Federal Government Employees | 1 | 0.8% |
| Unpaid Family Workers | 0 | 0.0% |
| Total | 127 | 100.0% |
Employment Status by Age in East Carondelet
According to the labor force statistics for East Carondelet, out of the total population over 16 years of age (206), 65.0% or 134 individuals are in the labor force, with 4.5% or 6 of them unemployed. The age group with the highest labor force participation rate is 20 to 24 years, with 100.0% or 23 individuals in the labor force. Within the labor force, the 25 to 29 years age range has the highest percentage of unemployed individuals, with 14.3% or 1 of them being unemployed.
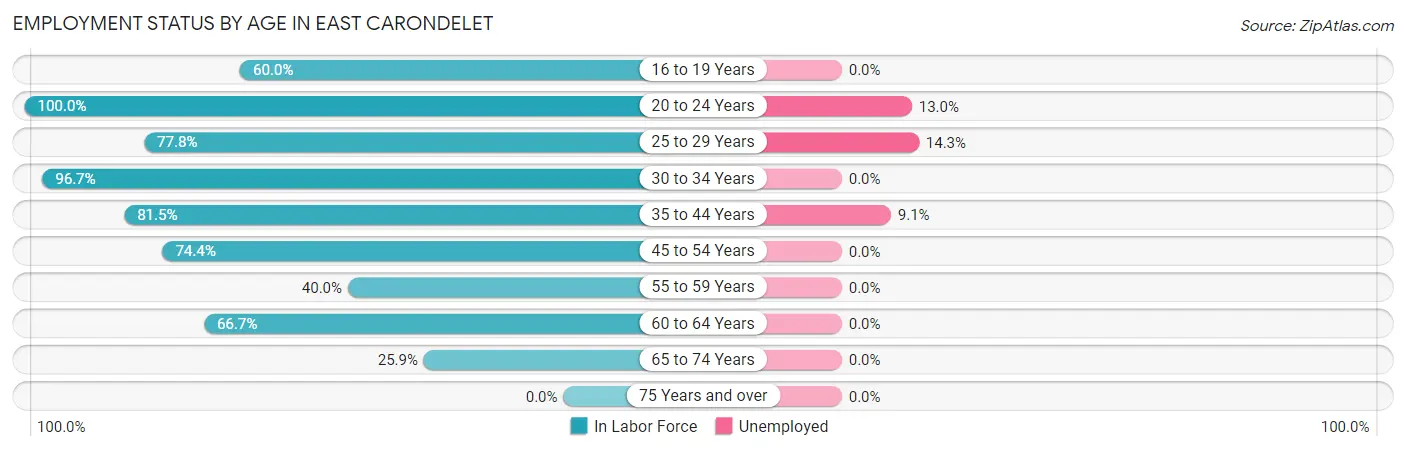
| Age Bracket | In Labor Force | Unemployed |
| 16 to 19 Years | 3 (60.0%) | 0 (0.0%) |
| 20 to 24 Years | 23 (100.0%) | 3 (13.0%) |
| 25 to 29 Years | 7 (77.8%) | 1 (14.3%) |
| 30 to 34 Years | 29 (96.7%) | 0 (0.0%) |
| 35 to 44 Years | 22 (81.5%) | 2 (9.1%) |
| 45 to 54 Years | 29 (74.4%) | 0 (0.0%) |
| 55 to 59 Years | 6 (40.0%) | 0 (0.0%) |
| 60 to 64 Years | 8 (66.7%) | 0 (0.0%) |
| 65 to 74 Years | 7 (25.9%) | 0 (0.0%) |
| 75 Years and over | 0 (0.0%) | 0 (0.0%) |
| Total | 134 (65.0%) | 6 (4.5%) |
Employment Status by Educational Attainment in East Carondelet
According to labor force statistics for East Carondelet, 76.5% of individuals (101) out of the total population between 25 and 64 years of age (132) are in the labor force, with 3.0% or 3 of them being unemployed. The group with the highest labor force participation rate are those with the educational attainment of college / associate degree, with 79.3% or 46 individuals in the labor force. Within the labor force, individuals with high school diploma education have the highest percentage of unemployment, with 5.7% or 2 of them being unemployed.
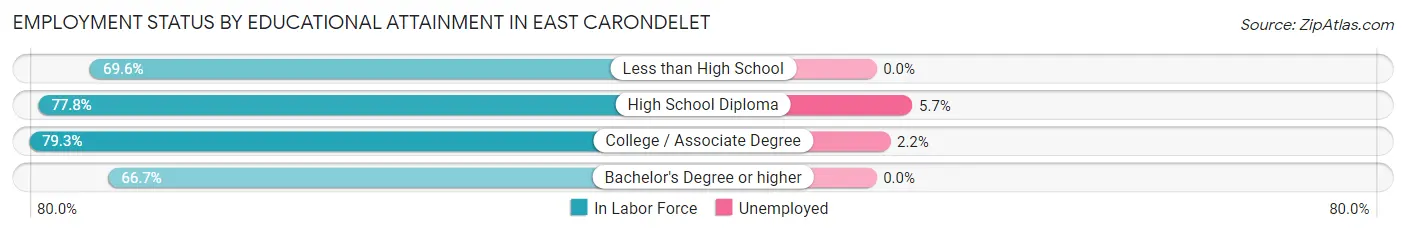
| Educational Attainment | In Labor Force | Unemployed |
| Less than High School | 16 (69.6%) | 0 (0.0%) |
| High School Diploma | 35 (77.8%) | 3 (5.7%) |
| College / Associate Degree | 46 (79.3%) | 1 (2.2%) |
| Bachelor's Degree or higher | 4 (66.7%) | 0 (0.0%) |
| Total | 101 (76.5%) | 4 (3.0%) |
Employment Occupations by Sex in East Carondelet
Management, Business, Science and Arts Occupations
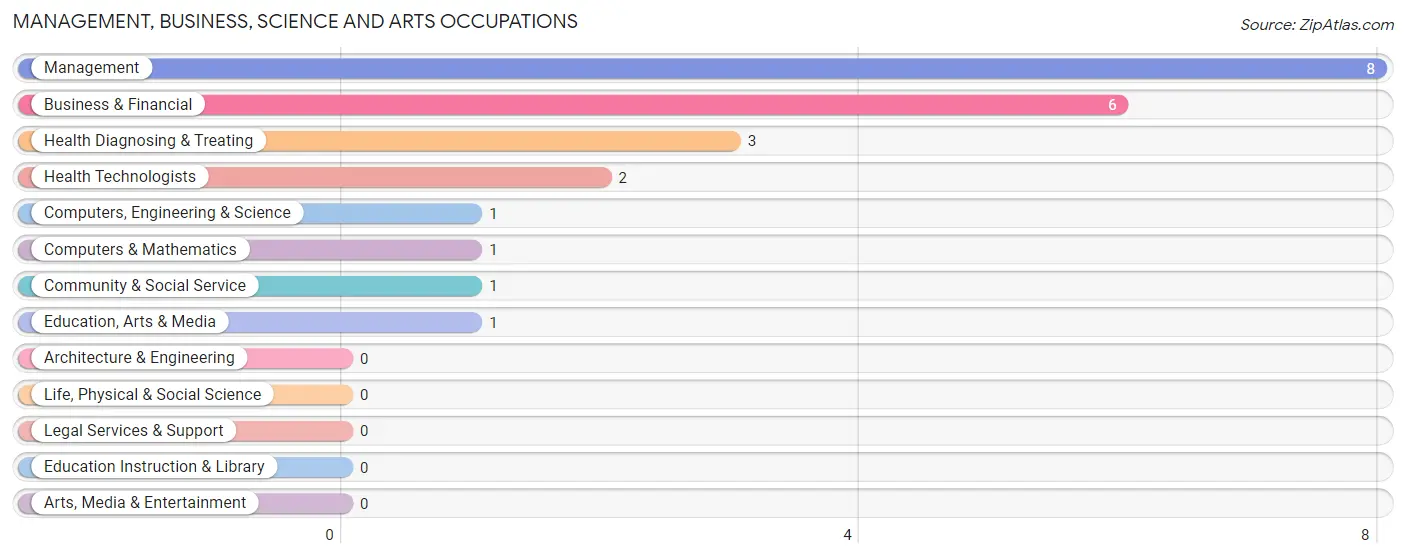
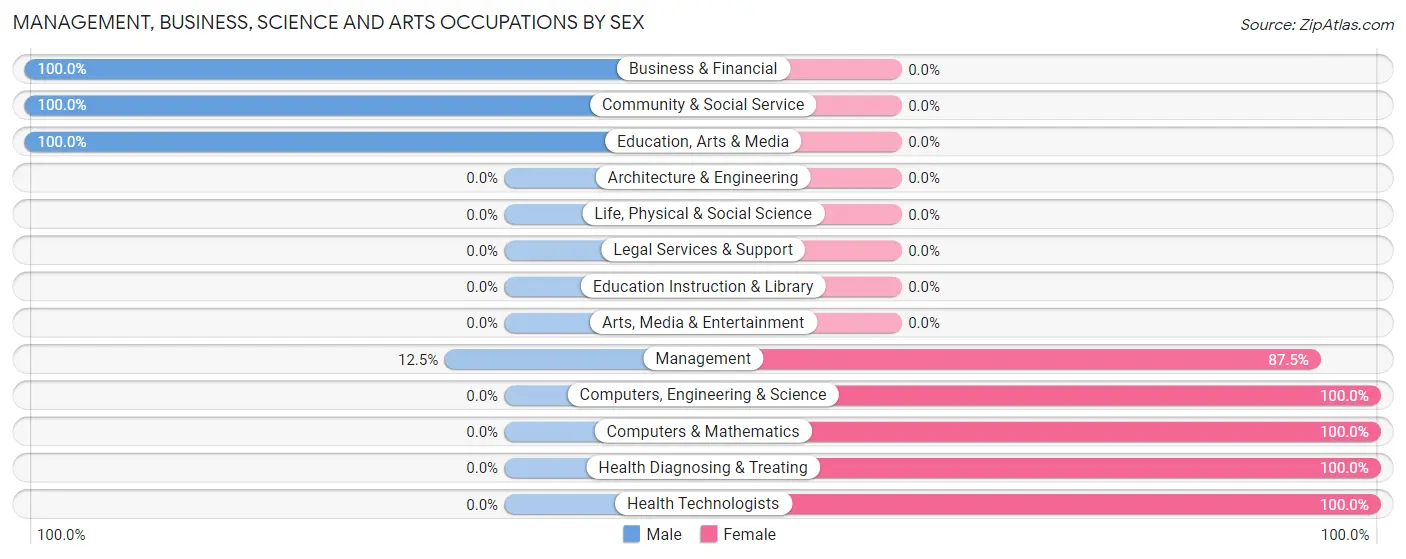
The most common Management, Business, Science and Arts occupations in East Carondelet are Management (8 | 6.2%), Business & Financial (6 | 4.7%), Health Diagnosing & Treating (3 | 2.3%), Health Technologists (2 | 1.6%), and Computers, Engineering & Science (1 | 0.8%).
Management, Business, Science and Arts Occupations by Sex
Within the Management, Business, Science and Arts occupations in East Carondelet, the most male-oriented occupations are Business & Financial (100.0%), Community & Social Service (100.0%), and Education, Arts & Media (100.0%), while the most female-oriented occupations are Computers, Engineering & Science (100.0%), Computers & Mathematics (100.0%), and Health Diagnosing & Treating (100.0%).
| Occupation | Male | Female |
| Management | 1 (12.5%) | 7 (87.5%) |
| Business & Financial | 6 (100.0%) | 0 (0.0%) |
| Computers, Engineering & Science | 0 (0.0%) | 1 (100.0%) |
| Computers & Mathematics | 0 (0.0%) | 1 (100.0%) |
| Architecture & Engineering | 0 (0.0%) | 0 (0.0%) |
| Life, Physical & Social Science | 0 (0.0%) | 0 (0.0%) |
| Community & Social Service | 1 (100.0%) | 0 (0.0%) |
| Education, Arts & Media | 1 (100.0%) | 0 (0.0%) |
| Legal Services & Support | 0 (0.0%) | 0 (0.0%) |
| Education Instruction & Library | 0 (0.0%) | 0 (0.0%) |
| Arts, Media & Entertainment | 0 (0.0%) | 0 (0.0%) |
| Health Diagnosing & Treating | 0 (0.0%) | 3 (100.0%) |
| Health Technologists | 0 (0.0%) | 2 (100.0%) |
| Total (Category) | 8 (42.1%) | 11 (57.9%) |
| Total (Overall) | 66 (51.6%) | 62 (48.4%) |
Services Occupations
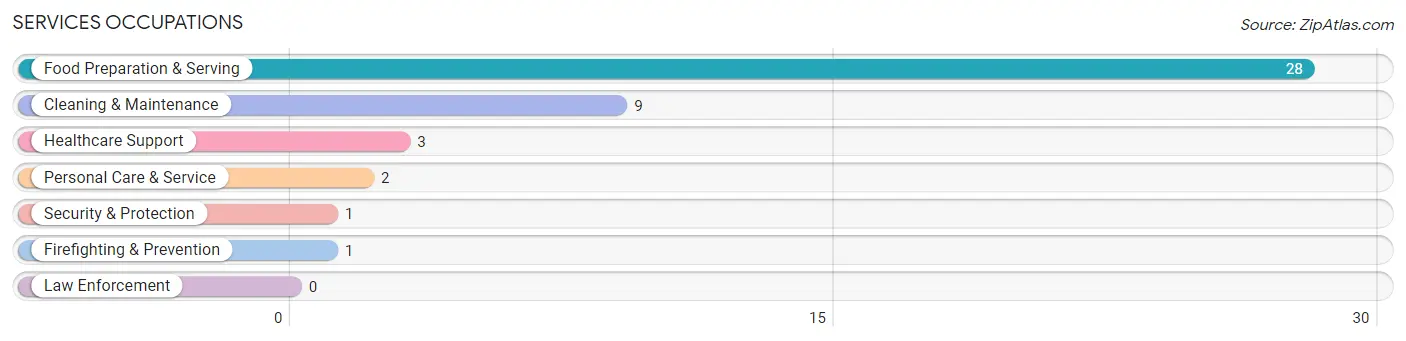
The most common Services occupations in East Carondelet are Food Preparation & Serving (28 | 21.9%), Cleaning & Maintenance (9 | 7.0%), Healthcare Support (3 | 2.3%), Personal Care & Service (2 | 1.6%), and Security & Protection (1 | 0.8%).
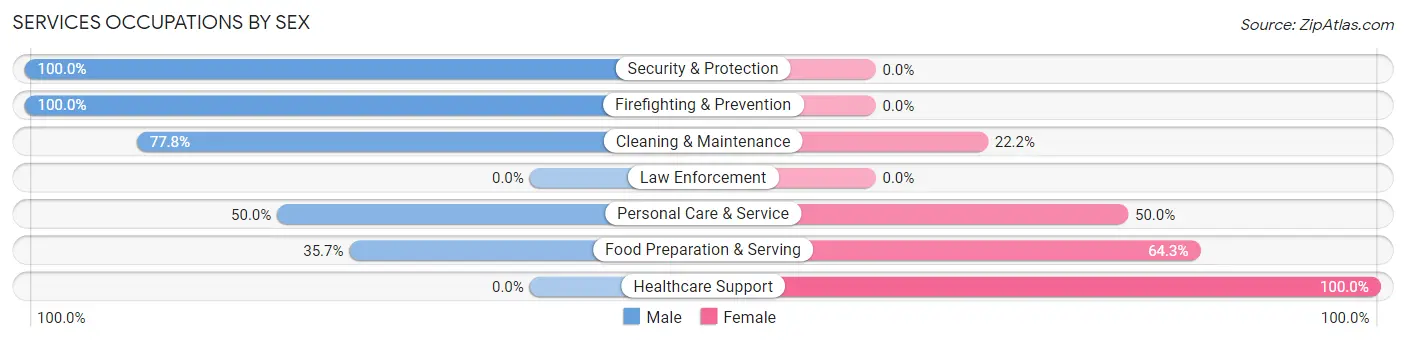
Services Occupations by Sex
Within the Services occupations in East Carondelet, the most male-oriented occupations are Security & Protection (100.0%), Firefighting & Prevention (100.0%), and Cleaning & Maintenance (77.8%), while the most female-oriented occupations are Healthcare Support (100.0%), Food Preparation & Serving (64.3%), and Personal Care & Service (50.0%).
| Occupation | Male | Female |
| Healthcare Support | 0 (0.0%) | 3 (100.0%) |
| Security & Protection | 1 (100.0%) | 0 (0.0%) |
| Firefighting & Prevention | 1 (100.0%) | 0 (0.0%) |
| Law Enforcement | 0 (0.0%) | 0 (0.0%) |
| Food Preparation & Serving | 10 (35.7%) | 18 (64.3%) |
| Cleaning & Maintenance | 7 (77.8%) | 2 (22.2%) |
| Personal Care & Service | 1 (50.0%) | 1 (50.0%) |
| Total (Category) | 19 (44.2%) | 24 (55.8%) |
| Total (Overall) | 66 (51.6%) | 62 (48.4%) |
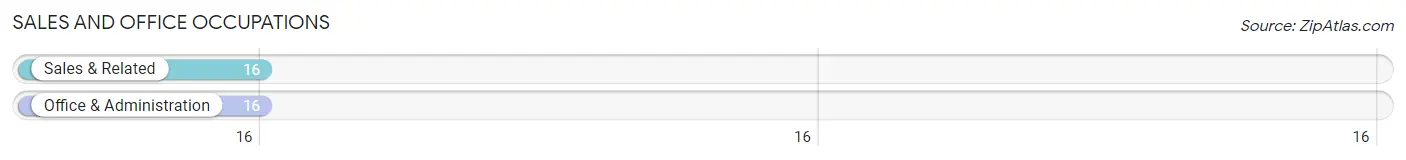
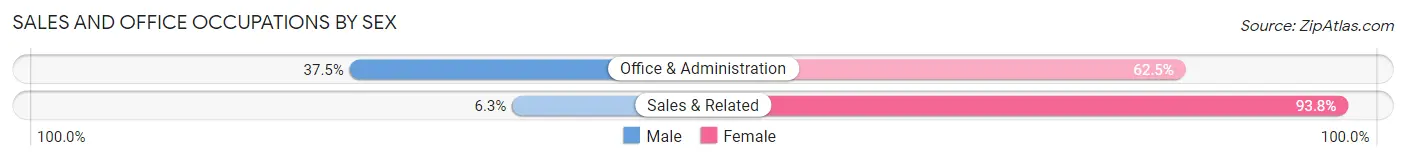
Sales and Office Occupations
The most common Sales and Office occupations in East Carondelet are Sales & Related (16 | 12.5%), and Office & Administration (16 | 12.5%).
Sales and Office Occupations by Sex
| Occupation | Male | Female |
| Sales & Related | 1 (6.2%) | 15 (93.8%) |
| Office & Administration | 6 (37.5%) | 10 (62.5%) |
| Total (Category) | 7 (21.9%) | 25 (78.1%) |
| Total (Overall) | 66 (51.6%) | 62 (48.4%) |
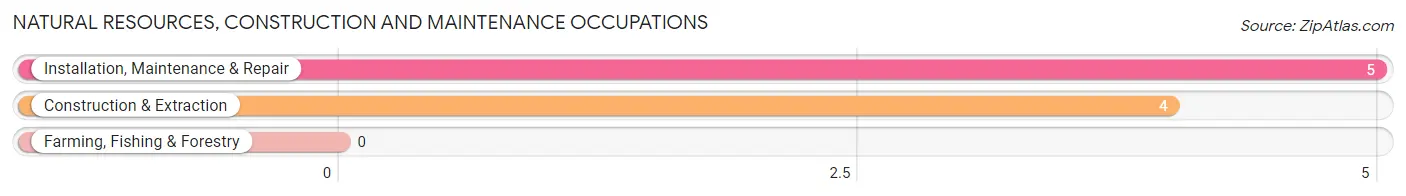
Natural Resources, Construction and Maintenance Occupations
The most common Natural Resources, Construction and Maintenance occupations in East Carondelet are Installation, Maintenance & Repair (5 | 3.9%), and Construction & Extraction (4 | 3.1%).
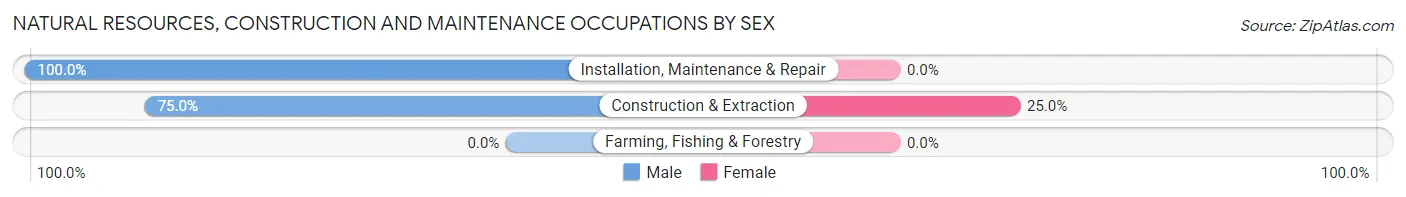
Natural Resources, Construction and Maintenance Occupations by Sex
| Occupation | Male | Female |
| Farming, Fishing & Forestry | 0 (0.0%) | 0 (0.0%) |
| Construction & Extraction | 3 (75.0%) | 1 (25.0%) |
| Installation, Maintenance & Repair | 5 (100.0%) | 0 (0.0%) |
| Total (Category) | 8 (88.9%) | 1 (11.1%) |
| Total (Overall) | 66 (51.6%) | 62 (48.4%) |
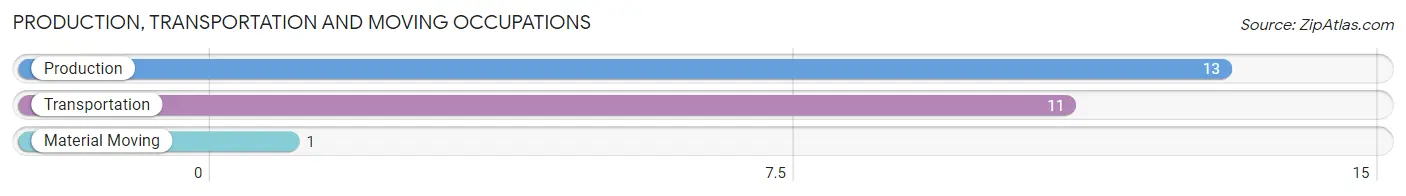
Production, Transportation and Moving Occupations
The most common Production, Transportation and Moving occupations in East Carondelet are Production (13 | 10.2%), Transportation (11 | 8.6%), and Material Moving (1 | 0.8%).
Production, Transportation and Moving Occupations by Sex
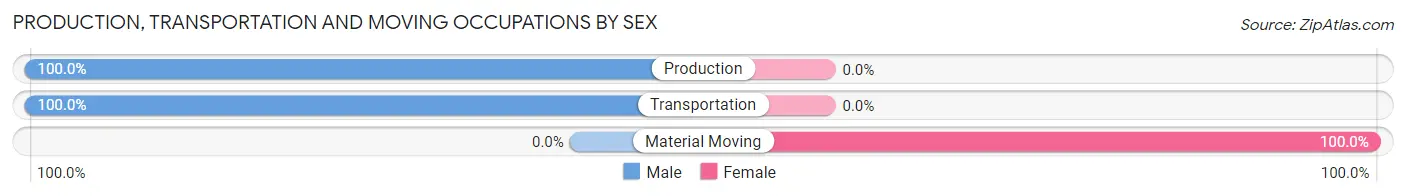
| Occupation | Male | Female |
| Production | 13 (100.0%) | 0 (0.0%) |
| Transportation | 11 (100.0%) | 0 (0.0%) |
| Material Moving | 0 (0.0%) | 1 (100.0%) |
| Total (Category) | 24 (96.0%) | 1 (4.0%) |
| Total (Overall) | 66 (51.6%) | 62 (48.4%) |
Employment Industries by Sex in East Carondelet
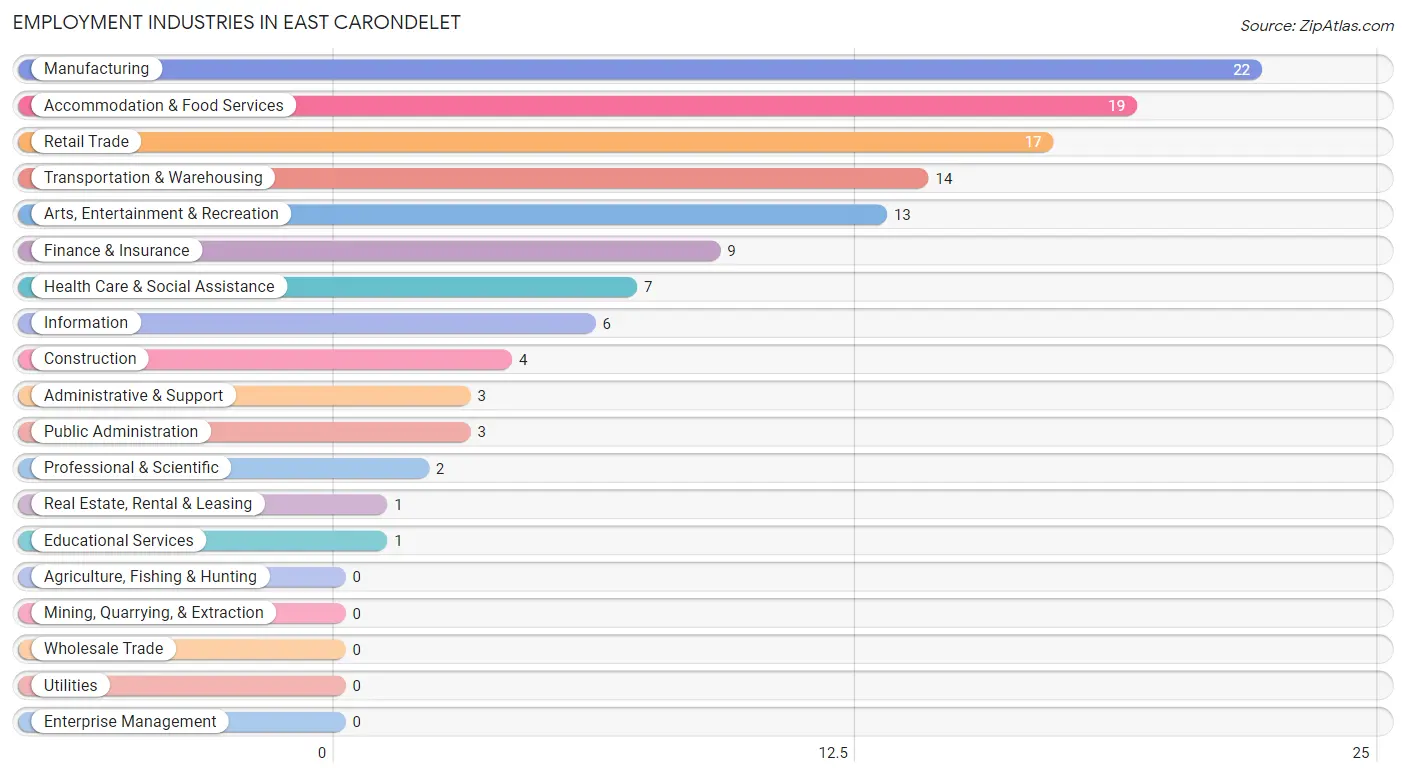
Employment Industries in East Carondelet
The major employment industries in East Carondelet include Manufacturing (22 | 17.2%), Accommodation & Food Services (19 | 14.8%), Retail Trade (17 | 13.3%), Transportation & Warehousing (14 | 10.9%), and Arts, Entertainment & Recreation (13 | 10.2%).
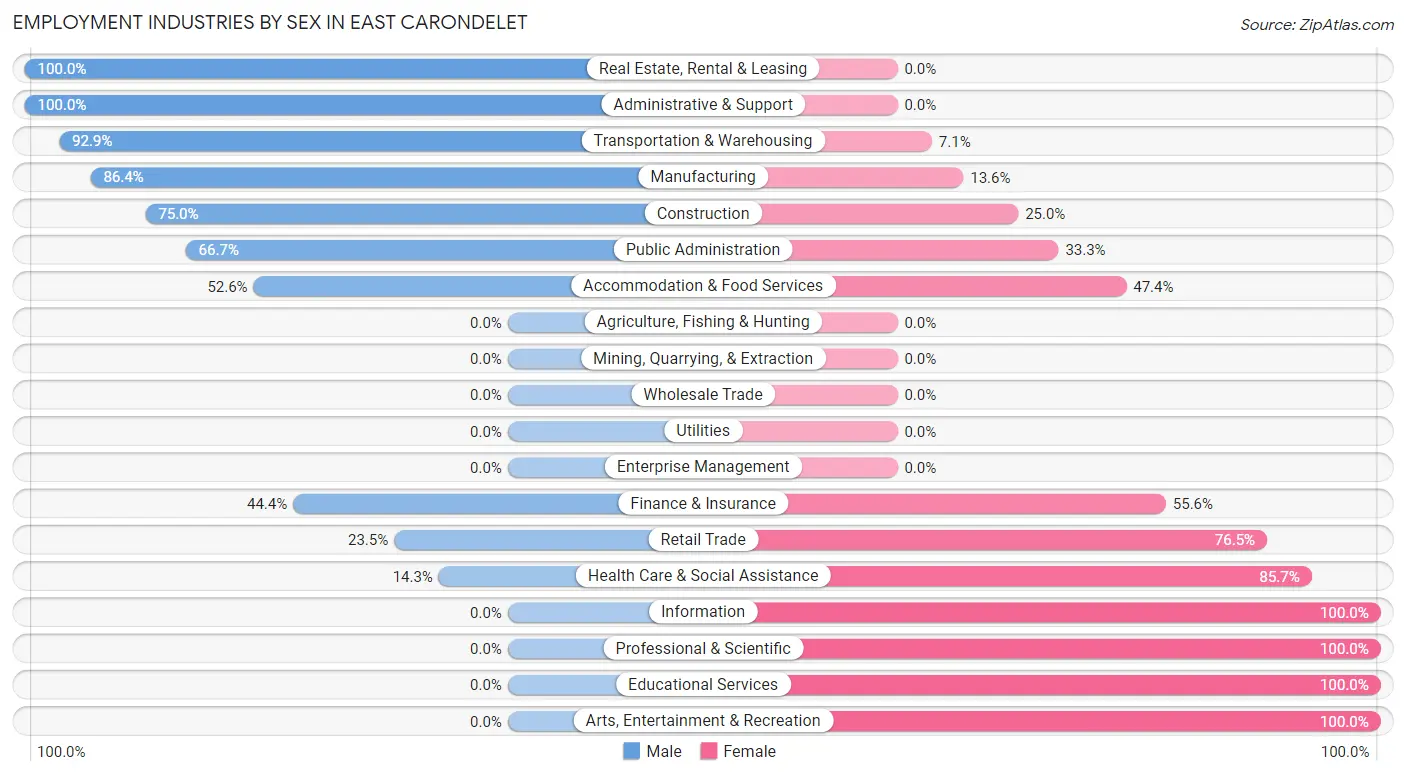
Employment Industries by Sex in East Carondelet
The East Carondelet industries that see more men than women are Real Estate, Rental & Leasing (100.0%), Administrative & Support (100.0%), and Transportation & Warehousing (92.9%), whereas the industries that tend to have a higher number of women are Information (100.0%), Professional & Scientific (100.0%), and Educational Services (100.0%).
| Industry | Male | Female |
| Agriculture, Fishing & Hunting | 0 (0.0%) | 0 (0.0%) |
| Mining, Quarrying, & Extraction | 0 (0.0%) | 0 (0.0%) |
| Construction | 3 (75.0%) | 1 (25.0%) |
| Manufacturing | 19 (86.4%) | 3 (13.6%) |
| Wholesale Trade | 0 (0.0%) | 0 (0.0%) |
| Retail Trade | 4 (23.5%) | 13 (76.5%) |
| Transportation & Warehousing | 13 (92.9%) | 1 (7.1%) |
| Utilities | 0 (0.0%) | 0 (0.0%) |
| Information | 0 (0.0%) | 6 (100.0%) |
| Finance & Insurance | 4 (44.4%) | 5 (55.6%) |
| Real Estate, Rental & Leasing | 1 (100.0%) | 0 (0.0%) |
| Professional & Scientific | 0 (0.0%) | 2 (100.0%) |
| Enterprise Management | 0 (0.0%) | 0 (0.0%) |
| Administrative & Support | 3 (100.0%) | 0 (0.0%) |
| Educational Services | 0 (0.0%) | 1 (100.0%) |
| Health Care & Social Assistance | 1 (14.3%) | 6 (85.7%) |
| Arts, Entertainment & Recreation | 0 (0.0%) | 13 (100.0%) |
| Accommodation & Food Services | 10 (52.6%) | 9 (47.4%) |
| Public Administration | 2 (66.7%) | 1 (33.3%) |
| Total | 66 (51.6%) | 62 (48.4%) |
Education in East Carondelet
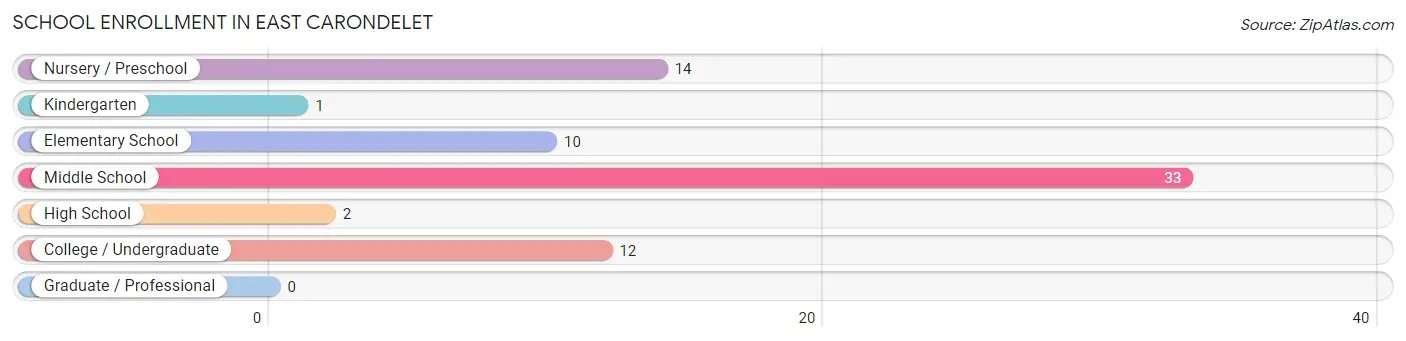
School Enrollment in East Carondelet
The most common levels of schooling among the 72 students in East Carondelet are middle school (33 | 45.8%), nursery / preschool (14 | 19.4%), and college / undergraduate (12 | 16.7%).
| School Level | # Students | % Students |
| Nursery / Preschool | 14 | 19.4% |
| Kindergarten | 1 | 1.4% |
| Elementary School | 10 | 13.9% |
| Middle School | 33 | 45.8% |
| High School | 2 | 2.8% |
| College / Undergraduate | 12 | 16.7% |
| Graduate / Professional | 0 | 0.0% |
| Total | 72 | 100.0% |
School Enrollment by Age by Funding Source in East Carondelet
Out of a total of 72 students who are enrolled in schools in East Carondelet, 2 (2.8%) attend a private institution, while the remaining 70 (97.2%) are enrolled in public schools. The age group of 20 to 24 year olds has the highest likelihood of being enrolled in private schools, with 2 (28.6% in the age bracket) enrolled. Conversely, the age group of 3 to 4 year olds has the lowest likelihood of being enrolled in a private school, with 14 (100.0% in the age bracket) attending a public institution.
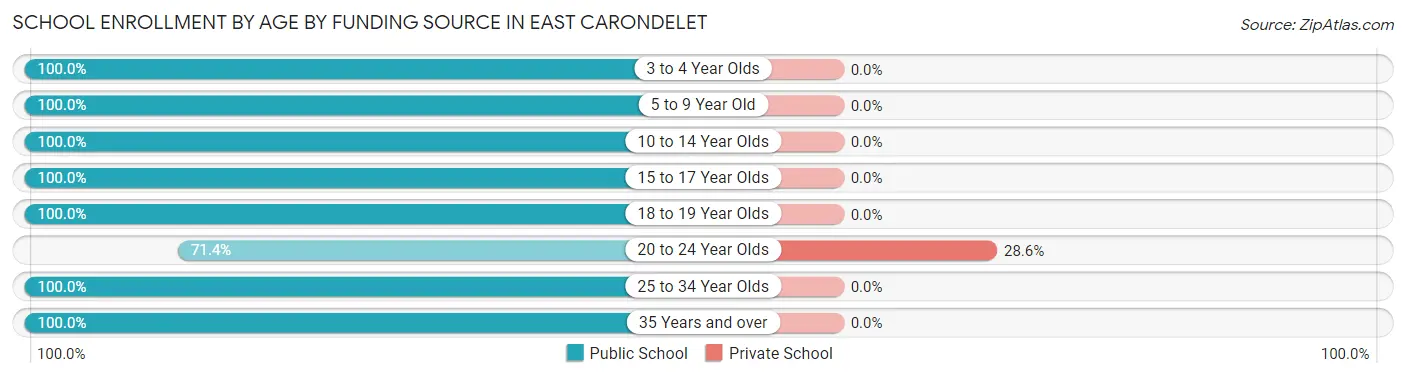
| Age Bracket | Public School | Private School |
| 3 to 4 Year Olds | 14 (100.0%) | 0 (0.0%) |
| 5 to 9 Year Old | 7 (100.0%) | 0 (0.0%) |
| 10 to 14 Year Olds | 34 (100.0%) | 0 (0.0%) |
| 15 to 17 Year Olds | 5 (100.0%) | 0 (0.0%) |
| 18 to 19 Year Olds | 3 (100.0%) | 0 (0.0%) |
| 20 to 24 Year Olds | 5 (71.4%) | 2 (28.6%) |
| 25 to 34 Year Olds | 1 (100.0%) | 0 (0.0%) |
| 35 Years and over | 1 (100.0%) | 0 (0.0%) |
| Total | 70 (97.2%) | 2 (2.8%) |
Educational Attainment by Field of Study in East Carondelet
Education (3 | 37.5%), liberal arts & history (2 | 25.0%), science & technology (1 | 12.5%), visual & performing arts (1 | 12.5%), and communications (1 | 12.5%) are the most common fields of study among 8 individuals in East Carondelet who have obtained a bachelor's degree or higher.
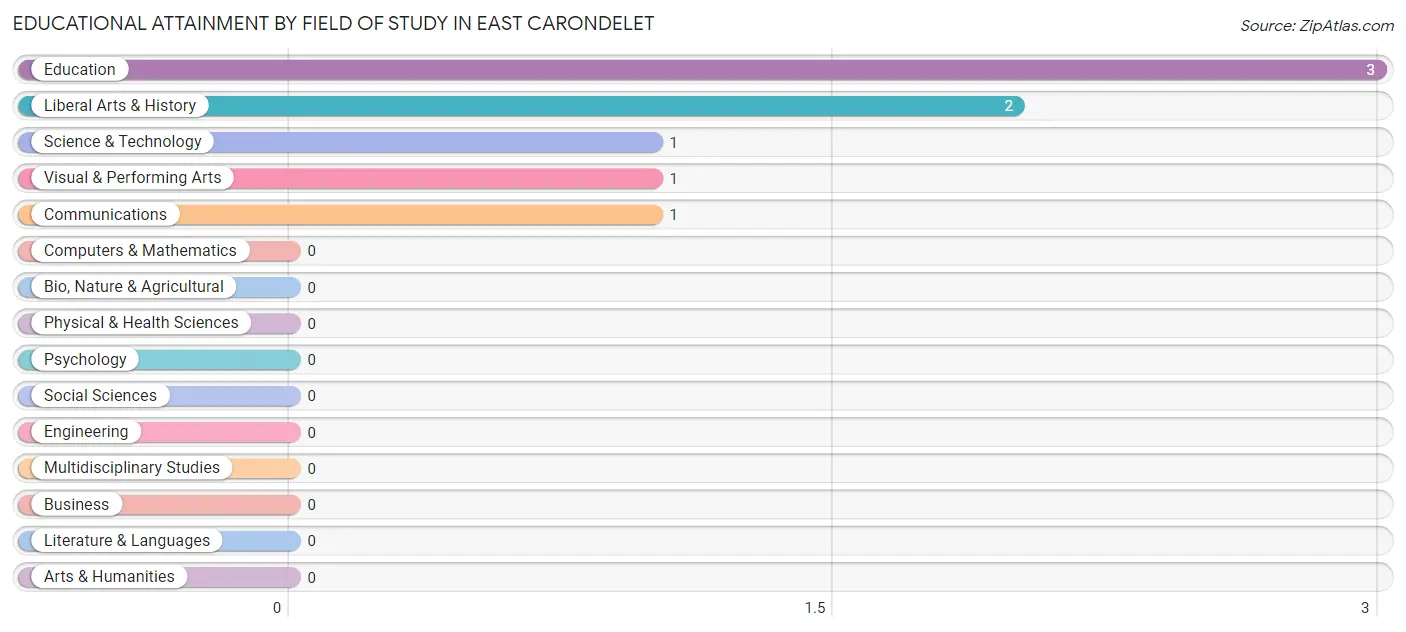
| Field of Study | # Graduates | % Graduates |
| Computers & Mathematics | 0 | 0.0% |
| Bio, Nature & Agricultural | 0 | 0.0% |
| Physical & Health Sciences | 0 | 0.0% |
| Psychology | 0 | 0.0% |
| Social Sciences | 0 | 0.0% |
| Engineering | 0 | 0.0% |
| Multidisciplinary Studies | 0 | 0.0% |
| Science & Technology | 1 | 12.5% |
| Business | 0 | 0.0% |
| Education | 3 | 37.5% |
| Literature & Languages | 0 | 0.0% |
| Liberal Arts & History | 2 | 25.0% |
| Visual & Performing Arts | 1 | 12.5% |
| Communications | 1 | 12.5% |
| Arts & Humanities | 0 | 0.0% |
| Total | 8 | 100.0% |
Transportation & Commute in East Carondelet
Vehicle Availability by Sex in East Carondelet
The most prevalent vehicle ownership categories in East Carondelet are males with 2 vehicles (22, accounting for 33.3%) and females with 2 vehicles (22, making up 36.1%).
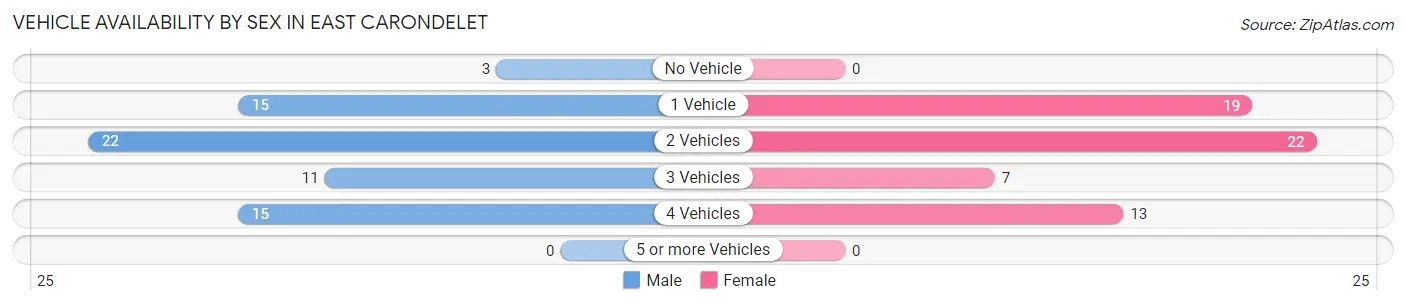
| Vehicles Available | Male | Female |
| No Vehicle | 3 (4.5%) | 0 (0.0%) |
| 1 Vehicle | 15 (22.7%) | 19 (31.1%) |
| 2 Vehicles | 22 (33.3%) | 22 (36.1%) |
| 3 Vehicles | 11 (16.7%) | 7 (11.5%) |
| 4 Vehicles | 15 (22.7%) | 13 (21.3%) |
| 5 or more Vehicles | 0 (0.0%) | 0 (0.0%) |
| Total | 66 (100.0%) | 61 (100.0%) |
Commute Time in East Carondelet
The most frequently occuring commute durations in East Carondelet are 30 to 34 minutes (44 commuters, 35.8%), 20 to 24 minutes (18 commuters, 14.6%), and 10 to 14 minutes (12 commuters, 9.8%).
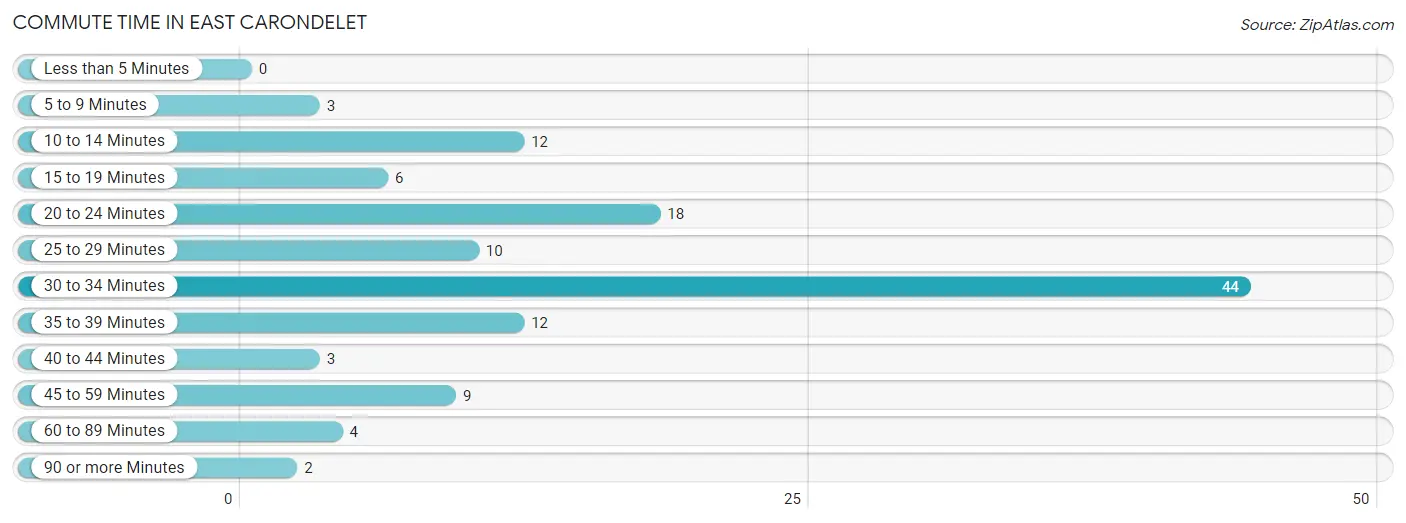
| Commute Time | # Commuters | % Commuters |
| Less than 5 Minutes | 0 | 0.0% |
| 5 to 9 Minutes | 3 | 2.4% |
| 10 to 14 Minutes | 12 | 9.8% |
| 15 to 19 Minutes | 6 | 4.9% |
| 20 to 24 Minutes | 18 | 14.6% |
| 25 to 29 Minutes | 10 | 8.1% |
| 30 to 34 Minutes | 44 | 35.8% |
| 35 to 39 Minutes | 12 | 9.8% |
| 40 to 44 Minutes | 3 | 2.4% |
| 45 to 59 Minutes | 9 | 7.3% |
| 60 to 89 Minutes | 4 | 3.3% |
| 90 or more Minutes | 2 | 1.6% |
Commute Time by Sex in East Carondelet
The most common commute times in East Carondelet are 30 to 34 minutes (27 commuters, 40.9%) for males and 30 to 34 minutes (17 commuters, 29.8%) for females.
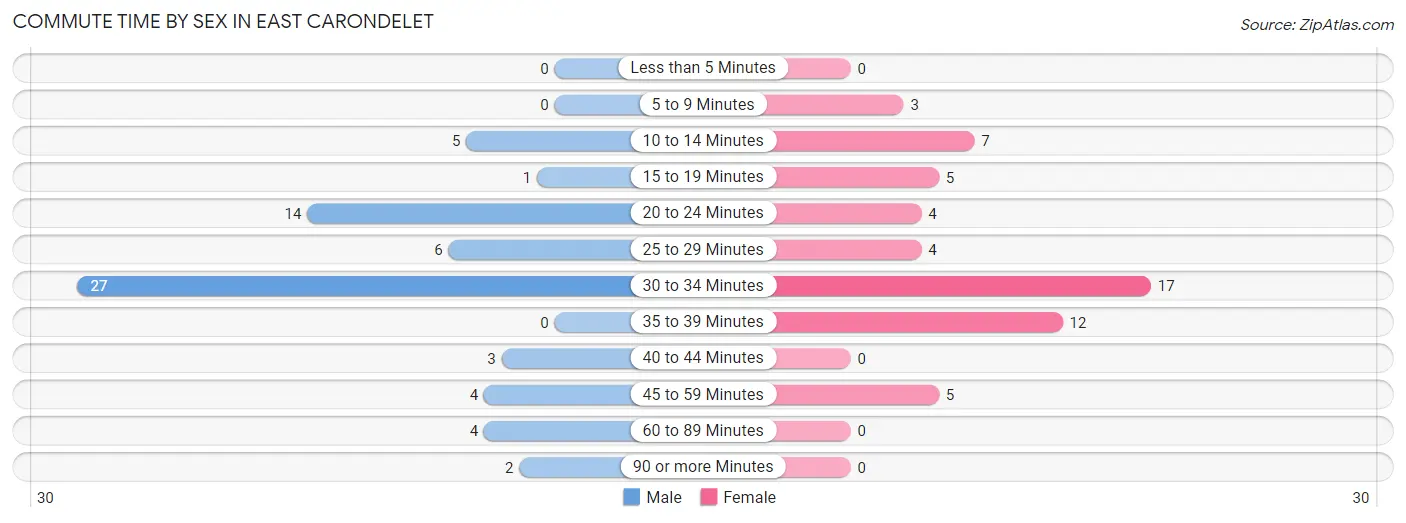
| Commute Time | Male | Female |
| Less than 5 Minutes | 0 (0.0%) | 0 (0.0%) |
| 5 to 9 Minutes | 0 (0.0%) | 3 (5.3%) |
| 10 to 14 Minutes | 5 (7.6%) | 7 (12.3%) |
| 15 to 19 Minutes | 1 (1.5%) | 5 (8.8%) |
| 20 to 24 Minutes | 14 (21.2%) | 4 (7.0%) |
| 25 to 29 Minutes | 6 (9.1%) | 4 (7.0%) |
| 30 to 34 Minutes | 27 (40.9%) | 17 (29.8%) |
| 35 to 39 Minutes | 0 (0.0%) | 12 (21.0%) |
| 40 to 44 Minutes | 3 (4.5%) | 0 (0.0%) |
| 45 to 59 Minutes | 4 (6.1%) | 5 (8.8%) |
| 60 to 89 Minutes | 4 (6.1%) | 0 (0.0%) |
| 90 or more Minutes | 2 (3.0%) | 0 (0.0%) |
Time of Departure to Work by Sex in East Carondelet
The most frequent times of departure to work in East Carondelet are 7:30 AM to 7:59 AM (15, 22.7%) for males and 12:00 AM to 4:59 AM (9, 15.8%) for females.
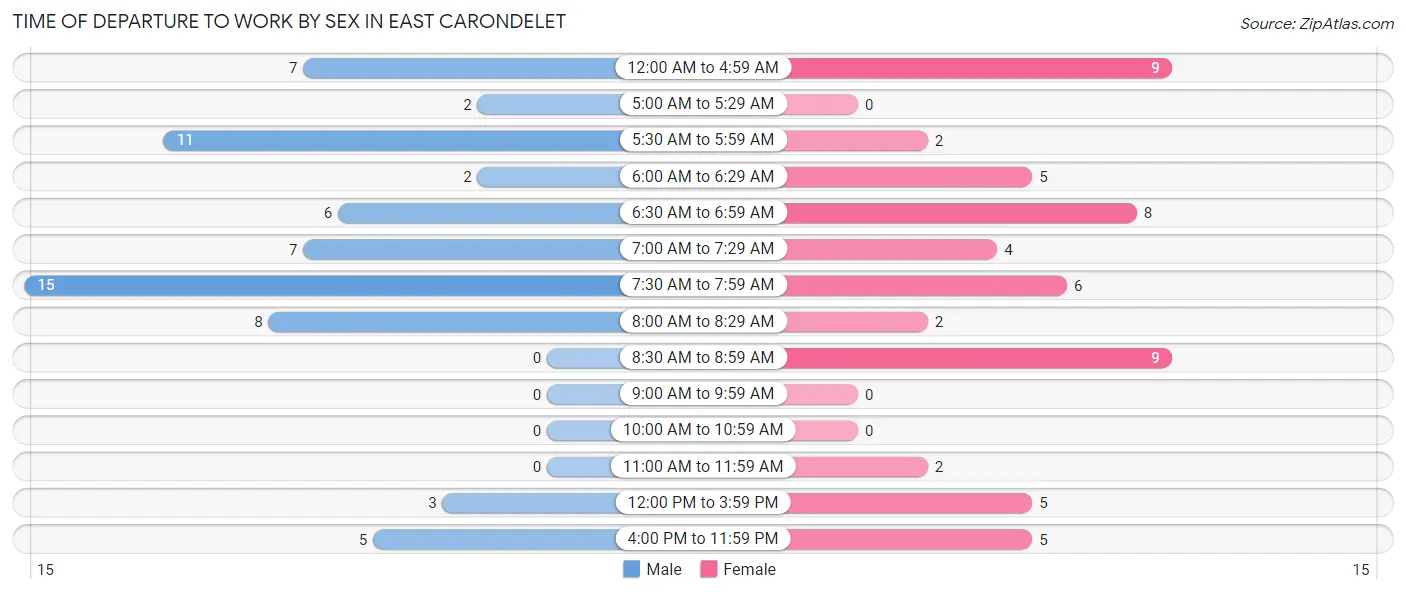
| Time of Departure | Male | Female |
| 12:00 AM to 4:59 AM | 7 (10.6%) | 9 (15.8%) |
| 5:00 AM to 5:29 AM | 2 (3.0%) | 0 (0.0%) |
| 5:30 AM to 5:59 AM | 11 (16.7%) | 2 (3.5%) |
| 6:00 AM to 6:29 AM | 2 (3.0%) | 5 (8.8%) |
| 6:30 AM to 6:59 AM | 6 (9.1%) | 8 (14.0%) |
| 7:00 AM to 7:29 AM | 7 (10.6%) | 4 (7.0%) |
| 7:30 AM to 7:59 AM | 15 (22.7%) | 6 (10.5%) |
| 8:00 AM to 8:29 AM | 8 (12.1%) | 2 (3.5%) |
| 8:30 AM to 8:59 AM | 0 (0.0%) | 9 (15.8%) |
| 9:00 AM to 9:59 AM | 0 (0.0%) | 0 (0.0%) |
| 10:00 AM to 10:59 AM | 0 (0.0%) | 0 (0.0%) |
| 11:00 AM to 11:59 AM | 0 (0.0%) | 2 (3.5%) |
| 12:00 PM to 3:59 PM | 3 (4.5%) | 5 (8.8%) |
| 4:00 PM to 11:59 PM | 5 (7.6%) | 5 (8.8%) |
| Total | 66 (100.0%) | 57 (100.0%) |
Housing Occupancy in East Carondelet
Occupancy by Ownership in East Carondelet
Of the total 102 dwellings in East Carondelet, owner-occupied units account for 82 (80.4%), while renter-occupied units make up 20 (19.6%).
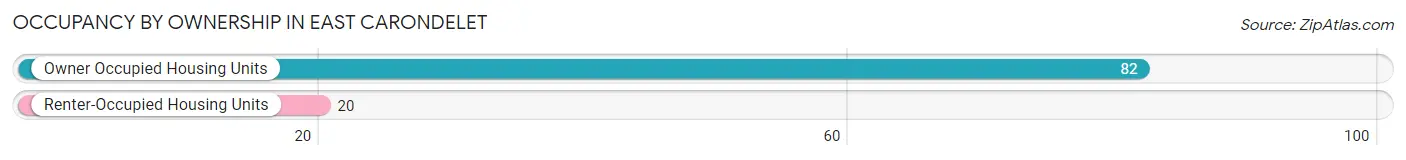
| Occupancy | # Housing Units | % Housing Units |
| Owner Occupied Housing Units | 82 | 80.4% |
| Renter-Occupied Housing Units | 20 | 19.6% |
| Total Occupied Housing Units | 102 | 100.0% |
Occupancy by Household Size in East Carondelet
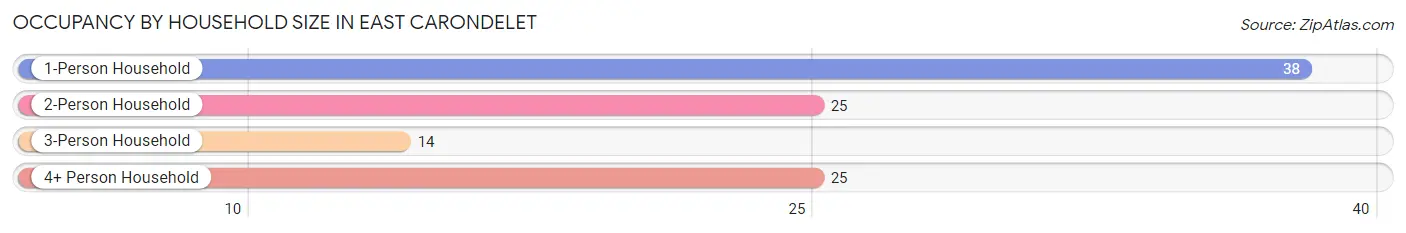
| Household Size | # Housing Units | % Housing Units |
| 1-Person Household | 38 | 37.2% |
| 2-Person Household | 25 | 24.5% |
| 3-Person Household | 14 | 13.7% |
| 4+ Person Household | 25 | 24.5% |
| Total Housing Units | 102 | 100.0% |
Occupancy by Ownership by Household Size in East Carondelet
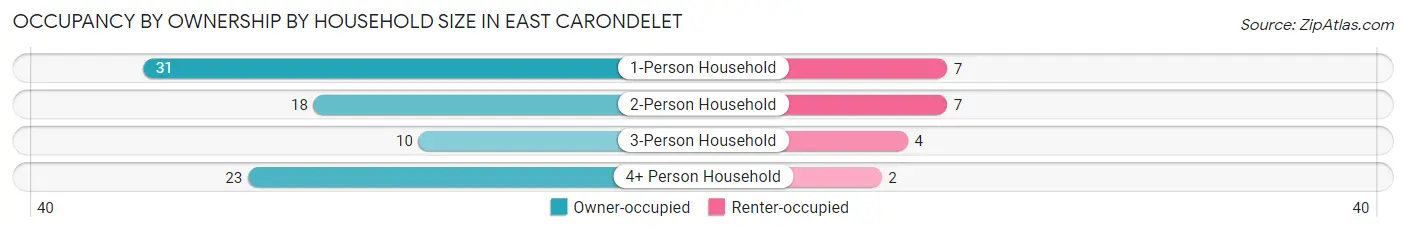
| Household Size | Owner-occupied | Renter-occupied |
| 1-Person Household | 31 (81.6%) | 7 (18.4%) |
| 2-Person Household | 18 (72.0%) | 7 (28.0%) |
| 3-Person Household | 10 (71.4%) | 4 (28.6%) |
| 4+ Person Household | 23 (92.0%) | 2 (8.0%) |
| Total Housing Units | 82 (80.4%) | 20 (19.6%) |
Occupancy by Educational Attainment in East Carondelet
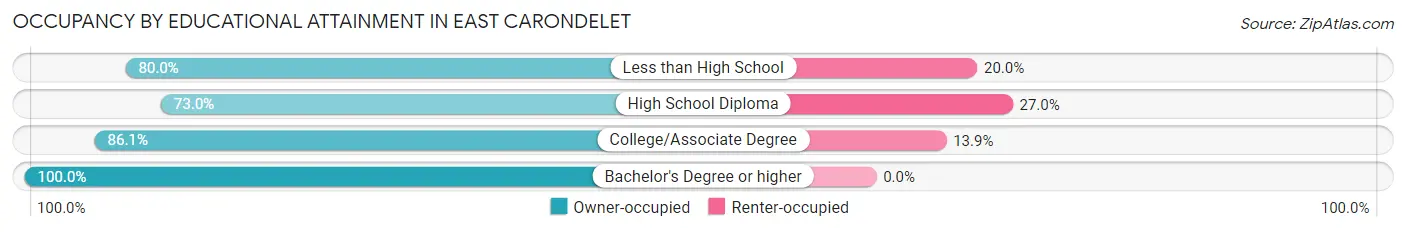
| Household Size | Owner-occupied | Renter-occupied |
| Less than High School | 20 (80.0%) | 5 (20.0%) |
| High School Diploma | 27 (73.0%) | 10 (27.0%) |
| College/Associate Degree | 31 (86.1%) | 5 (13.9%) |
| Bachelor's Degree or higher | 4 (100.0%) | 0 (0.0%) |
Occupancy by Age of Householder in East Carondelet
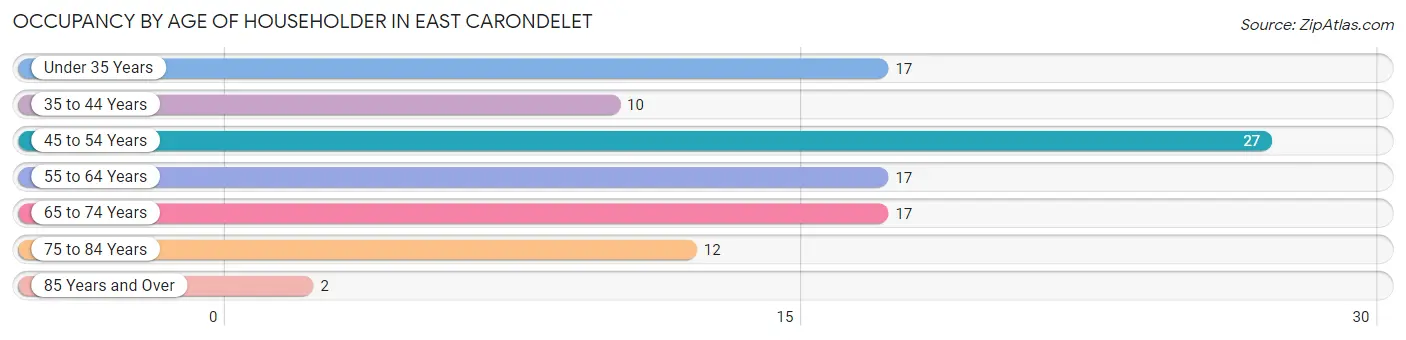
| Age Bracket | # Households | % Households |
| Under 35 Years | 17 | 16.7% |
| 35 to 44 Years | 10 | 9.8% |
| 45 to 54 Years | 27 | 26.5% |
| 55 to 64 Years | 17 | 16.7% |
| 65 to 74 Years | 17 | 16.7% |
| 75 to 84 Years | 12 | 11.8% |
| 85 Years and Over | 2 | 2.0% |
| Total | 102 | 100.0% |
Housing Finances in East Carondelet
Median Income by Occupancy in East Carondelet
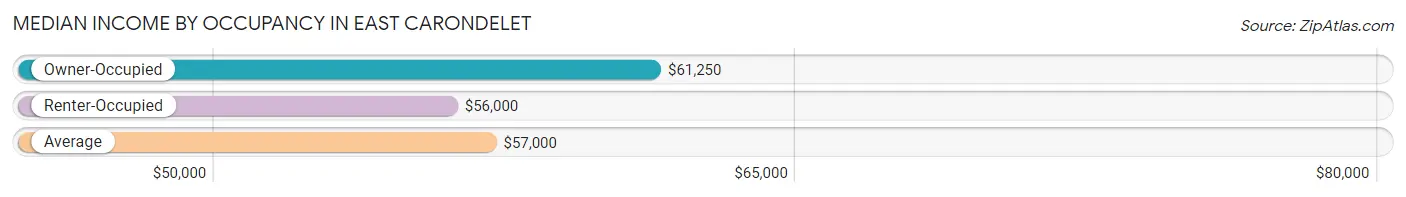
| Occupancy Type | # Households | Median Income |
| Owner-Occupied | 82 (80.4%) | $61,250 |
| Renter-Occupied | 20 (19.6%) | $56,000 |
| Average | 102 (100.0%) | $57,000 |
Occupancy by Householder Income Bracket in East Carondelet
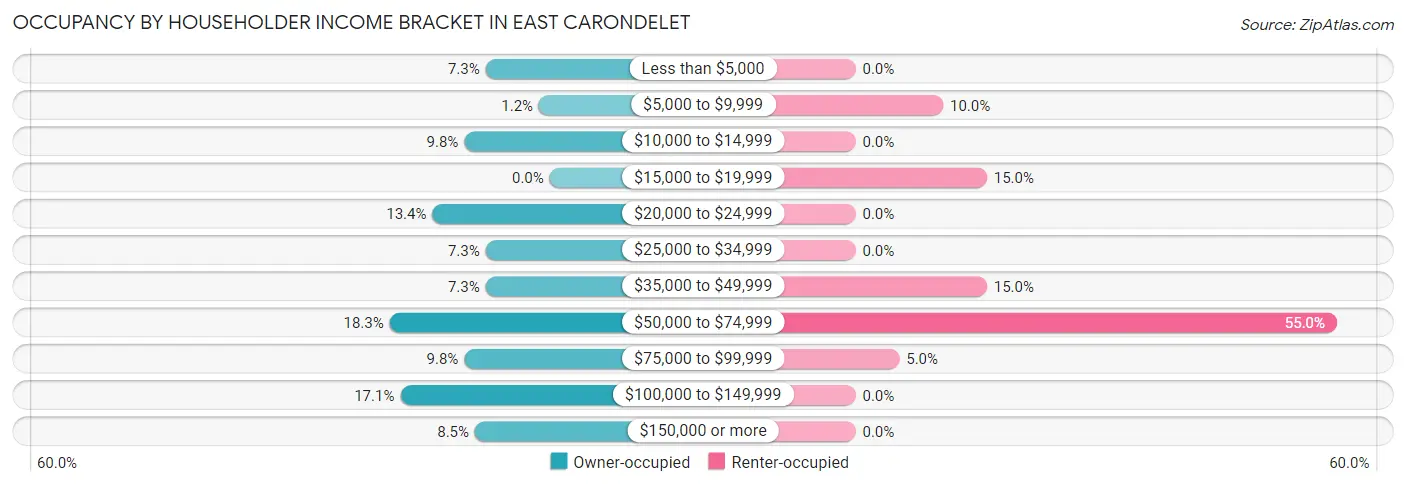
| Income Bracket | Owner-occupied | Renter-occupied |
| Less than $5,000 | 6 (7.3%) | 0 (0.0%) |
| $5,000 to $9,999 | 1 (1.2%) | 2 (10.0%) |
| $10,000 to $14,999 | 8 (9.8%) | 0 (0.0%) |
| $15,000 to $19,999 | 0 (0.0%) | 3 (15.0%) |
| $20,000 to $24,999 | 11 (13.4%) | 0 (0.0%) |
| $25,000 to $34,999 | 6 (7.3%) | 0 (0.0%) |
| $35,000 to $49,999 | 6 (7.3%) | 3 (15.0%) |
| $50,000 to $74,999 | 15 (18.3%) | 11 (55.0%) |
| $75,000 to $99,999 | 8 (9.8%) | 1 (5.0%) |
| $100,000 to $149,999 | 14 (17.1%) | 0 (0.0%) |
| $150,000 or more | 7 (8.5%) | 0 (0.0%) |
| Total | 82 (100.0%) | 20 (100.0%) |
Monthly Housing Cost Tiers in East Carondelet
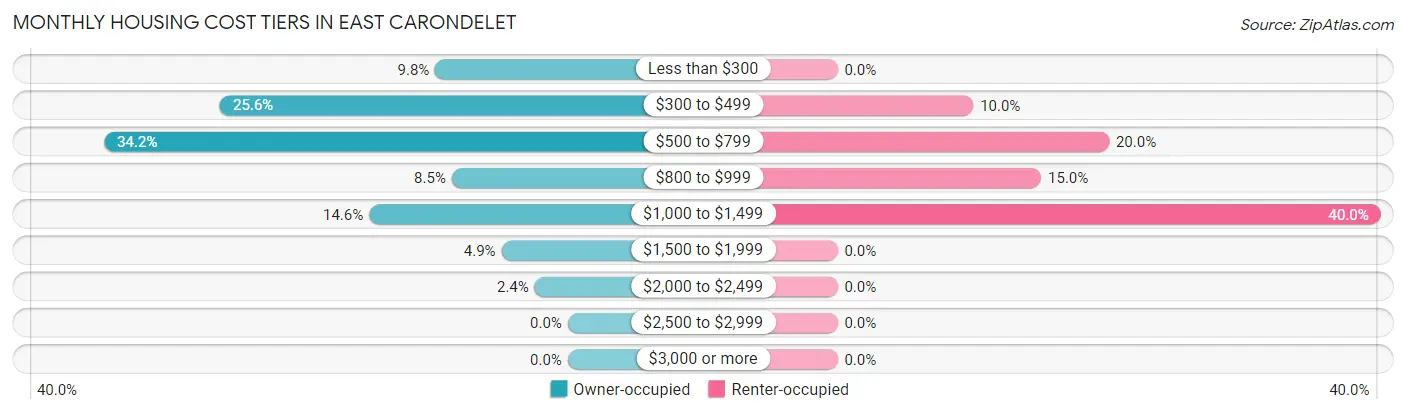
| Monthly Cost | Owner-occupied | Renter-occupied |
| Less than $300 | 8 (9.8%) | 0 (0.0%) |
| $300 to $499 | 21 (25.6%) | 2 (10.0%) |
| $500 to $799 | 28 (34.2%) | 4 (20.0%) |
| $800 to $999 | 7 (8.5%) | 3 (15.0%) |
| $1,000 to $1,499 | 12 (14.6%) | 8 (40.0%) |
| $1,500 to $1,999 | 4 (4.9%) | 0 (0.0%) |
| $2,000 to $2,499 | 2 (2.4%) | 0 (0.0%) |
| $2,500 to $2,999 | 0 (0.0%) | 0 (0.0%) |
| $3,000 or more | 0 (0.0%) | 0 (0.0%) |
| Total | 82 (100.0%) | 20 (100.0%) |
Physical Housing Characteristics in East Carondelet
Housing Structures in East Carondelet
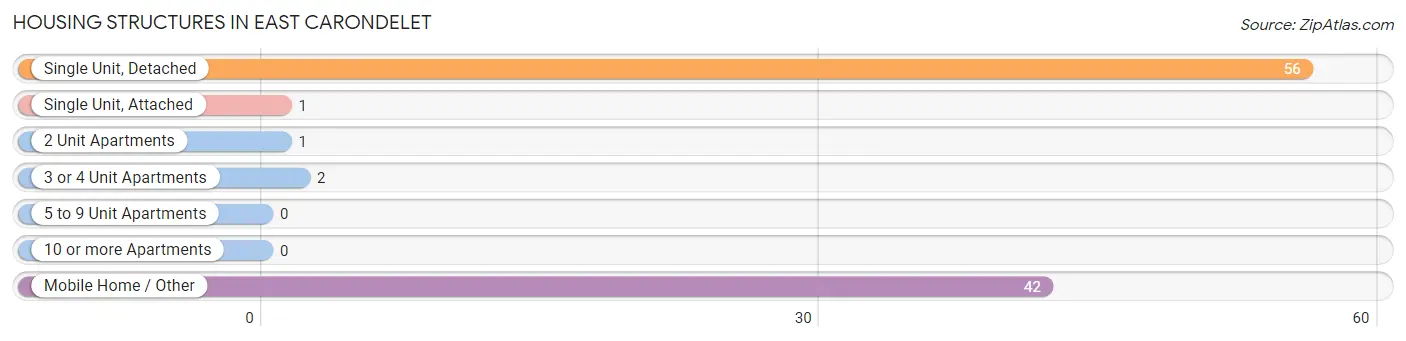
| Structure Type | # Housing Units | % Housing Units |
| Single Unit, Detached | 56 | 54.9% |
| Single Unit, Attached | 1 | 1.0% |
| 2 Unit Apartments | 1 | 1.0% |
| 3 or 4 Unit Apartments | 2 | 2.0% |
| 5 to 9 Unit Apartments | 0 | 0.0% |
| 10 or more Apartments | 0 | 0.0% |
| Mobile Home / Other | 42 | 41.2% |
| Total | 102 | 100.0% |
Housing Structures by Occupancy in East Carondelet
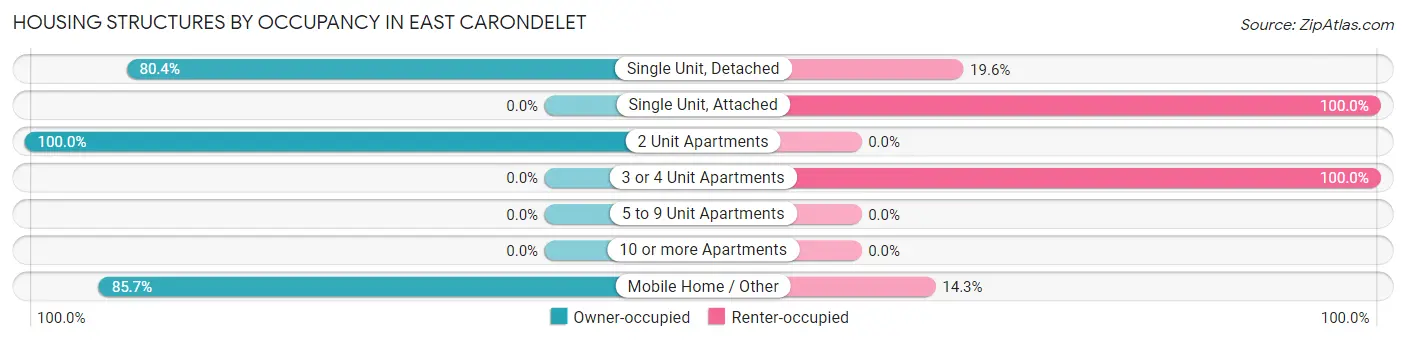
| Structure Type | Owner-occupied | Renter-occupied |
| Single Unit, Detached | 45 (80.4%) | 11 (19.6%) |
| Single Unit, Attached | 0 (0.0%) | 1 (100.0%) |
| 2 Unit Apartments | 1 (100.0%) | 0 (0.0%) |
| 3 or 4 Unit Apartments | 0 (0.0%) | 2 (100.0%) |
| 5 to 9 Unit Apartments | 0 (0.0%) | 0 (0.0%) |
| 10 or more Apartments | 0 (0.0%) | 0 (0.0%) |
| Mobile Home / Other | 36 (85.7%) | 6 (14.3%) |
| Total | 82 (80.4%) | 20 (19.6%) |
Housing Structures by Number of Rooms in East Carondelet
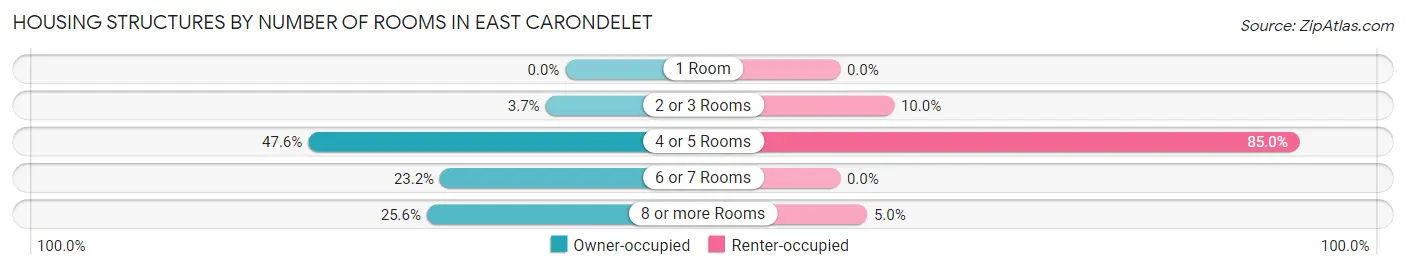
| Number of Rooms | Owner-occupied | Renter-occupied |
| 1 Room | 0 (0.0%) | 0 (0.0%) |
| 2 or 3 Rooms | 3 (3.7%) | 2 (10.0%) |
| 4 or 5 Rooms | 39 (47.6%) | 17 (85.0%) |
| 6 or 7 Rooms | 19 (23.2%) | 0 (0.0%) |
| 8 or more Rooms | 21 (25.6%) | 1 (5.0%) |
| Total | 82 (100.0%) | 20 (100.0%) |
Housing Structure by Heating Type in East Carondelet
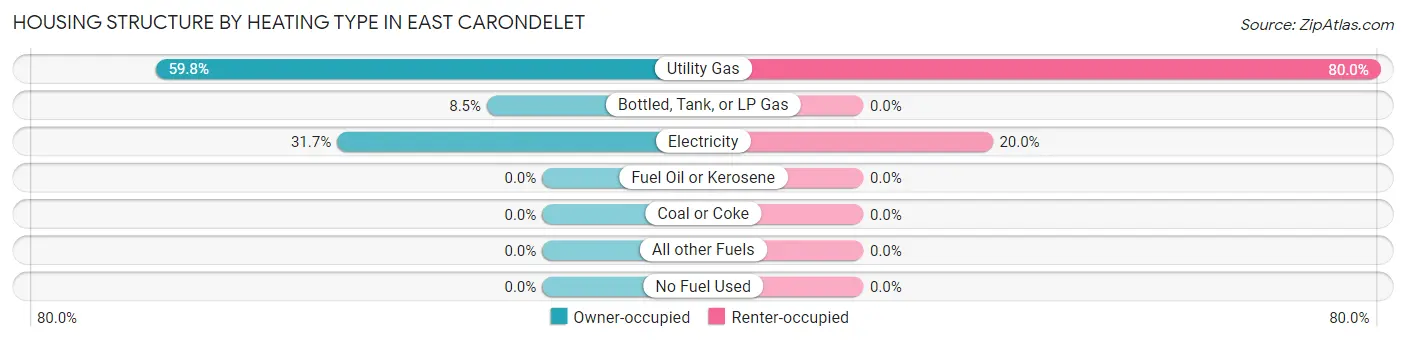
| Heating Type | Owner-occupied | Renter-occupied |
| Utility Gas | 49 (59.8%) | 16 (80.0%) |
| Bottled, Tank, or LP Gas | 7 (8.5%) | 0 (0.0%) |
| Electricity | 26 (31.7%) | 4 (20.0%) |
| Fuel Oil or Kerosene | 0 (0.0%) | 0 (0.0%) |
| Coal or Coke | 0 (0.0%) | 0 (0.0%) |
| All other Fuels | 0 (0.0%) | 0 (0.0%) |
| No Fuel Used | 0 (0.0%) | 0 (0.0%) |
| Total | 82 (100.0%) | 20 (100.0%) |
Household Vehicle Usage in East Carondelet
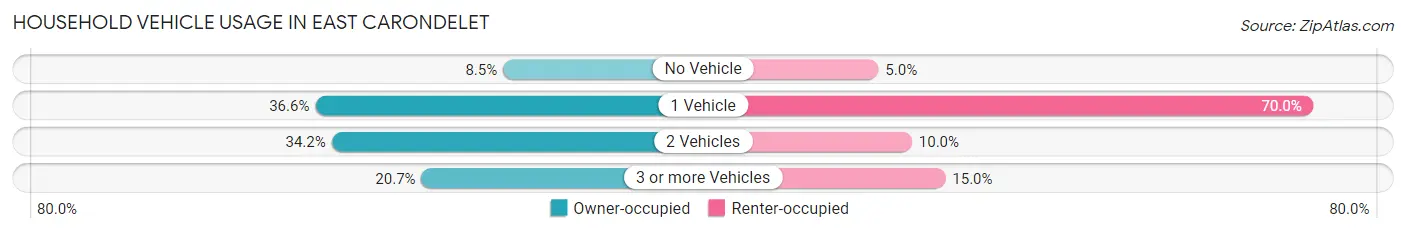
| Vehicles per Household | Owner-occupied | Renter-occupied |
| No Vehicle | 7 (8.5%) | 1 (5.0%) |
| 1 Vehicle | 30 (36.6%) | 14 (70.0%) |
| 2 Vehicles | 28 (34.2%) | 2 (10.0%) |
| 3 or more Vehicles | 17 (20.7%) | 3 (15.0%) |
| Total | 82 (100.0%) | 20 (100.0%) |
Real Estate & Mortgages in East Carondelet
Real Estate and Mortgage Overview in East Carondelet
| Characteristic | Without Mortgage | With Mortgage |
| Housing Units | 53 | 29 |
| Median Property Value | $49,000 | $85,000 |
| Median Household Income | $43,542 | $7 |
| Monthly Housing Costs | $481 | $0 |
| Real Estate Taxes | $1,339 | $0 |
Property Value by Mortgage Status in East Carondelet
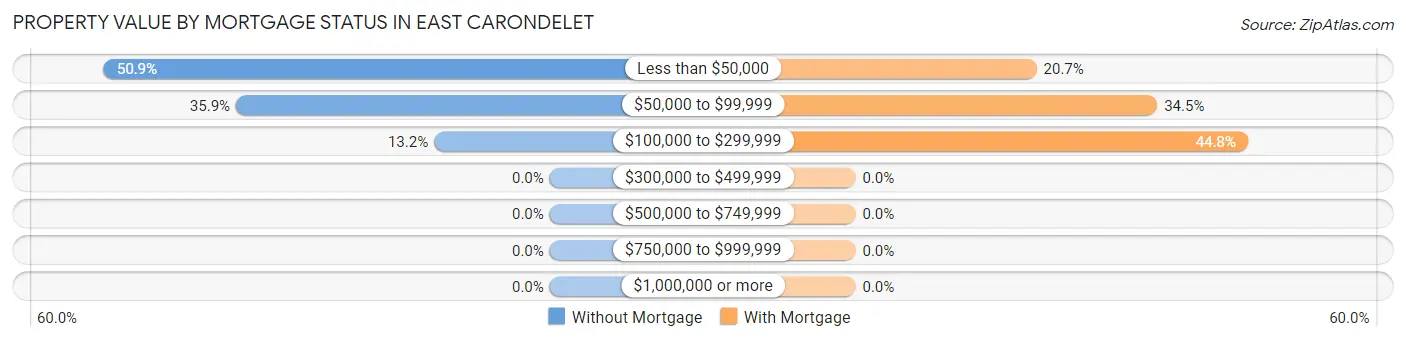
| Property Value | Without Mortgage | With Mortgage |
| Less than $50,000 | 27 (50.9%) | 6 (20.7%) |
| $50,000 to $99,999 | 19 (35.8%) | 10 (34.5%) |
| $100,000 to $299,999 | 7 (13.2%) | 13 (44.8%) |
| $300,000 to $499,999 | 0 (0.0%) | 0 (0.0%) |
| $500,000 to $749,999 | 0 (0.0%) | 0 (0.0%) |
| $750,000 to $999,999 | 0 (0.0%) | 0 (0.0%) |
| $1,000,000 or more | 0 (0.0%) | 0 (0.0%) |
| Total | 53 (100.0%) | 29 (100.0%) |
Household Income by Mortgage Status in East Carondelet
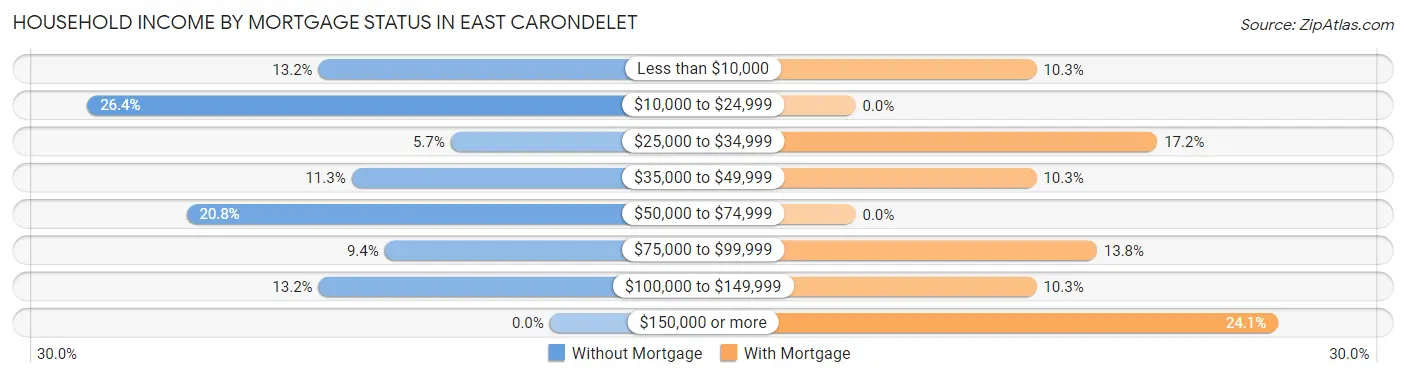
| Household Income | Without Mortgage | With Mortgage |
| Less than $10,000 | 7 (13.2%) | 3 (10.3%) |
| $10,000 to $24,999 | 14 (26.4%) | 0 (0.0%) |
| $25,000 to $34,999 | 3 (5.7%) | 5 (17.2%) |
| $35,000 to $49,999 | 6 (11.3%) | 3 (10.3%) |
| $50,000 to $74,999 | 11 (20.7%) | 0 (0.0%) |
| $75,000 to $99,999 | 5 (9.4%) | 4 (13.8%) |
| $100,000 to $149,999 | 7 (13.2%) | 3 (10.3%) |
| $150,000 or more | 0 (0.0%) | 7 (24.1%) |
| Total | 53 (100.0%) | 29 (100.0%) |
Property Value to Household Income Ratio in East Carondelet
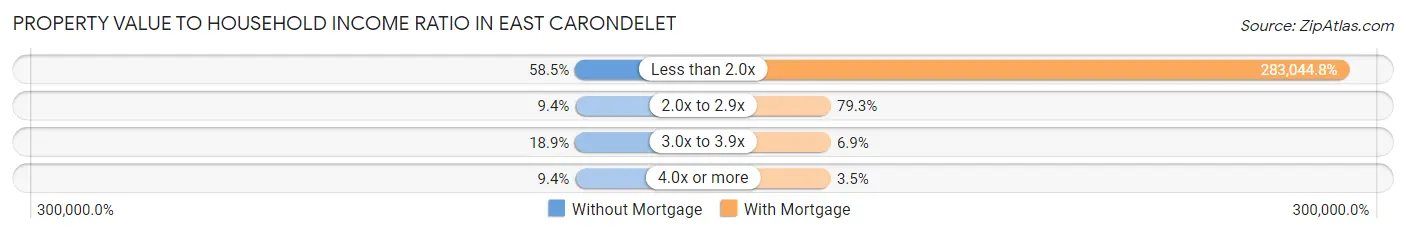
| Value-to-Income Ratio | Without Mortgage | With Mortgage |
| Less than 2.0x | 31 (58.5%) | 82,083 (283,044.8%) |
| 2.0x to 2.9x | 5 (9.4%) | 23 (79.3%) |
| 3.0x to 3.9x | 10 (18.9%) | 2 (6.9%) |
| 4.0x or more | 5 (9.4%) | 1 (3.5%) |
| Total | 53 (100.0%) | 29 (100.0%) |
Real Estate Taxes by Mortgage Status in East Carondelet
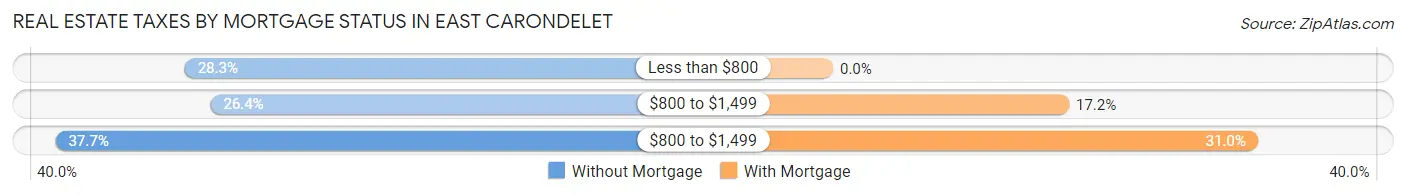
| Property Taxes | Without Mortgage | With Mortgage |
| Less than $800 | 15 (28.3%) | 0 (0.0%) |
| $800 to $1,499 | 14 (26.4%) | 5 (17.2%) |
| $800 to $1,499 | 20 (37.7%) | 9 (31.0%) |
| Total | 53 (100.0%) | 29 (100.0%) |
Health & Disability in East Carondelet
Health Insurance Coverage by Age in East Carondelet
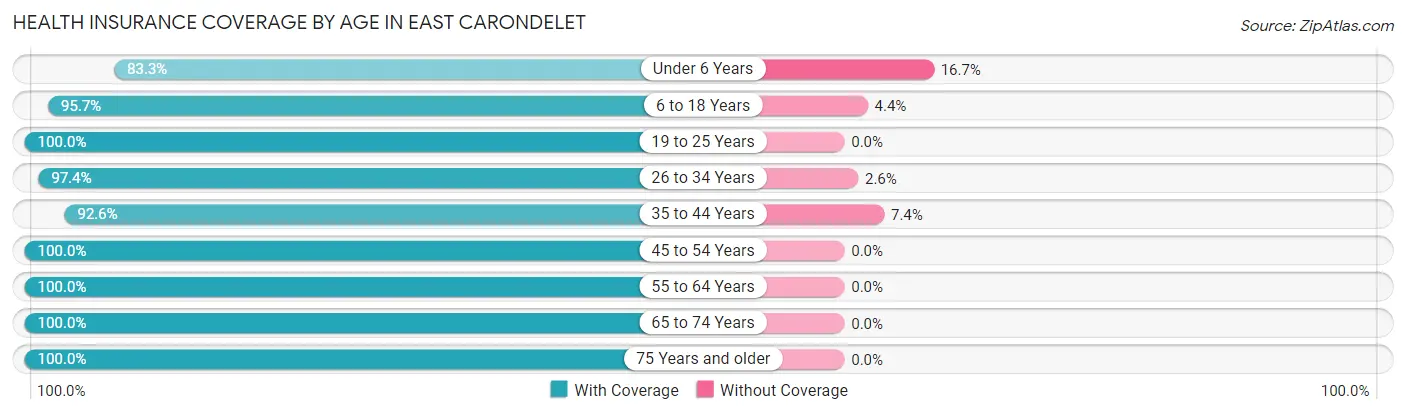
| Age Bracket | With Coverage | Without Coverage |
| Under 6 Years | 15 (83.3%) | 3 (16.7%) |
| 6 to 18 Years | 44 (95.7%) | 2 (4.3%) |
| 19 to 25 Years | 25 (100.0%) | 0 (0.0%) |
| 26 to 34 Years | 38 (97.4%) | 1 (2.6%) |
| 35 to 44 Years | 25 (92.6%) | 2 (7.4%) |
| 45 to 54 Years | 39 (100.0%) | 0 (0.0%) |
| 55 to 64 Years | 27 (100.0%) | 0 (0.0%) |
| 65 to 74 Years | 27 (100.0%) | 0 (0.0%) |
| 75 Years and older | 19 (100.0%) | 0 (0.0%) |
| Total | 259 (97.0%) | 8 (3.0%) |
Health Insurance Coverage by Citizenship Status in East Carondelet
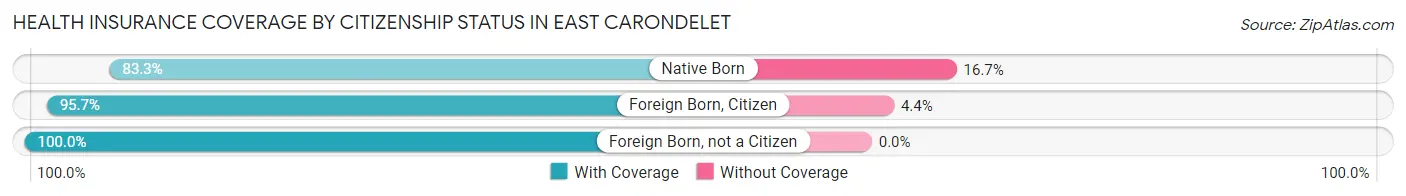
| Citizenship Status | With Coverage | Without Coverage |
| Native Born | 15 (83.3%) | 3 (16.7%) |
| Foreign Born, Citizen | 44 (95.7%) | 2 (4.3%) |
| Foreign Born, not a Citizen | 25 (100.0%) | 0 (0.0%) |
Health Insurance Coverage by Household Income in East Carondelet
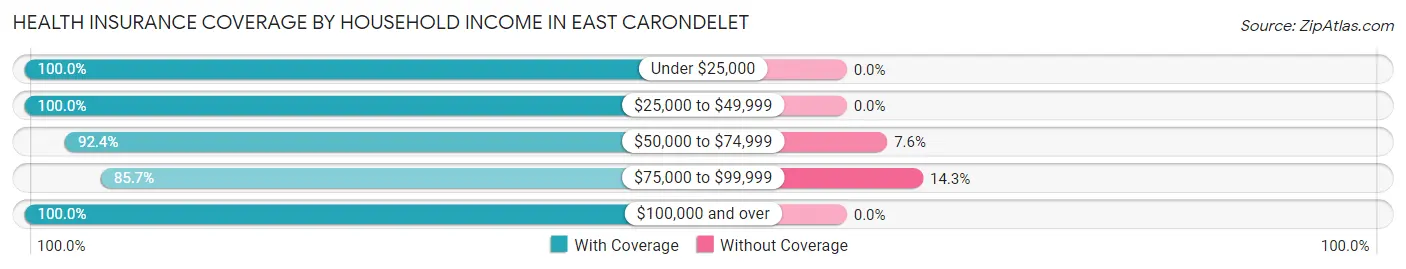
| Household Income | With Coverage | Without Coverage |
| Under $25,000 | 66 (100.0%) | 0 (0.0%) |
| $25,000 to $49,999 | 23 (100.0%) | 0 (0.0%) |
| $50,000 to $74,999 | 61 (92.4%) | 5 (7.6%) |
| $75,000 to $99,999 | 18 (85.7%) | 3 (14.3%) |
| $100,000 and over | 91 (100.0%) | 0 (0.0%) |
Public vs Private Health Insurance Coverage by Age in East Carondelet
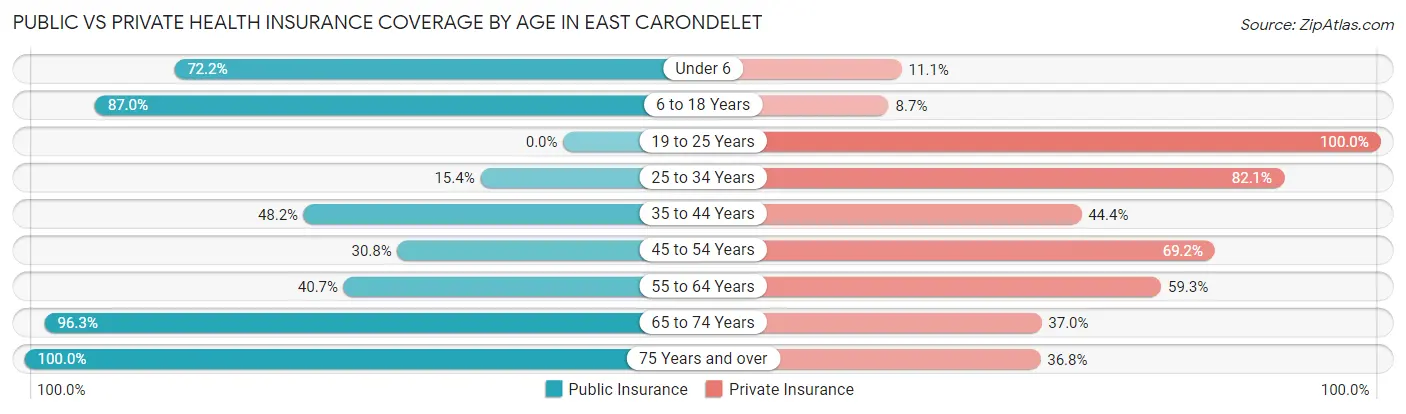
| Age Bracket | Public Insurance | Private Insurance |
| Under 6 | 13 (72.2%) | 2 (11.1%) |
| 6 to 18 Years | 40 (87.0%) | 4 (8.7%) |
| 19 to 25 Years | 0 (0.0%) | 25 (100.0%) |
| 25 to 34 Years | 6 (15.4%) | 32 (82.1%) |
| 35 to 44 Years | 13 (48.1%) | 12 (44.4%) |
| 45 to 54 Years | 12 (30.8%) | 27 (69.2%) |
| 55 to 64 Years | 11 (40.7%) | 16 (59.3%) |
| 65 to 74 Years | 26 (96.3%) | 10 (37.0%) |
| 75 Years and over | 19 (100.0%) | 7 (36.8%) |
| Total | 140 (52.4%) | 135 (50.6%) |
Disability Status by Sex by Age in East Carondelet
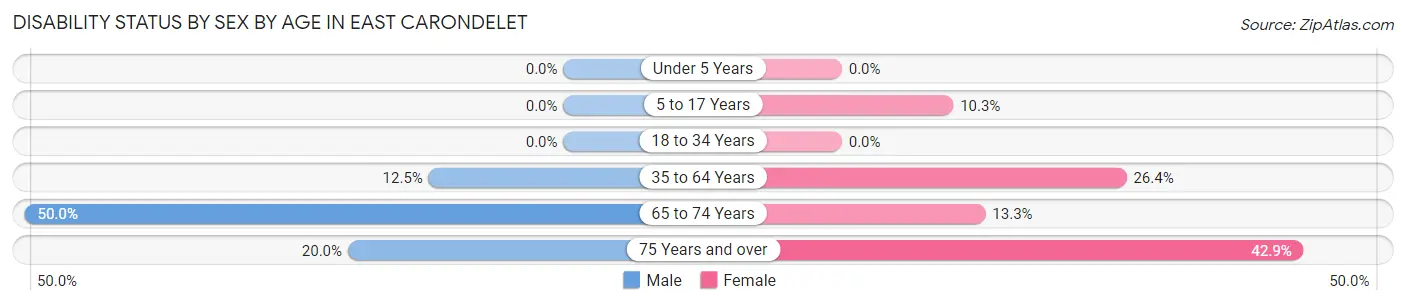
| Age Bracket | Male | Female |
| Under 5 Years | 0 (0.0%) | 0 (0.0%) |
| 5 to 17 Years | 0 (0.0%) | 3 (10.3%) |
| 18 to 34 Years | 0 (0.0%) | 0 (0.0%) |
| 35 to 64 Years | 5 (12.5%) | 14 (26.4%) |
| 65 to 74 Years | 6 (50.0%) | 2 (13.3%) |
| 75 Years and over | 1 (20.0%) | 6 (42.9%) |
Disability Class by Sex by Age in East Carondelet
Disability Class: Hearing Difficulty
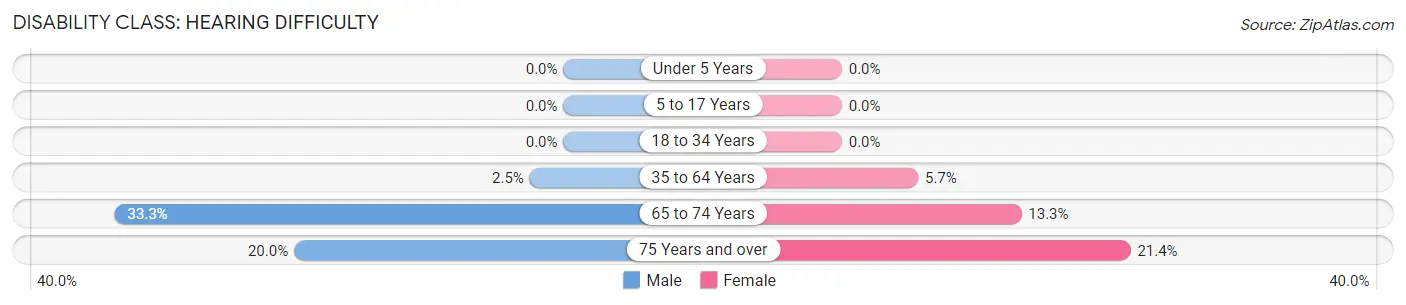
| Age Bracket | Male | Female |
| Under 5 Years | 0 (0.0%) | 0 (0.0%) |
| 5 to 17 Years | 0 (0.0%) | 0 (0.0%) |
| 18 to 34 Years | 0 (0.0%) | 0 (0.0%) |
| 35 to 64 Years | 1 (2.5%) | 3 (5.7%) |
| 65 to 74 Years | 4 (33.3%) | 2 (13.3%) |
| 75 Years and over | 1 (20.0%) | 3 (21.4%) |
Disability Class: Vision Difficulty
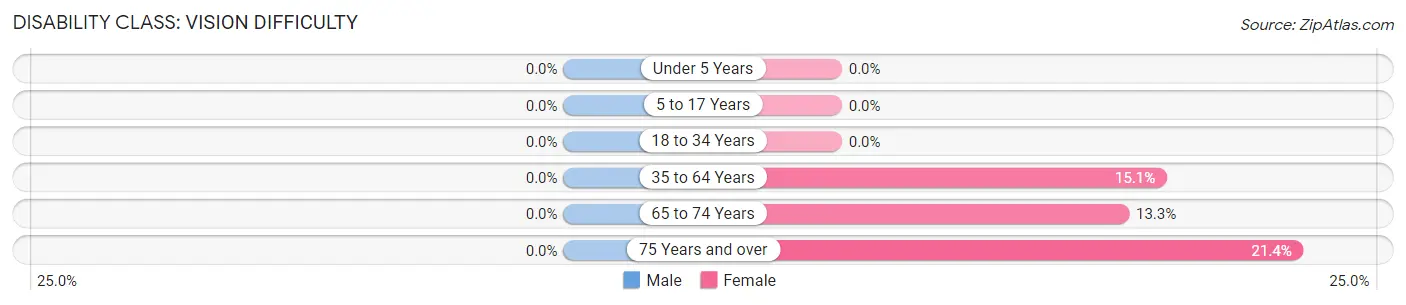
| Age Bracket | Male | Female |
| Under 5 Years | 0 (0.0%) | 0 (0.0%) |
| 5 to 17 Years | 0 (0.0%) | 0 (0.0%) |
| 18 to 34 Years | 0 (0.0%) | 0 (0.0%) |
| 35 to 64 Years | 0 (0.0%) | 8 (15.1%) |
| 65 to 74 Years | 0 (0.0%) | 2 (13.3%) |
| 75 Years and over | 0 (0.0%) | 3 (21.4%) |
Disability Class: Cognitive Difficulty
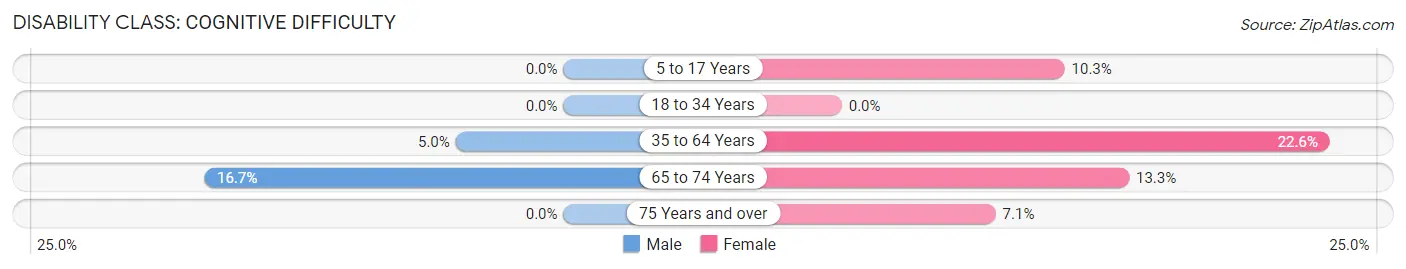
| Age Bracket | Male | Female |
| 5 to 17 Years | 0 (0.0%) | 3 (10.3%) |
| 18 to 34 Years | 0 (0.0%) | 0 (0.0%) |
| 35 to 64 Years | 2 (5.0%) | 12 (22.6%) |
| 65 to 74 Years | 2 (16.7%) | 2 (13.3%) |
| 75 Years and over | 0 (0.0%) | 1 (7.1%) |
Disability Class: Ambulatory Difficulty
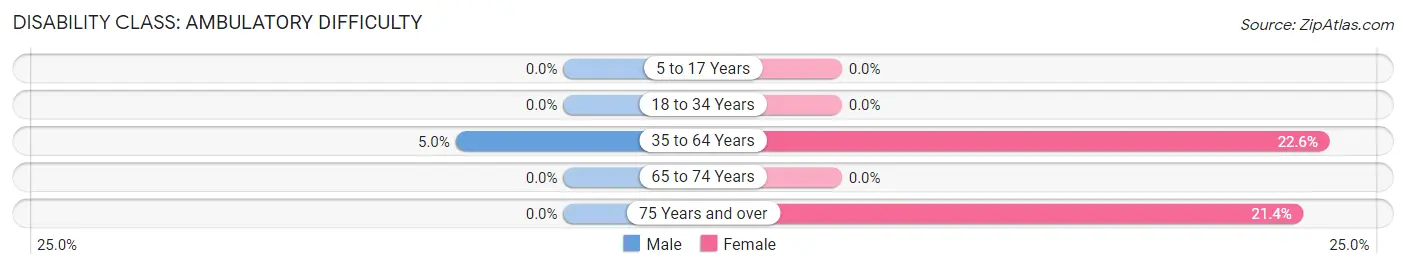
| Age Bracket | Male | Female |
| 5 to 17 Years | 0 (0.0%) | 0 (0.0%) |
| 18 to 34 Years | 0 (0.0%) | 0 (0.0%) |
| 35 to 64 Years | 2 (5.0%) | 12 (22.6%) |
| 65 to 74 Years | 0 (0.0%) | 0 (0.0%) |
| 75 Years and over | 0 (0.0%) | 3 (21.4%) |
Disability Class: Self-Care Difficulty
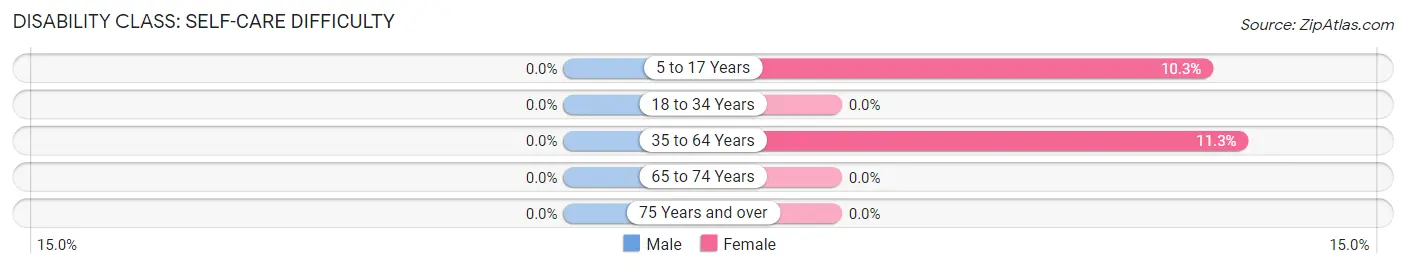
| Age Bracket | Male | Female |
| 5 to 17 Years | 0 (0.0%) | 3 (10.3%) |
| 18 to 34 Years | 0 (0.0%) | 0 (0.0%) |
| 35 to 64 Years | 0 (0.0%) | 6 (11.3%) |
| 65 to 74 Years | 0 (0.0%) | 0 (0.0%) |
| 75 Years and over | 0 (0.0%) | 0 (0.0%) |
Technology Access in East Carondelet
Computing Device Access in East Carondelet
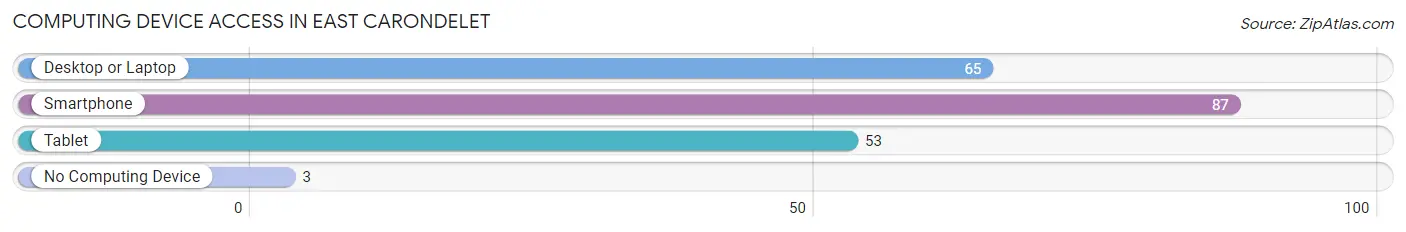
| Device Type | # Households | % Households |
| Desktop or Laptop | 65 | 63.7% |
| Smartphone | 87 | 85.3% |
| Tablet | 53 | 52.0% |
| No Computing Device | 3 | 2.9% |
| Total | 102 | 100.0% |
Internet Access in East Carondelet
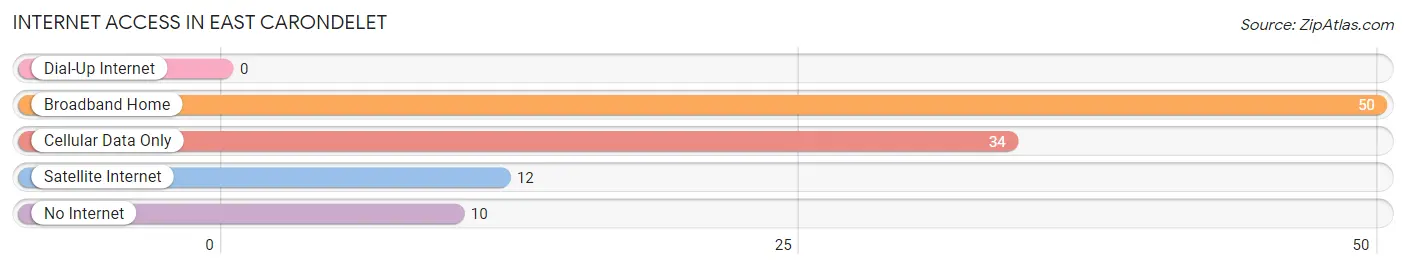
| Internet Type | # Households | % Households |
| Dial-Up Internet | 0 | 0.0% |
| Broadband Home | 50 | 49.0% |
| Cellular Data Only | 34 | 33.3% |
| Satellite Internet | 12 | 11.8% |
| No Internet | 10 | 9.8% |
| Total | 102 | 100.0% |
East Carondelet Summary
East Carondelet is a small village located in St. Clair County, Illinois, United States. It is situated on the Mississippi River, just south of the city of St. Louis. The village has a population of 1,092 as of the 2010 census.
History
East Carondelet was founded in 1836 by a group of French settlers who had come to the area from Canada. The village was originally known as "Carondelet" and was named after Baron de Carondelet, the Spanish governor of Louisiana. The village was incorporated in 1871 and the name was changed to "East Carondelet" to distinguish it from the nearby city of Carondelet, which is now part of St. Louis.
In the late 19th century, East Carondelet was a thriving river port and a center of industry. The village was home to several factories, including a brickyard, a sawmill, a flour mill, and a distillery. The village also had a ferry service that connected it to St. Louis.
In the early 20th century, East Carondelet began to decline as industry moved away from the area. The village was hit hard by the Great Depression and many of its residents moved away in search of work. The village's population has remained relatively stable since then, with a slight increase in recent years.
Geography
East Carondelet is located at 38°30'25"N 90°10'17"W (38.506944, -90.171389). The village is situated on the east bank of the Mississippi River, just south of the city of St. Louis. It is bordered to the north by the village of Dupo and to the south by the village of Brooklyn.
The village has a total area of 0.7 square miles, all of which is land. The terrain is mostly flat, with some low hills in the northern part of the village.
Economy
The economy of East Carondelet is largely based on agriculture and light industry. The village is home to several small businesses, including a grocery store, a hardware store, and a restaurant. The village also has a small marina on the Mississippi River.
Demographics
As of the 2010 census, there were 1,092 people living in East Carondelet. The population density was 1,541.7 people per square mile. The racial makeup of the village was 97.2% White, 0.7% African American, 0.2% Native American, 0.2% Asian, 0.2% from other races, and 1.7% from two or more races. Hispanic or Latino of any race were 1.3% of the population.
The median income for a household in East Carondelet was $37,500, and the median income for a family was $41,250. The per capita income for the village was $17,845. About 11.2% of families and 13.2% of the population were below the poverty line, including 17.2% of those under age 18 and 8.3% of those age 65 or over.
Common Questions
What is Per Capita Income in East Carondelet?
Per Capita income in East Carondelet is $26,838.
What is the Median Family Income in East Carondelet?
Median Family Income in East Carondelet is $63,750.
What is the Median Household income in East Carondelet?
Median Household Income in East Carondelet is $57,000.
What is Income or Wage Gap in East Carondelet?
Income or Wage Gap in East Carondelet is 21.3%.
Women in East Carondelet earn 78.7 cents for every dollar earned by a man.
What is Family Income Deficit in East Carondelet?
Family Income Deficit in East Carondelet is $7,546.
Families that are below poverty line in East Carondelet earn $7,546 less on average than the poverty threshold level.
What is Inequality or Gini Index in East Carondelet?
Inequality or Gini Index in East Carondelet is 0.45.
What is the Total Population of East Carondelet?
Total Population of East Carondelet is 267.
What is the Total Male Population of East Carondelet?
Total Male Population of East Carondelet is 115.
What is the Total Female Population of East Carondelet?
Total Female Population of East Carondelet is 152.
What is the Ratio of Males per 100 Females in East Carondelet?
There are 75.66 Males per 100 Females in East Carondelet.
What is the Ratio of Females per 100 Males in East Carondelet?
There are 132.17 Females per 100 Males in East Carondelet.
What is the Median Population Age in East Carondelet?
Median Population Age in East Carondelet is 37.4 Years.
What is the Average Family Size in East Carondelet
Average Family Size in East Carondelet is 3.6 People.
What is the Average Household Size in East Carondelet
Average Household Size in East Carondelet is 2.6 People.
How Large is the Labor Force in East Carondelet?
There are 134 People in the Labor Forcein in East Carondelet.
What is the Percentage of People in the Labor Force in East Carondelet?
65.0% of People are in the Labor Force in East Carondelet.
What is the Unemployment Rate in East Carondelet?
Unemployment Rate in East Carondelet is 4.5%.