Cities with the Highest Percentage of Peruvian Population in Illinois
RELATED REPORTS & OPTIONS
Peruvian
Illinois
Compare Cities
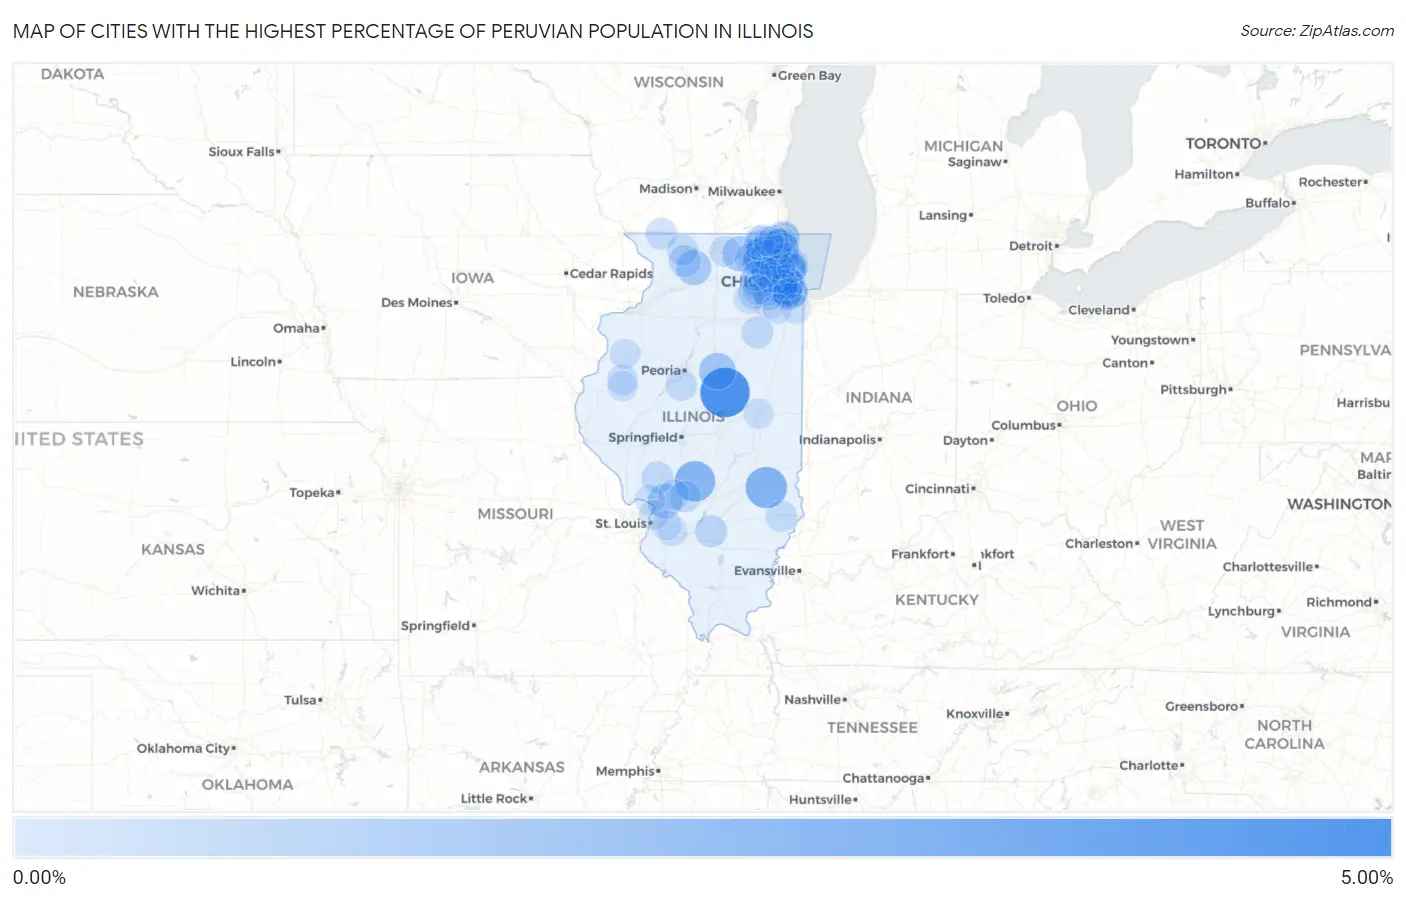
Map of Cities with the Highest Percentage of Peruvian Population in Illinois
0.00%
5.00%
Cities with the Highest Percentage of Peruvian Population in Illinois
| City | Peruvian | vs State | vs National | |
| 1. | Downs | 4.31% | 0.11%(+4.21)#1 | 0.22%(+4.10)#84 |
| 2. | Rose Hill | 2.50% | 0.11%(+2.39)#2 | 0.22%(+2.28)#212 |
| 3. | Irving | 2.32% | 0.11%(+2.21)#3 | 0.22%(+2.10)#238 |
| 4. | Green Oaks | 1.76% | 0.11%(+1.65)#4 | 0.22%(+1.54)#368 |
| 5. | Kappa | 1.52% | 0.11%(+1.41)#5 | 0.22%(+1.30)#442 |
| 6. | Lyons | 1.51% | 0.11%(+1.40)#6 | 0.22%(+1.29)#446 |
| 7. | Hometown | 1.30% | 0.11%(+1.19)#7 | 0.22%(+1.09)#529 |
| 8. | Marengo | 1.20% | 0.11%(+1.10)#8 | 0.22%(+0.989)#576 |
| 9. | Mount Morris | 1.16% | 0.11%(+1.05)#9 | 0.22%(+0.941)#594 |
| 10. | Cary | 1.12% | 0.11%(+1.02)#10 | 0.22%(+0.909)#610 |
| 11. | Indian Head Park | 1.12% | 0.11%(+1.01)#11 | 0.22%(+0.904)#615 |
| 12. | Holiday Shores | 1.07% | 0.11%(+0.957)#12 | 0.22%(+0.850)#654 |
| 13. | Kenilworth | 0.91% | 0.11%(+0.798)#13 | 0.22%(+0.691)#769 |
| 14. | Lincolnwood | 0.87% | 0.11%(+0.759)#14 | 0.22%(+0.651)#797 |
| 15. | Trout Valley | 0.84% | 0.11%(+0.735)#15 | 0.22%(+0.628)#816 |
| 16. | Forest Park | 0.80% | 0.11%(+0.697)#16 | 0.22%(+0.590)#852 |
| 17. | Lake In The Hills | 0.66% | 0.11%(+0.548)#17 | 0.22%(+0.441)#1,014 |
| 18. | Montgomery | 0.64% | 0.11%(+0.531)#18 | 0.22%(+0.424)#1,039 |
| 19. | Carol Stream | 0.62% | 0.11%(+0.510)#19 | 0.22%(+0.403)#1,069 |
| 20. | Beach Park | 0.59% | 0.11%(+0.478)#20 | 0.22%(+0.371)#1,120 |
| 21. | Centralia | 0.53% | 0.11%(+0.421)#21 | 0.22%(+0.314)#1,226 |
| 22. | Forreston | 0.53% | 0.11%(+0.418)#22 | 0.22%(+0.311)#1,231 |
| 23. | Wheeling | 0.52% | 0.11%(+0.407)#23 | 0.22%(+0.300)#1,255 |
| 24. | Chesterfield | 0.50% | 0.11%(+0.387)#24 | 0.22%(+0.280)#1,298 |
| 25. | Gardner | 0.47% | 0.11%(+0.366)#25 | 0.22%(+0.259)#1,362 |
| 26. | Berwyn | 0.42% | 0.11%(+0.314)#26 | 0.22%(+0.207)#1,475 |
| 27. | Hoffman Estates | 0.42% | 0.11%(+0.313)#27 | 0.22%(+0.206)#1,479 |
| 28. | Melrose Park | 0.41% | 0.11%(+0.301)#28 | 0.22%(+0.194)#1,509 |
| 29. | Sorento | 0.40% | 0.11%(+0.293)#29 | 0.22%(+0.186)#1,535 |
| 30. | South Pekin | 0.40% | 0.11%(+0.291)#30 | 0.22%(+0.184)#1,542 |
| 31. | Warren | 0.39% | 0.11%(+0.279)#31 | 0.22%(+0.172)#1,579 |
| 32. | Skokie | 0.38% | 0.11%(+0.275)#32 | 0.22%(+0.168)#1,586 |
| 33. | Sumner | 0.37% | 0.11%(+0.265)#33 | 0.22%(+0.158)#1,614 |
| 34. | Freeport | 0.37% | 0.11%(+0.264)#34 | 0.22%(+0.157)#1,615 |
| 35. | Bridgeview | 0.35% | 0.11%(+0.246)#35 | 0.22%(+0.139)#1,662 |
| 36. | Geneva | 0.35% | 0.11%(+0.238)#36 | 0.22%(+0.131)#1,685 |
| 37. | Bensenville | 0.33% | 0.11%(+0.224)#37 | 0.22%(+0.117)#1,734 |
| 38. | Oakwood Hills | 0.32% | 0.11%(+0.215)#38 | 0.22%(+0.108)#1,746 |
| 39. | Zion | 0.32% | 0.11%(+0.213)#39 | 0.22%(+0.106)#1,754 |
| 40. | Wood Dale | 0.31% | 0.11%(+0.201)#40 | 0.22%(+0.094)#1,787 |
| 41. | Stone Park | 0.31% | 0.11%(+0.198)#41 | 0.22%(+0.091)#1,793 |
| 42. | Staunton | 0.31% | 0.11%(+0.198)#42 | 0.22%(+0.091)#1,798 |
| 43. | Lake Bluff | 0.30% | 0.11%(+0.196)#43 | 0.22%(+0.089)#1,804 |
| 44. | River Grove | 0.29% | 0.11%(+0.186)#44 | 0.22%(+0.079)#1,840 |
| 45. | Buffalo Grove | 0.29% | 0.11%(+0.185)#45 | 0.22%(+0.078)#1,848 |
| 46. | Batavia | 0.28% | 0.11%(+0.169)#46 | 0.22%(+0.062)#1,916 |
| 47. | Palatine | 0.27% | 0.11%(+0.161)#47 | 0.22%(+0.054)#1,947 |
| 48. | Belvidere | 0.27% | 0.11%(+0.160)#48 | 0.22%(+0.053)#1,955 |
| 49. | Wilmette | 0.27% | 0.11%(+0.158)#49 | 0.22%(+0.051)#1,961 |
| 50. | Streamwood | 0.27% | 0.11%(+0.157)#50 | 0.22%(+0.050)#1,964 |
| 51. | Huntley | 0.26% | 0.11%(+0.156)#51 | 0.22%(+0.049)#1,977 |
| 52. | Crest Hill | 0.25% | 0.11%(+0.143)#52 | 0.22%(+0.036)#2,042 |
| 53. | Waukegan | 0.24% | 0.11%(+0.137)#53 | 0.22%(+0.030)#2,081 |
| 54. | Pistakee Highlands | 0.24% | 0.11%(+0.135)#54 | 0.22%(+0.028)#2,091 |
| 55. | Good Hope | 0.24% | 0.11%(+0.132)#55 | 0.22%(+0.025)#2,098 |
| 56. | Lombard | 0.24% | 0.11%(+0.130)#56 | 0.22%(+0.023)#2,103 |
| 57. | Oak Park | 0.23% | 0.11%(+0.126)#57 | 0.22%(+0.019)#2,123 |
| 58. | Worth | 0.23% | 0.11%(+0.122)#58 | 0.22%(+0.015)#2,137 |
| 59. | Schaumburg | 0.22% | 0.11%(+0.111)#59 | 0.22%(+0.004)#2,182 |
| 60. | Deerfield | 0.21% | 0.11%(+0.106)#60 | 0.22%(-0.001)#2,202 |
| 61. | Burbank | 0.21% | 0.11%(+0.105)#61 | 0.22%(-0.002)#2,207 |
| 62. | Northlake | 0.21% | 0.11%(+0.105)#62 | 0.22%(-0.002)#2,208 |
| 63. | Carpentersville | 0.21% | 0.11%(+0.101)#63 | 0.22%(-0.006)#2,239 |
| 64. | Chicago | 0.20% | 0.11%(+0.095)#64 | 0.22%(-0.012)#2,269 |
| 65. | Cicero | 0.20% | 0.11%(+0.091)#65 | 0.22%(-0.016)#2,292 |
| 66. | Highland Park | 0.20% | 0.11%(+0.090)#66 | 0.22%(-0.017)#2,296 |
| 67. | Elmhurst | 0.19% | 0.11%(+0.087)#67 | 0.22%(-0.020)#2,318 |
| 68. | La Grange Park | 0.19% | 0.11%(+0.079)#68 | 0.22%(-0.028)#2,360 |
| 69. | Round Lake | 0.18% | 0.11%(+0.074)#69 | 0.22%(-0.033)#2,392 |
| 70. | Elk Grove Village | 0.17% | 0.11%(+0.064)#70 | 0.22%(-0.043)#2,440 |
| 71. | Johnsburg | 0.17% | 0.11%(+0.064)#71 | 0.22%(-0.043)#2,441 |
| 72. | Monmouth | 0.17% | 0.11%(+0.063)#72 | 0.22%(-0.044)#2,444 |
| 73. | Godfrey | 0.16% | 0.11%(+0.055)#73 | 0.22%(-0.052)#2,490 |
| 74. | Bolingbrook | 0.16% | 0.11%(+0.055)#74 | 0.22%(-0.053)#2,491 |
| 75. | Yorkville | 0.16% | 0.11%(+0.052)#75 | 0.22%(-0.055)#2,511 |
| 76. | Countryside | 0.16% | 0.11%(+0.050)#76 | 0.22%(-0.057)#2,519 |
| 77. | Brookfield | 0.16% | 0.11%(+0.047)#77 | 0.22%(-0.060)#2,544 |
| 78. | Arlington Heights | 0.15% | 0.11%(+0.046)#78 | 0.22%(-0.062)#2,560 |
| 79. | Champaign | 0.15% | 0.11%(+0.044)#79 | 0.22%(-0.063)#2,569 |
| 80. | Des Plaines | 0.15% | 0.11%(+0.042)#80 | 0.22%(-0.065)#2,578 |
| 81. | Lake Barrington | 0.15% | 0.11%(+0.041)#81 | 0.22%(-0.066)#2,584 |
| 82. | Lindenhurst | 0.15% | 0.11%(+0.038)#82 | 0.22%(-0.069)#2,600 |
| 83. | Macomb | 0.14% | 0.11%(+0.037)#83 | 0.22%(-0.071)#2,606 |
| 84. | Glendale Heights | 0.14% | 0.11%(+0.034)#84 | 0.22%(-0.073)#2,622 |
| 85. | Mchenry | 0.14% | 0.11%(+0.034)#85 | 0.22%(-0.073)#2,623 |
| 86. | Naperville | 0.14% | 0.11%(+0.032)#86 | 0.22%(-0.075)#2,634 |
| 87. | Gurnee | 0.14% | 0.11%(+0.029)#87 | 0.22%(-0.078)#2,645 |
| 88. | Hanover Park | 0.14% | 0.11%(+0.029)#88 | 0.22%(-0.078)#2,646 |
| 89. | Evergreen Park | 0.14% | 0.11%(+0.029)#89 | 0.22%(-0.078)#2,648 |
| 90. | Libertyville | 0.14% | 0.11%(+0.028)#90 | 0.22%(-0.079)#2,655 |
| 91. | St Charles | 0.13% | 0.11%(+0.026)#91 | 0.22%(-0.081)#2,668 |
| 92. | Chicago Ridge | 0.13% | 0.11%(+0.025)#92 | 0.22%(-0.082)#2,675 |
| 93. | Mascoutah | 0.13% | 0.11%(+0.017)#93 | 0.22%(-0.090)#2,725 |
| 94. | Chicago Heights | 0.12% | 0.11%(+0.012)#94 | 0.22%(-0.095)#2,761 |
| 95. | O Fallon | 0.12% | 0.11%(+0.010)#95 | 0.22%(-0.097)#2,780 |
| 96. | Granite City | 0.11% | 0.11%(+0.007)#96 | 0.22%(-0.101)#2,800 |
| 97. | New Lenox | 0.11% | 0.11%(+0.006)#97 | 0.22%(-0.101)#2,808 |
| 98. | Aurora | 0.11% | 0.11%(+0.004)#98 | 0.22%(-0.103)#2,820 |
| 99. | Round Lake Heights | 0.11% | 0.11%(+0.003)#99 | 0.22%(-0.104)#2,822 |
| 100. | Evanston | 0.11% | 0.11%(+0.003)#100 | 0.22%(-0.104)#2,826 |
Common Questions
What are the Top 10 Cities with the Highest Percentage of Peruvian Population in Illinois?
Top 10 Cities with the Highest Percentage of Peruvian Population in Illinois are:
#1
4.31%
#2
2.50%
#3
2.32%
#4
1.76%
#5
1.52%
#6
1.51%
#7
1.30%
#8
1.20%
#9
1.16%
#10
1.12%
What city has the Highest Percentage of Peruvian Population in Illinois?
Downs has the Highest Percentage of Peruvian Population in Illinois with 4.31%.
What is the Percentage of Peruvian Population in the State of Illinois?
Percentage of Peruvian Population in Illinois is 0.11%.
What is the Percentage of Peruvian Population in the United States?
Percentage of Peruvian Population in the United States is 0.22%.