Zip Codes with the Highest Percentage of Population Employed in Food Preparation & Serving in Orland Park, IL
RELATED REPORTS & OPTIONS
Food Preparation & Serving
Orland Park
Compare Zip Codes
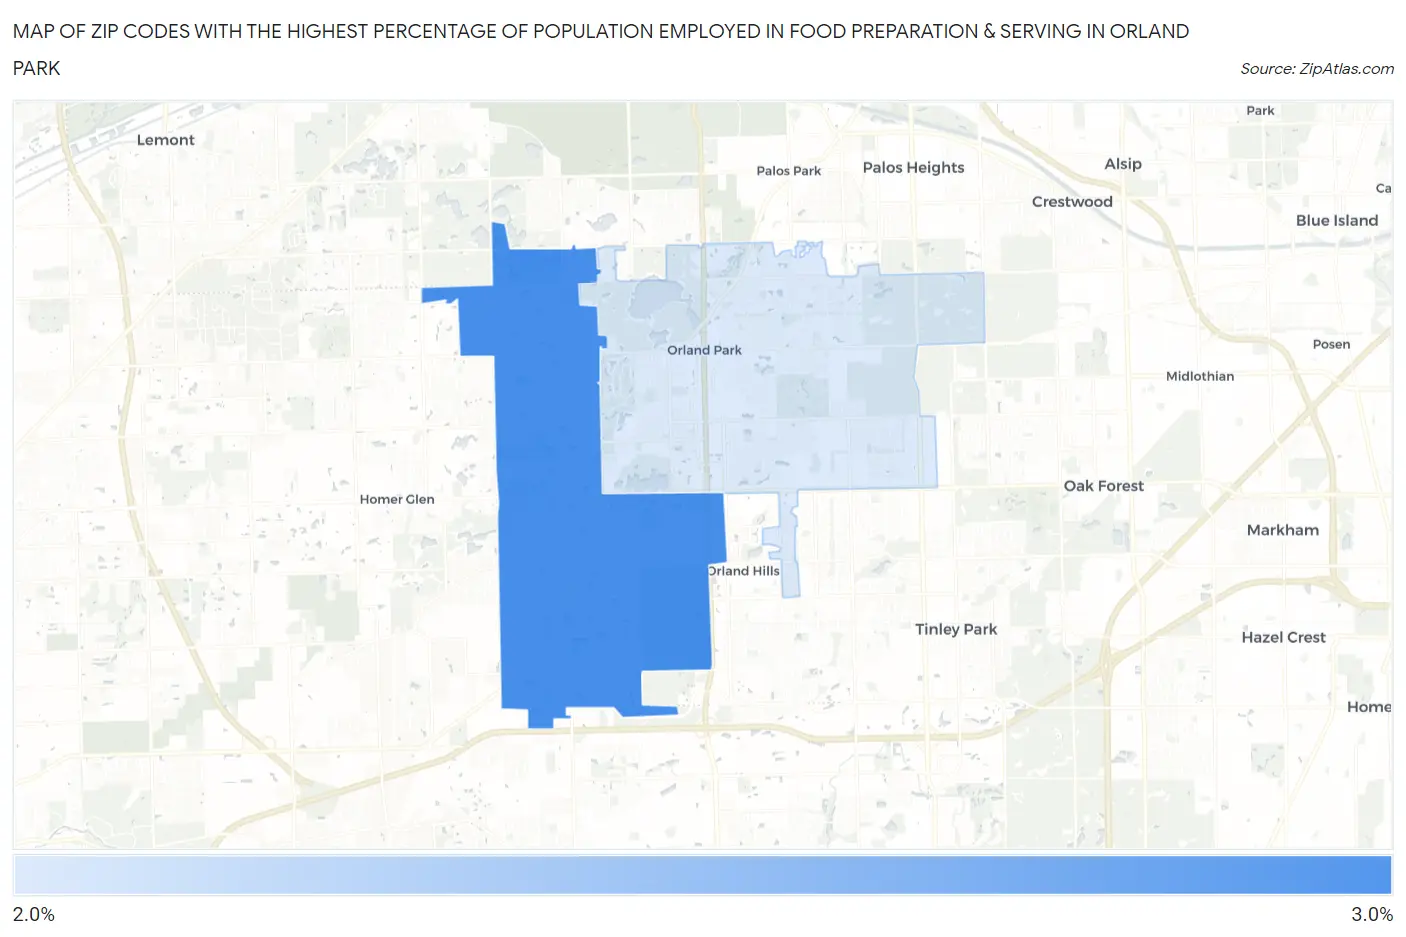
Map of Zip Codes with the Highest Percentage of Population Employed in Food Preparation & Serving in Orland Park
2.8%
3.0%
Zip Codes with the Highest Percentage of Population Employed in Food Preparation & Serving in Orland Park, IL
| Zip Code | % Employed | vs State | vs National | |
| 1. | 60467 | 3.0% | 5.0%(-2.04)#929 | 5.3%(-2.29)#21,281 |
| 2. | 60462 | 2.8% | 5.0%(-2.26)#974 | 5.3%(-2.51)#22,165 |
1
Common Questions
What are the Top Zip Codes with the Highest Percentage of Population Employed in Food Preparation & Serving in Orland Park, IL?
Top Zip Codes with the Highest Percentage of Population Employed in Food Preparation & Serving in Orland Park, IL are:
What zip code has the Highest Percentage of Population Employed in Food Preparation & Serving in Orland Park, IL?
60467 has the Highest Percentage of Population Employed in Food Preparation & Serving in Orland Park, IL with 3.0%.
What is the Percentage of Population Employed in Food Preparation & Serving in Orland Park, IL?
Percentage of Population Employed in Food Preparation & Serving in Orland Park is 2.9%.
What is the Percentage of Population Employed in Food Preparation & Serving in Illinois?
Percentage of Population Employed in Food Preparation & Serving in Illinois is 5.0%.
What is the Percentage of Population Employed in Food Preparation & Serving in the United States?
Percentage of Population Employed in Food Preparation & Serving in the United States is 5.3%.