Zip Codes with the Highest Percentage of Population Employed in Food Preparation & Serving in Decatur, IL
RELATED REPORTS & OPTIONS
Food Preparation & Serving
Decatur
Compare Zip Codes
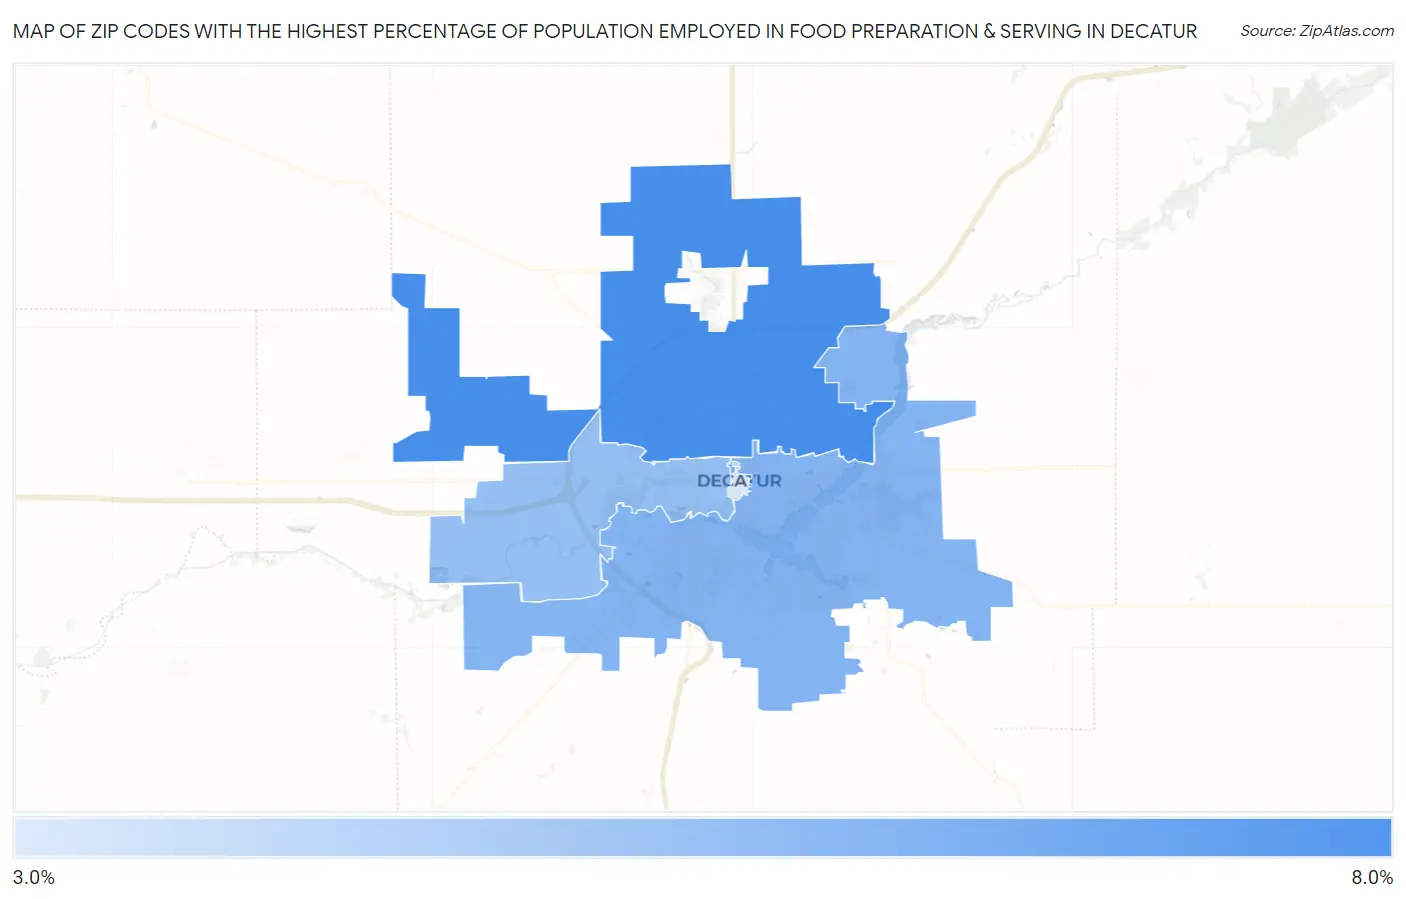
Map of Zip Codes with the Highest Percentage of Population Employed in Food Preparation & Serving in Decatur
3.3%
7.4%
Zip Codes with the Highest Percentage of Population Employed in Food Preparation & Serving in Decatur, IL
| Zip Code | % Employed | vs State | vs National | |
| 1. | 62526 | 7.4% | 5.0%(+2.34)#230 | 5.3%(+2.09)#5,789 |
| 2. | 62521 | 5.7% | 5.0%(+0.661)#441 | 5.3%(+0.409)#10,363 |
| 3. | 62522 | 5.2% | 5.0%(+0.162)#522 | 5.3%(-0.090)#12,159 |
| 4. | 62523 | 3.3% | 5.0%(-1.74)#866 | 5.3%(-1.99)#20,083 |
1
Common Questions
What are the Top 3 Zip Codes with the Highest Percentage of Population Employed in Food Preparation & Serving in Decatur, IL?
Top 3 Zip Codes with the Highest Percentage of Population Employed in Food Preparation & Serving in Decatur, IL are:
What zip code has the Highest Percentage of Population Employed in Food Preparation & Serving in Decatur, IL?
62526 has the Highest Percentage of Population Employed in Food Preparation & Serving in Decatur, IL with 7.4%.
What is the Percentage of Population Employed in Food Preparation & Serving in Decatur, IL?
Percentage of Population Employed in Food Preparation & Serving in Decatur is 6.3%.
What is the Percentage of Population Employed in Food Preparation & Serving in Illinois?
Percentage of Population Employed in Food Preparation & Serving in Illinois is 5.0%.
What is the Percentage of Population Employed in Food Preparation & Serving in the United States?
Percentage of Population Employed in Food Preparation & Serving in the United States is 5.3%.