Zip Codes with the Highest Percentage of Population Employed in Food Preparation & Serving in Belleville, IL
RELATED REPORTS & OPTIONS
Food Preparation & Serving
Belleville
Compare Zip Codes
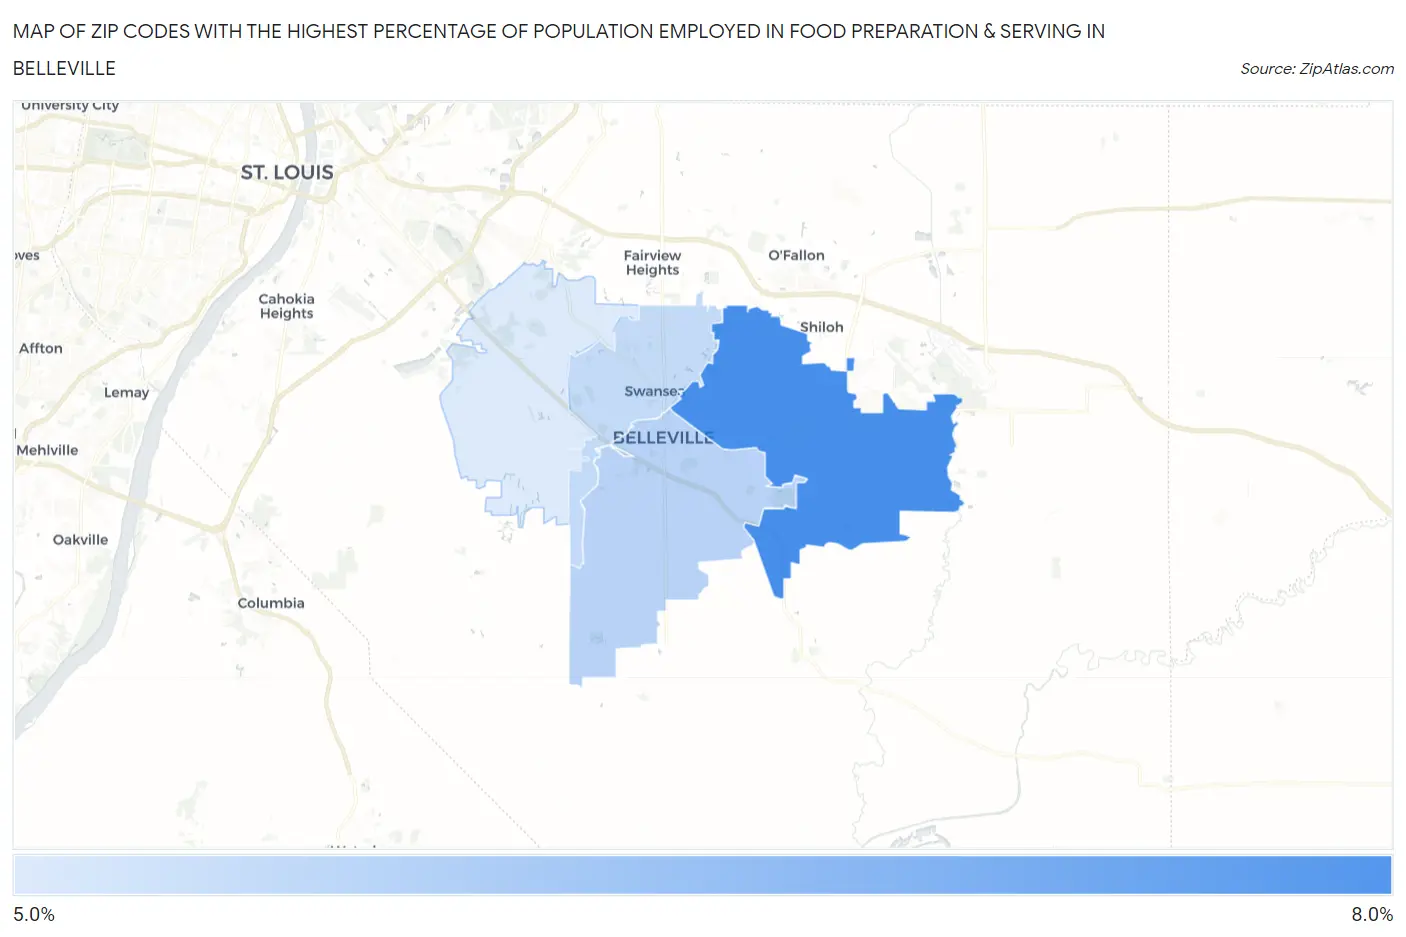
Map of Zip Codes with the Highest Percentage of Population Employed in Food Preparation & Serving in Belleville
5.6%
6.7%
Zip Codes with the Highest Percentage of Population Employed in Food Preparation & Serving in Belleville, IL
| Zip Code | % Employed | vs State | vs National | |
| 1. | 62221 | 6.7% | 5.0%(+1.69)#304 | 5.3%(+1.44)#7,284 |
| 2. | 62220 | 5.9% | 5.0%(+0.864)#408 | 5.3%(+0.612)#9,692 |
| 3. | 62226 | 5.8% | 5.0%(+0.784)#420 | 5.3%(+0.532)#9,969 |
| 4. | 62223 | 5.6% | 5.0%(+0.592)#452 | 5.3%(+0.340)#10,620 |
1
Common Questions
What are the Top 3 Zip Codes with the Highest Percentage of Population Employed in Food Preparation & Serving in Belleville, IL?
Top 3 Zip Codes with the Highest Percentage of Population Employed in Food Preparation & Serving in Belleville, IL are:
What zip code has the Highest Percentage of Population Employed in Food Preparation & Serving in Belleville, IL?
62221 has the Highest Percentage of Population Employed in Food Preparation & Serving in Belleville, IL with 6.7%.
What is the Percentage of Population Employed in Food Preparation & Serving in Belleville, IL?
Percentage of Population Employed in Food Preparation & Serving in Belleville is 6.1%.
What is the Percentage of Population Employed in Food Preparation & Serving in Illinois?
Percentage of Population Employed in Food Preparation & Serving in Illinois is 5.0%.
What is the Percentage of Population Employed in Food Preparation & Serving in the United States?
Percentage of Population Employed in Food Preparation & Serving in the United States is 5.3%.