Zip Codes with the Highest Percentage of Population Employed in Food Preparation & Serving in Champaign, IL
RELATED REPORTS & OPTIONS
Food Preparation & Serving
Champaign
Compare Zip Codes
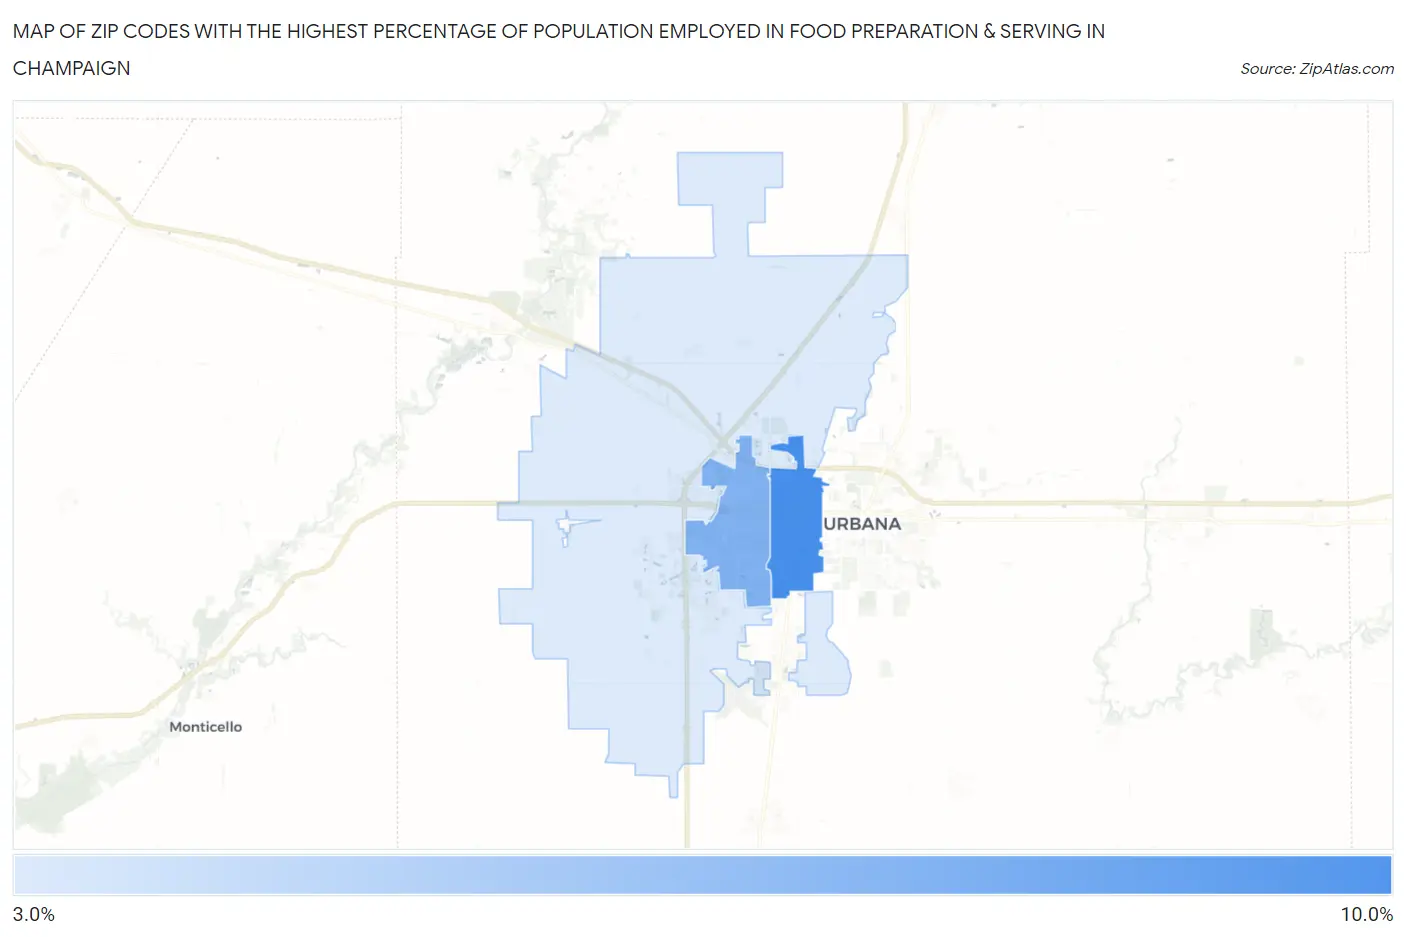
Map of Zip Codes with the Highest Percentage of Population Employed in Food Preparation & Serving in Champaign
3.2%
9.4%
Zip Codes with the Highest Percentage of Population Employed in Food Preparation & Serving in Champaign, IL
| Zip Code | % Employed | vs State | vs National | |
| 1. | 61820 | 9.4% | 5.0%(+4.37)#128 | 5.3%(+4.12)#3,131 |
| 2. | 61821 | 7.0% | 5.0%(+1.98)#263 | 5.3%(+1.73)#6,524 |
| 3. | 61822 | 3.2% | 5.0%(-1.83)#882 | 5.3%(-2.08)#20,468 |
1
Common Questions
What are the Top Zip Codes with the Highest Percentage of Population Employed in Food Preparation & Serving in Champaign, IL?
Top Zip Codes with the Highest Percentage of Population Employed in Food Preparation & Serving in Champaign, IL are:
What zip code has the Highest Percentage of Population Employed in Food Preparation & Serving in Champaign, IL?
61820 has the Highest Percentage of Population Employed in Food Preparation & Serving in Champaign, IL with 9.4%.
What is the Percentage of Population Employed in Food Preparation & Serving in Champaign, IL?
Percentage of Population Employed in Food Preparation & Serving in Champaign is 7.2%.
What is the Percentage of Population Employed in Food Preparation & Serving in Illinois?
Percentage of Population Employed in Food Preparation & Serving in Illinois is 5.0%.
What is the Percentage of Population Employed in Food Preparation & Serving in the United States?
Percentage of Population Employed in Food Preparation & Serving in the United States is 5.3%.