Cities with the Highest Percentage of Immigrants from North Macedonia in Illinois
RELATED REPORTS & OPTIONS
North Macedonia
Illinois
Compare Cities
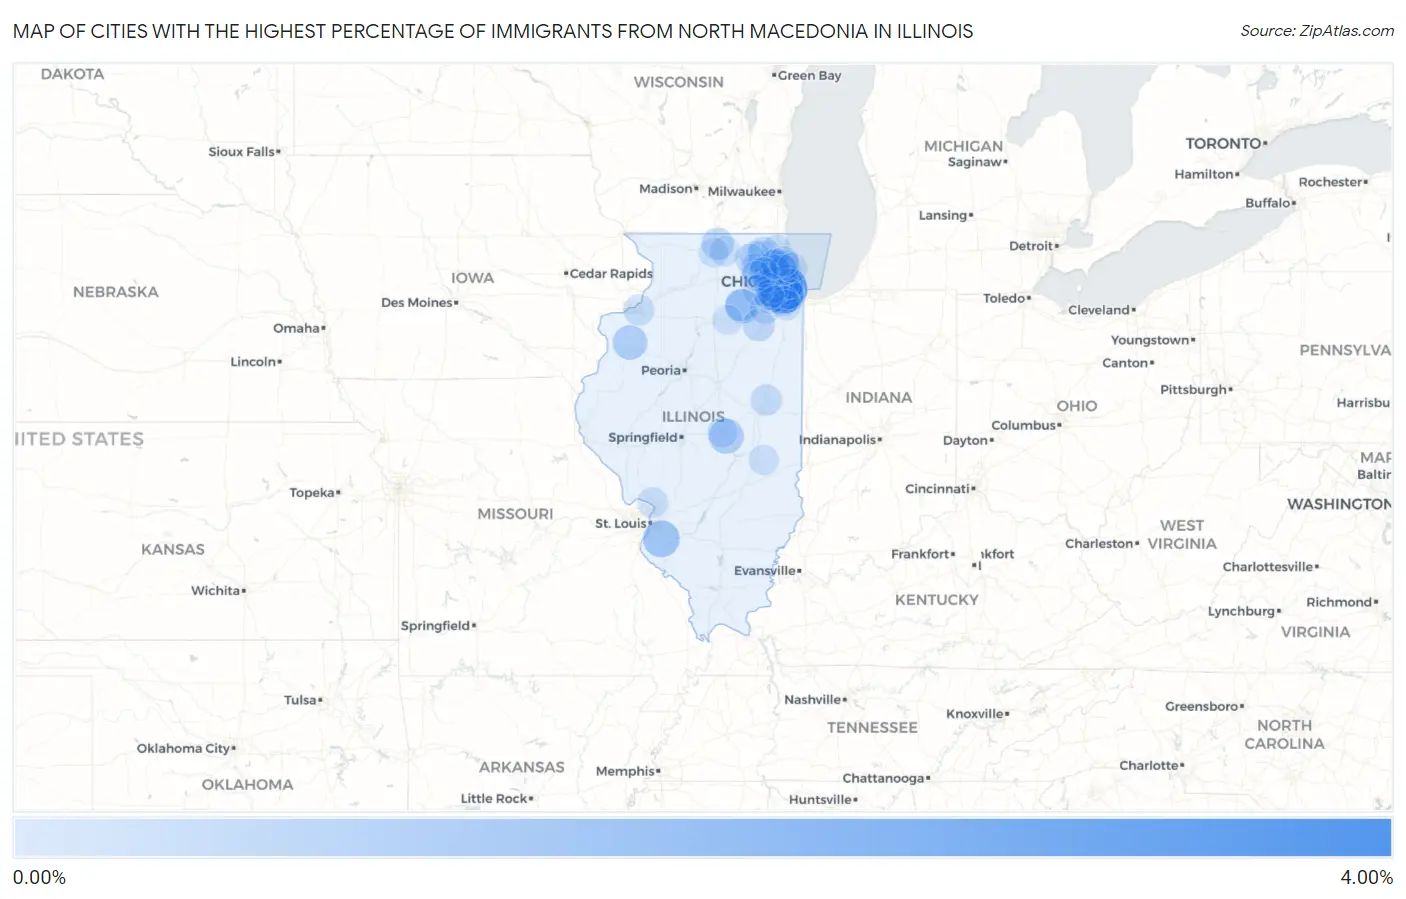
Map of Cities with the Highest Percentage of Immigrants from North Macedonia in Illinois
0.00%
4.00%
Cities with the Highest Percentage of Immigrants from North Macedonia in Illinois
| City | North Macedonia | vs State | vs National | |
| 1. | Countryside | 3.21% | 0.033%(+3.18)#1 | 0.0086%(+3.20)#6 |
| 2. | Palos Hills | 1.40% | 0.033%(+1.36)#2 | 0.0086%(+1.39)#17 |
| 3. | Hickory Hills | 1.25% | 0.033%(+1.22)#3 | 0.0086%(+1.25)#20 |
| 4. | Lyons | 1.16% | 0.033%(+1.13)#4 | 0.0086%(+1.15)#24 |
| 5. | Smithton | 1.05% | 0.033%(+1.02)#5 | 0.0086%(+1.04)#27 |
| 6. | Long Creek | 0.76% | 0.033%(+0.726)#6 | 0.0086%(+0.750)#40 |
| 7. | Alexis | 0.70% | 0.033%(+0.666)#7 | 0.0086%(+0.691)#44 |
| 8. | Newark | 0.61% | 0.033%(+0.573)#8 | 0.0086%(+0.597)#52 |
| 9. | Darien | 0.57% | 0.033%(+0.536)#9 | 0.0086%(+0.561)#56 |
| 10. | Westmont | 0.49% | 0.033%(+0.461)#10 | 0.0086%(+0.486)#65 |
| 11. | Millington | 0.36% | 0.033%(+0.327)#11 | 0.0086%(+0.352)#81 |
| 12. | Coal City | 0.34% | 0.033%(+0.312)#12 | 0.0086%(+0.336)#86 |
| 13. | Machesney Park | 0.32% | 0.033%(+0.291)#13 | 0.0086%(+0.315)#88 |
| 14. | Palos Park | 0.31% | 0.033%(+0.277)#14 | 0.0086%(+0.302)#92 |
| 15. | Chicago Ridge | 0.25% | 0.033%(+0.212)#15 | 0.0086%(+0.236)#113 |
| 16. | Mount Prospect | 0.24% | 0.033%(+0.207)#16 | 0.0086%(+0.232)#114 |
| 17. | Des Plaines | 0.20% | 0.033%(+0.172)#17 | 0.0086%(+0.196)#133 |
| 18. | Rantoul | 0.20% | 0.033%(+0.166)#18 | 0.0086%(+0.191)#137 |
| 19. | Fox River Grove | 0.20% | 0.033%(+0.163)#19 | 0.0086%(+0.187)#139 |
| 20. | Port Barrington | 0.19% | 0.033%(+0.160)#20 | 0.0086%(+0.184)#140 |
| 21. | Bloomingdale | 0.16% | 0.033%(+0.123)#21 | 0.0086%(+0.147)#162 |
| 22. | Silvis | 0.15% | 0.033%(+0.118)#22 | 0.0086%(+0.143)#165 |
| 23. | Berwyn | 0.14% | 0.033%(+0.105)#23 | 0.0086%(+0.129)#172 |
| 24. | Alton | 0.13% | 0.033%(+0.100)#24 | 0.0086%(+0.124)#175 |
| 25. | Elgin | 0.11% | 0.033%(+0.079)#25 | 0.0086%(+0.104)#188 |
| 26. | Schaumburg | 0.11% | 0.033%(+0.075)#26 | 0.0086%(+0.100)#190 |
| 27. | Lemont | 0.11% | 0.033%(+0.075)#27 | 0.0086%(+0.100)#191 |
| 28. | Joliet | 0.11% | 0.033%(+0.073)#28 | 0.0086%(+0.097)#194 |
| 29. | Brookfield | 0.10% | 0.033%(+0.070)#29 | 0.0086%(+0.095)#196 |
| 30. | Lombard | 0.10% | 0.033%(+0.069)#30 | 0.0086%(+0.094)#199 |
| 31. | Niles | 0.095% | 0.033%(+0.062)#31 | 0.0086%(+0.086)#210 |
| 32. | South Elgin | 0.084% | 0.033%(+0.051)#32 | 0.0086%(+0.075)#222 |
| 33. | Oak Lawn | 0.066% | 0.033%(+0.033)#33 | 0.0086%(+0.057)#231 |
| 34. | Streamwood | 0.066% | 0.033%(+0.033)#34 | 0.0086%(+0.057)#232 |
| 35. | Palatine | 0.060% | 0.033%(+0.026)#35 | 0.0086%(+0.051)#237 |
| 36. | Wheaton | 0.056% | 0.033%(+0.023)#36 | 0.0086%(+0.047)#245 |
| 37. | Naperville | 0.052% | 0.033%(+0.019)#37 | 0.0086%(+0.044)#249 |
| 38. | Lake In The Hills | 0.052% | 0.033%(+0.019)#38 | 0.0086%(+0.043)#250 |
| 39. | Rolling Meadows | 0.050% | 0.033%(+0.017)#39 | 0.0086%(+0.041)#258 |
| 40. | Libertyville | 0.049% | 0.033%(+0.016)#40 | 0.0086%(+0.040)#261 |
| 41. | Glenview | 0.048% | 0.033%(+0.015)#41 | 0.0086%(+0.039)#265 |
| 42. | Woodridge | 0.047% | 0.033%(+0.014)#42 | 0.0086%(+0.038)#269 |
| 43. | Downers Grove | 0.046% | 0.033%(+0.013)#43 | 0.0086%(+0.037)#272 |
| 44. | Carol Stream | 0.045% | 0.033%(+0.012)#44 | 0.0086%(+0.037)#273 |
| 45. | Charleston | 0.045% | 0.033%(+0.012)#45 | 0.0086%(+0.036)#275 |
| 46. | Park Ridge | 0.043% | 0.033%(+0.010)#46 | 0.0086%(+0.035)#282 |
| 47. | Elk Grove Village | 0.043% | 0.033%(+0.010)#47 | 0.0086%(+0.035)#283 |
| 48. | Huntley | 0.040% | 0.033%(+0.007)#48 | 0.0086%(+0.031)#288 |
| 49. | Chicago | 0.039% | 0.033%(+0.006)#49 | 0.0086%(+0.030)#290 |
| 50. | Aurora | 0.037% | 0.033%(+0.004)#50 | 0.0086%(+0.029)#296 |
| 51. | Romeoville | 0.035% | 0.033%(+0.002)#51 | 0.0086%(+0.026)#299 |
| 52. | Decatur | 0.034% | 0.033%(+0.001)#52 | 0.0086%(+0.025)#302 |
| 53. | Tinley Park | 0.032% | 0.033%(-0.001)#53 | 0.0086%(+0.024)#305 |
| 54. | Arlington Heights | 0.026% | 0.033%(-0.007)#54 | 0.0086%(+0.017)#312 |
| 55. | Evanston | 0.026% | 0.033%(-0.007)#55 | 0.0086%(+0.017)#313 |
| 56. | Belvidere | 0.024% | 0.033%(-0.009)#56 | 0.0086%(+0.015)#321 |
| 57. | Orland Park | 0.022% | 0.033%(-0.011)#57 | 0.0086%(+0.014)#324 |
| 58. | Northbrook | 0.020% | 0.033%(-0.013)#58 | 0.0086%(+0.011)#333 |
| 59. | St Charles | 0.018% | 0.033%(-0.015)#59 | 0.0086%(+0.010)#338 |
| 60. | Ottawa | 0.016% | 0.033%(-0.017)#60 | 0.0086%(+0.007)#344 |
| 61. | Bolingbrook | 0.011% | 0.033%(-0.022)#61 | 0.0086%(+0.002)#365 |
| 62. | Rockford | 0.0054% | 0.033%(-0.028)#62 | 0.0086%(-0.003)#392 |
| 63. | Bartlett | 0.0049% | 0.033%(-0.028)#63 | 0.0086%(-0.004)#396 |
Common Questions
What are the Top 10 Cities with the Highest Percentage of Immigrants from North Macedonia in Illinois?
Top 10 Cities with the Highest Percentage of Immigrants from North Macedonia in Illinois are:
#1
3.21%
#2
1.40%
#3
1.25%
#4
1.16%
#5
1.05%
#6
0.76%
#7
0.70%
#8
0.61%
#9
0.57%
#10
0.49%
What city has the Highest Percentage of Immigrants from North Macedonia in Illinois?
Countryside has the Highest Percentage of Immigrants from North Macedonia in Illinois with 3.21%.
What is the Percentage of Immigrants from North Macedonia in the State of Illinois?
Percentage of Immigrants from North Macedonia in Illinois is 0.033%.
What is the Percentage of Immigrants from North Macedonia in the United States?
Percentage of Immigrants from North Macedonia in the United States is 0.0086%.