Cities with the Highest Unemployment Rate Among Females in Illinois
RELATED REPORTS & OPTIONS
Highest Unemployment | Female
Illinois
Compare Cities
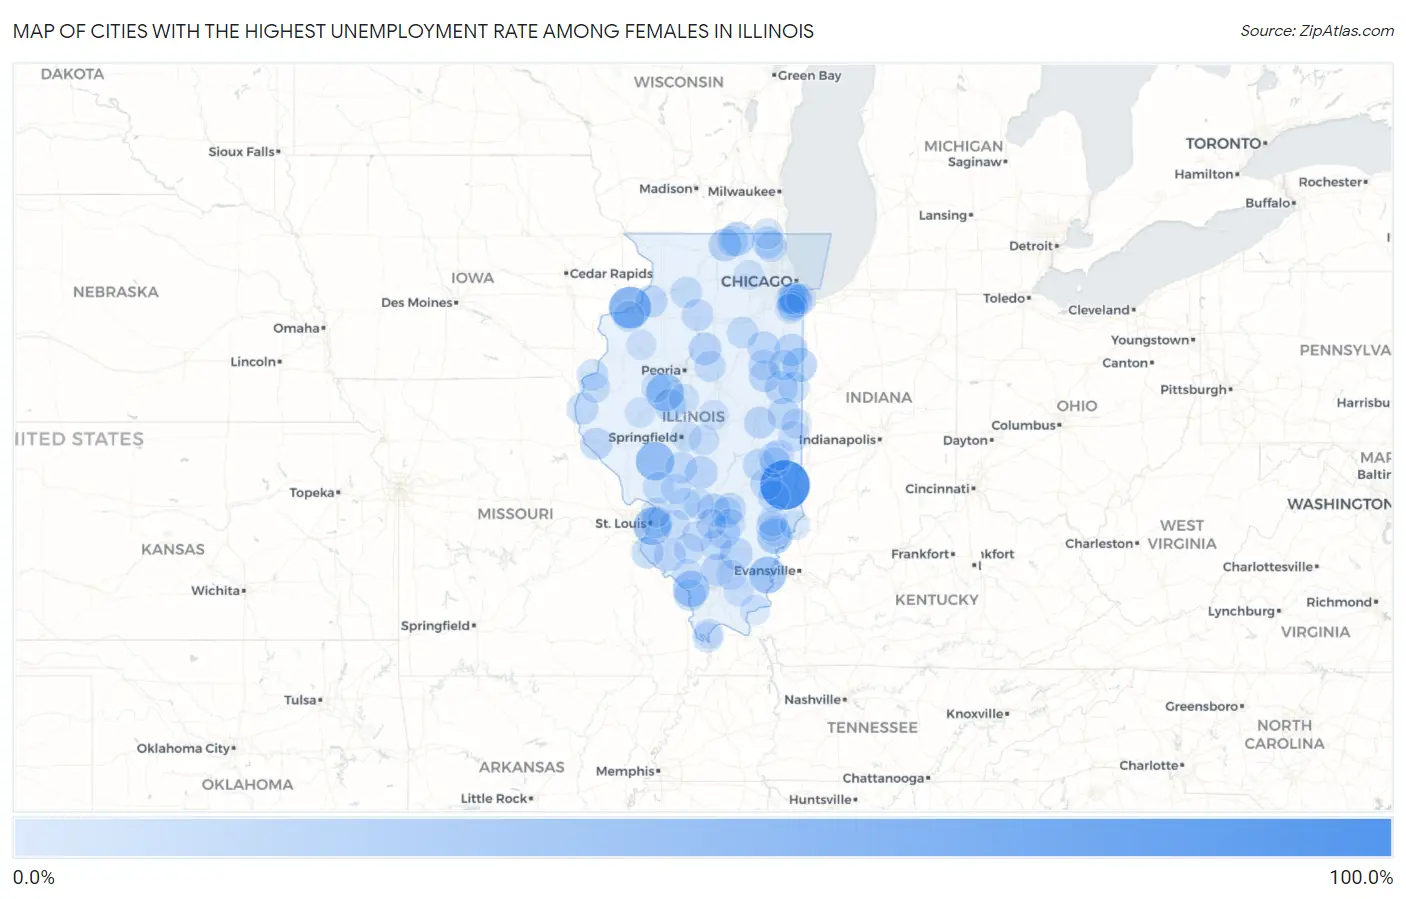
Map of Cities with the Highest Unemployment Rate Among Females in Illinois
0.0%
100.0%
Cities with the Highest Unemployment Rate Among Females in Illinois
| City | Female Unemployment | vs State | vs National | |
| 1. | Mossville | 100.0% | 5.5%(+94.5)#1 | 4.9%(+95.1)#17 |
| 2. | Annapolis | 100.0% | 5.5%(+94.5)#2 | 4.9%(+95.1)#49 |
| 3. | Rock Island Arsenal | 64.3% | 5.5%(+58.8)#3 | 4.9%(+59.4)#122 |
| 4. | Scottville | 50.0% | 5.5%(+44.5)#4 | 4.9%(+45.1)#236 |
| 5. | Unity | 50.0% | 5.5%(+44.5)#5 | 4.9%(+45.1)#238 |
| 6. | Andres | 47.4% | 5.5%(+41.9)#6 | 4.9%(+42.5)#254 |
| 7. | Goofy Ridge | 46.7% | 5.5%(+41.2)#7 | 4.9%(+41.8)#266 |
| 8. | Sauget | 46.2% | 5.5%(+40.7)#8 | 4.9%(+41.3)#272 |
| 9. | New Haven | 42.6% | 5.5%(+37.1)#9 | 4.9%(+37.7)#314 |
| 10. | Gorham | 40.0% | 5.5%(+34.5)#10 | 4.9%(+35.1)#342 |
| 11. | Bone Gap | 35.9% | 5.5%(+30.4)#11 | 4.9%(+31.0)#439 |
| 12. | Sheldon | 30.1% | 5.5%(+24.6)#12 | 4.9%(+25.2)#613 |
| 13. | Chemung | 30.0% | 5.5%(+24.5)#13 | 4.9%(+25.1)#618 |
| 14. | Barstow | 28.6% | 5.5%(+23.1)#14 | 4.9%(+23.7)#698 |
| 15. | Sunnyland | 27.6% | 5.5%(+22.1)#15 | 4.9%(+22.7)#753 |
| 16. | Phoenix | 25.5% | 5.5%(+20.0)#16 | 4.9%(+20.6)#862 |
| 17. | Rankin | 25.5% | 5.5%(+20.0)#17 | 4.9%(+20.6)#864 |
| 18. | Buckner | 25.0% | 5.5%(+19.5)#18 | 4.9%(+20.1)#889 |
| 19. | La Rose | 25.0% | 5.5%(+19.5)#19 | 4.9%(+20.1)#899 |
| 20. | Vernon | 25.0% | 5.5%(+19.5)#20 | 4.9%(+20.1)#901 |
| 21. | Wenonah | 25.0% | 5.5%(+19.5)#21 | 4.9%(+20.1)#912 |
| 22. | Timberlane | 24.7% | 5.5%(+19.2)#22 | 4.9%(+19.8)#920 |
| 23. | Dahlgren | 24.4% | 5.5%(+18.9)#23 | 4.9%(+19.5)#937 |
| 24. | Papineau | 24.1% | 5.5%(+18.6)#24 | 4.9%(+19.2)#953 |
| 25. | Kell | 23.8% | 5.5%(+18.3)#25 | 4.9%(+18.9)#977 |
| 26. | Cabery | 23.7% | 5.5%(+18.2)#26 | 4.9%(+18.8)#985 |
| 27. | Easton | 23.0% | 5.5%(+17.5)#27 | 4.9%(+18.1)#1,051 |
| 28. | Hillsdale | 22.9% | 5.5%(+17.4)#28 | 4.9%(+18.0)#1,059 |
| 29. | Baldwin | 22.7% | 5.5%(+17.2)#29 | 4.9%(+17.8)#1,072 |
| 30. | Riverdale | 22.5% | 5.5%(+17.0)#30 | 4.9%(+17.6)#1,083 |
| 31. | Roberts | 22.3% | 5.5%(+16.8)#31 | 4.9%(+17.4)#1,113 |
| 32. | Muncie | 22.2% | 5.5%(+16.7)#32 | 4.9%(+17.3)#1,129 |
| 33. | Maeystown | 22.2% | 5.5%(+16.7)#33 | 4.9%(+17.3)#1,132 |
| 34. | Tolono | 22.1% | 5.5%(+16.6)#34 | 4.9%(+17.2)#1,136 |
| 35. | Kinderhook | 22.0% | 5.5%(+16.5)#35 | 4.9%(+17.1)#1,146 |
| 36. | Waggoner | 21.7% | 5.5%(+16.2)#36 | 4.9%(+16.8)#1,165 |
| 37. | Hidalgo | 21.7% | 5.5%(+16.2)#37 | 4.9%(+16.8)#1,166 |
| 38. | Grand Tower | 21.5% | 5.5%(+16.0)#38 | 4.9%(+16.6)#1,179 |
| 39. | Farina | 21.4% | 5.5%(+15.9)#39 | 4.9%(+16.5)#1,189 |
| 40. | Willow Hill | 21.4% | 5.5%(+15.9)#40 | 4.9%(+16.5)#1,191 |
| 41. | Long Lake | 21.0% | 5.5%(+15.5)#41 | 4.9%(+16.1)#1,222 |
| 42. | Malden | 20.9% | 5.5%(+15.4)#42 | 4.9%(+16.0)#1,231 |
| 43. | Lerna | 20.9% | 5.5%(+15.4)#43 | 4.9%(+16.0)#1,232 |
| 44. | Lima | 20.9% | 5.5%(+15.4)#44 | 4.9%(+16.0)#1,233 |
| 45. | Washington Park | 20.5% | 5.5%(+15.0)#45 | 4.9%(+15.6)#1,268 |
| 46. | Old Ripley | 20.0% | 5.5%(+14.5)#46 | 4.9%(+15.1)#1,319 |
| 47. | Harmon | 20.0% | 5.5%(+14.5)#47 | 4.9%(+15.1)#1,320 |
| 48. | Burtons Bridge | 19.6% | 5.5%(+14.1)#48 | 4.9%(+14.7)#1,371 |
| 49. | Round Lake Park | 19.5% | 5.5%(+14.0)#49 | 4.9%(+14.6)#1,373 |
| 50. | Pontoosuc | 19.2% | 5.5%(+13.7)#50 | 4.9%(+14.3)#1,413 |
| 51. | Shipman | 19.0% | 5.5%(+13.5)#51 | 4.9%(+14.1)#1,425 |
| 52. | Secor | 19.0% | 5.5%(+13.5)#52 | 4.9%(+14.1)#1,429 |
| 53. | Kinsman | 19.0% | 5.5%(+13.5)#53 | 4.9%(+14.1)#1,436 |
| 54. | Dewey | 18.8% | 5.5%(+13.3)#54 | 4.9%(+13.9)#1,455 |
| 55. | Kinmundy | 18.6% | 5.5%(+13.1)#55 | 4.9%(+13.7)#1,477 |
| 56. | Hoopeston | 18.5% | 5.5%(+13.0)#56 | 4.9%(+13.6)#1,483 |
| 57. | Ashmore | 18.1% | 5.5%(+12.6)#57 | 4.9%(+13.2)#1,548 |
| 58. | Capron | 17.9% | 5.5%(+12.4)#58 | 4.9%(+13.0)#1,563 |
| 59. | Piper City | 17.8% | 5.5%(+12.3)#59 | 4.9%(+12.9)#1,582 |
| 60. | Woodlawn | 17.7% | 5.5%(+12.2)#60 | 4.9%(+12.8)#1,589 |
| 61. | Blue Island | 17.6% | 5.5%(+12.1)#61 | 4.9%(+12.7)#1,590 |
| 62. | Crescent City | 17.4% | 5.5%(+11.9)#62 | 4.9%(+12.5)#1,636 |
| 63. | Oak Grove | 17.4% | 5.5%(+11.9)#63 | 4.9%(+12.5)#1,637 |
| 64. | Lake Catherine | 17.3% | 5.5%(+11.8)#64 | 4.9%(+12.4)#1,646 |
| 65. | Kansas | 17.2% | 5.5%(+11.7)#65 | 4.9%(+12.3)#1,668 |
| 66. | West Salem | 17.1% | 5.5%(+11.6)#66 | 4.9%(+12.2)#1,683 |
| 67. | Hazel Crest | 16.9% | 5.5%(+11.4)#67 | 4.9%(+12.0)#1,705 |
| 68. | Smithboro | 16.7% | 5.5%(+11.2)#68 | 4.9%(+11.8)#1,760 |
| 69. | New Minden | 16.7% | 5.5%(+11.2)#69 | 4.9%(+11.8)#1,761 |
| 70. | Robbins | 16.6% | 5.5%(+11.1)#70 | 4.9%(+11.7)#1,780 |
| 71. | Clear Lake | 16.4% | 5.5%(+10.9)#71 | 4.9%(+11.5)#1,808 |
| 72. | Chrisman | 16.0% | 5.5%(+10.5)#72 | 4.9%(+11.1)#1,878 |
| 73. | Mount Auburn | 16.0% | 5.5%(+10.5)#73 | 4.9%(+11.1)#1,885 |
| 74. | Ferris | 16.0% | 5.5%(+10.5)#74 | 4.9%(+11.1)#1,892 |
| 75. | Oakdale | 15.9% | 5.5%(+10.4)#75 | 4.9%(+11.0)#1,918 |
| 76. | Lake Ka Ho | 15.9% | 5.5%(+10.4)#76 | 4.9%(+11.0)#1,919 |
| 77. | Bryant | 15.9% | 5.5%(+10.4)#77 | 4.9%(+11.0)#1,920 |
| 78. | Parkersburg | 15.8% | 5.5%(+10.3)#78 | 4.9%(+10.9)#1,941 |
| 79. | Thompsonville | 15.7% | 5.5%(+10.2)#79 | 4.9%(+10.8)#1,956 |
| 80. | Flossmoor | 15.5% | 5.5%(+10.00)#80 | 4.9%(+10.6)#1,989 |
| 81. | Summerfield | 15.4% | 5.5%(+9.90)#81 | 4.9%(+10.5)#2,016 |
| 82. | Mitchell | 15.3% | 5.5%(+9.80)#82 | 4.9%(+10.4)#2,045 |
| 83. | Carrier Mills | 15.1% | 5.5%(+9.60)#83 | 4.9%(+10.2)#2,086 |
| 84. | Cairo | 15.1% | 5.5%(+9.60)#84 | 4.9%(+10.2)#2,087 |
| 85. | Westfield | 15.1% | 5.5%(+9.60)#85 | 4.9%(+10.2)#2,096 |
| 86. | Burnham | 15.0% | 5.5%(+9.50)#86 | 4.9%(+10.1)#2,106 |
| 87. | Georgetown | 15.0% | 5.5%(+9.50)#87 | 4.9%(+10.1)#2,109 |
| 88. | Calhoun | 15.0% | 5.5%(+9.50)#88 | 4.9%(+10.1)#2,131 |
| 89. | Iuka | 14.9% | 5.5%(+9.40)#89 | 4.9%(+10.00)#2,156 |
| 90. | Sandoval | 14.7% | 5.5%(+9.20)#90 | 4.9%(+9.80)#2,203 |
| 91. | San Jose | 14.6% | 5.5%(+9.10)#91 | 4.9%(+9.70)#2,226 |
| 92. | Lily Lake | 14.3% | 5.5%(+8.80)#92 | 4.9%(+9.40)#2,282 |
| 93. | Kenney | 14.3% | 5.5%(+8.80)#93 | 4.9%(+9.40)#2,289 |
| 94. | Campbell Hill | 14.3% | 5.5%(+8.80)#94 | 4.9%(+9.40)#2,292 |
| 95. | Browning | 14.3% | 5.5%(+8.80)#95 | 4.9%(+9.40)#2,308 |
| 96. | Rosiclare | 14.1% | 5.5%(+8.60)#96 | 4.9%(+9.20)#2,352 |
| 97. | Matteson | 13.9% | 5.5%(+8.40)#97 | 4.9%(+9.00)#2,390 |
| 98. | St Francisville | 13.9% | 5.5%(+8.40)#98 | 4.9%(+9.00)#2,408 |
| 99. | Henderson | 13.9% | 5.5%(+8.40)#99 | 4.9%(+9.00)#2,414 |
| 100. | Mound City | 13.8% | 5.5%(+8.30)#100 | 4.9%(+8.90)#2,432 |
Common Questions
What are the Top 10 Cities with the Highest Unemployment Rate Among Females in Illinois?
Top 10 Cities with the Highest Unemployment Rate Among Females in Illinois are:
#1
100.0%
#2
64.3%
#3
50.0%
#4
46.7%
#5
46.2%
#6
42.6%
#7
40.0%
#8
35.9%
#9
30.1%
#10
30.0%
What city has the Highest Unemployment Rate Among Females in Illinois?
Annapolis has the Highest Unemployment Rate Among Females in Illinois with 100.0%.
What is the Unemployment Rate Among Females in the State of Illinois?
Unemployment Rate Among Females in Illinois is 5.5%.
What is the Unemployment Rate Among Females in the United States?
Unemployment Rate Among Females in the United States is 4.9%.