Zip Codes with the Highest Percentage of Population Employed in Food Preparation & Serving in Aurora, IL
RELATED REPORTS & OPTIONS
Food Preparation & Serving
Aurora
Compare Zip Codes
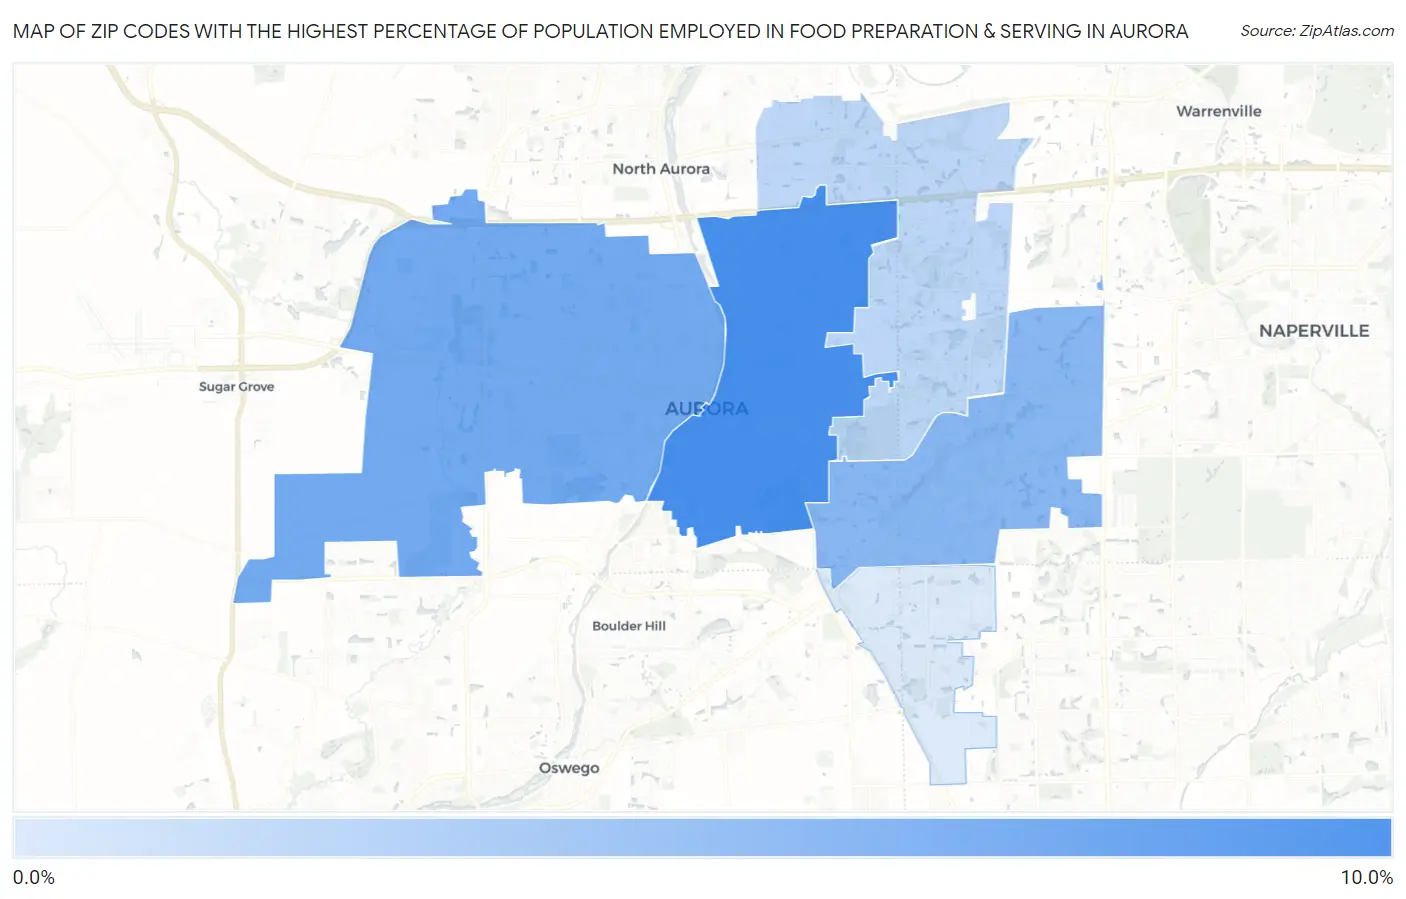
Map of Zip Codes with the Highest Percentage of Population Employed in Food Preparation & Serving in Aurora
2.0%
8.8%
Zip Codes with the Highest Percentage of Population Employed in Food Preparation & Serving in Aurora, IL
| Zip Code | % Employed | vs State | vs National | |
| 1. | 60505 | 8.8% | 5.0%(+3.73)#153 | 5.3%(+3.48)#3,763 |
| 2. | 60506 | 6.7% | 5.0%(+1.68)#307 | 5.3%(+1.43)#7,312 |
| 3. | 60504 | 5.7% | 5.0%(+0.715)#433 | 5.3%(+0.464)#10,179 |
| 4. | 60502 | 3.4% | 5.0%(-1.60)#841 | 5.3%(-1.85)#19,468 |
| 5. | 60503 | 2.0% | 5.0%(-3.06)#1,102 | 5.3%(-3.31)#24,792 |
1
Common Questions
What are the Top 3 Zip Codes with the Highest Percentage of Population Employed in Food Preparation & Serving in Aurora, IL?
Top 3 Zip Codes with the Highest Percentage of Population Employed in Food Preparation & Serving in Aurora, IL are:
What zip code has the Highest Percentage of Population Employed in Food Preparation & Serving in Aurora, IL?
60505 has the Highest Percentage of Population Employed in Food Preparation & Serving in Aurora, IL with 8.8%.
What is the Percentage of Population Employed in Food Preparation & Serving in Aurora, IL?
Percentage of Population Employed in Food Preparation & Serving in Aurora is 6.3%.
What is the Percentage of Population Employed in Food Preparation & Serving in Illinois?
Percentage of Population Employed in Food Preparation & Serving in Illinois is 5.0%.
What is the Percentage of Population Employed in Food Preparation & Serving in the United States?
Percentage of Population Employed in Food Preparation & Serving in the United States is 5.3%.