Cities with the Most Immigrants from Argentina in Illinois
RELATED REPORTS & OPTIONS
Argentina
Illinois
Compare Cities
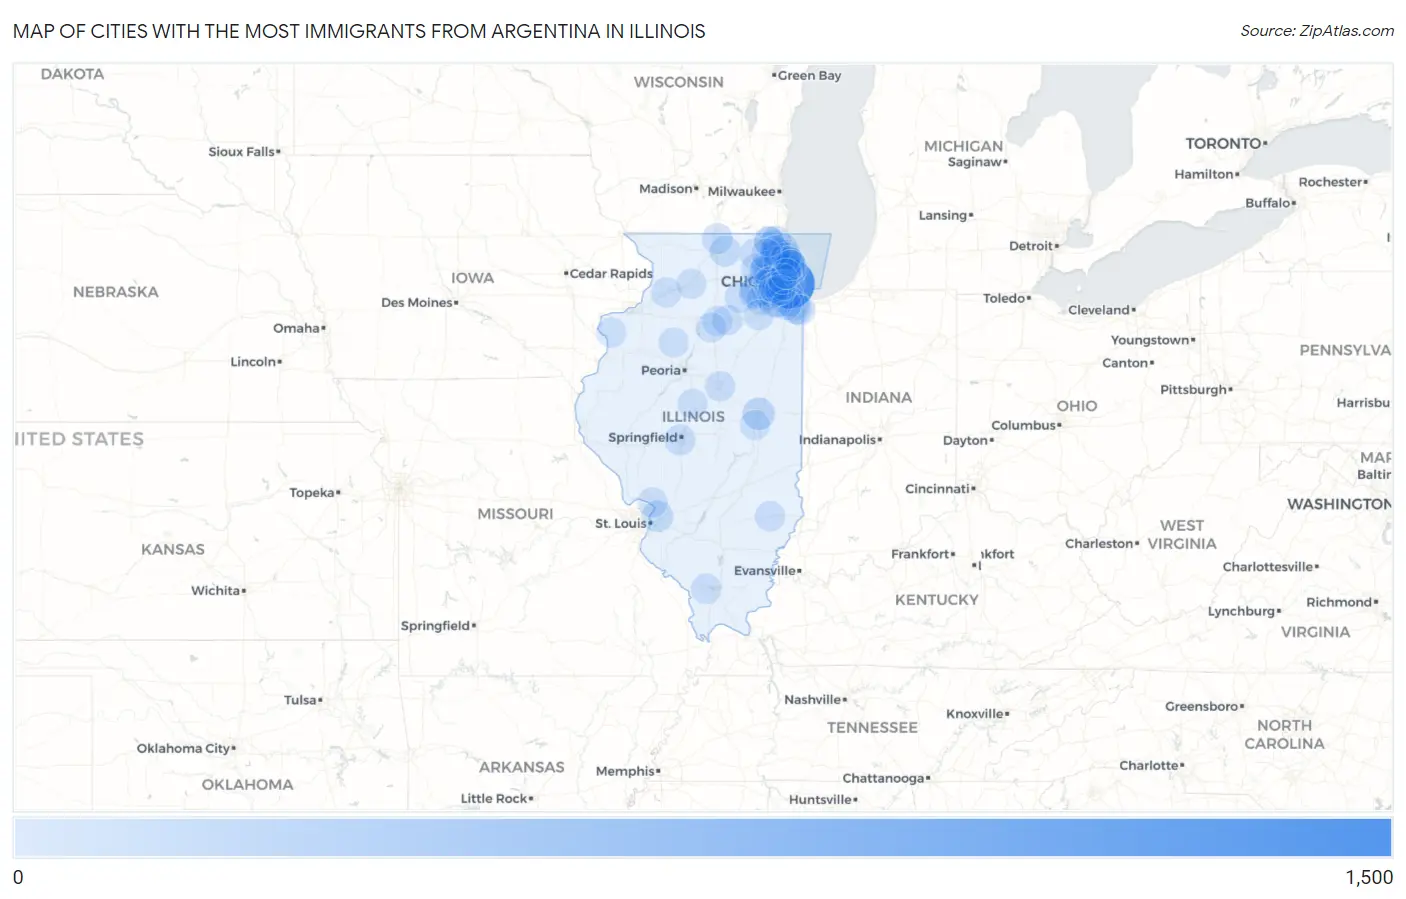
Map of Cities with the Most Immigrants from Argentina in Illinois
0
1,500
Cities with the Most Immigrants from Argentina in Illinois
| City | Argentina | vs State | vs National | |
| 1. | Chicago | 1,316 | 3,955(33.27%)#1 | 200,110(0.66%)#9 |
| 2. | Aurora | 170 | 3,955(4.30%)#2 | 200,110(0.08%)#187 |
| 3. | Elmwood Park | 154 | 3,955(3.89%)#3 | 200,110(0.08%)#205 |
| 4. | Champaign | 139 | 3,955(3.51%)#4 | 200,110(0.07%)#235 |
| 5. | Montgomery | 134 | 3,955(3.39%)#5 | 200,110(0.07%)#247 |
| 6. | Arlington Heights | 103 | 3,955(2.60%)#6 | 200,110(0.05%)#326 |
| 7. | Oak Brook | 101 | 3,955(2.55%)#7 | 200,110(0.05%)#336 |
| 8. | Pontoon Beach | 88 | 3,955(2.23%)#8 | 200,110(0.04%)#398 |
| 9. | Homewood | 76 | 3,955(1.92%)#9 | 200,110(0.04%)#454 |
| 10. | Cicero | 74 | 3,955(1.87%)#10 | 200,110(0.04%)#465 |
| 11. | Belvidere | 60 | 3,955(1.52%)#11 | 200,110(0.03%)#567 |
| 12. | Chicago Heights | 59 | 3,955(1.49%)#12 | 200,110(0.03%)#576 |
| 13. | Bensenville | 48 | 3,955(1.21%)#13 | 200,110(0.02%)#696 |
| 14. | Round Lake Beach | 38 | 3,955(0.96%)#14 | 200,110(0.02%)#818 |
| 15. | Westchester | 38 | 3,955(0.96%)#15 | 200,110(0.02%)#822 |
| 16. | Des Plaines | 37 | 3,955(0.94%)#16 | 200,110(0.02%)#836 |
| 17. | Norridge | 37 | 3,955(0.94%)#17 | 200,110(0.02%)#840 |
| 18. | Roscoe | 37 | 3,955(0.94%)#18 | 200,110(0.02%)#841 |
| 19. | Springfield | 35 | 3,955(0.88%)#19 | 200,110(0.02%)#858 |
| 20. | Bloomingdale | 35 | 3,955(0.88%)#20 | 200,110(0.02%)#866 |
| 21. | Grandwood Park | 35 | 3,955(0.88%)#21 | 200,110(0.02%)#876 |
| 22. | Naperville | 34 | 3,955(0.86%)#22 | 200,110(0.02%)#883 |
| 23. | Vernon Hills | 34 | 3,955(0.86%)#23 | 200,110(0.02%)#892 |
| 24. | Glendale Heights | 33 | 3,955(0.83%)#24 | 200,110(0.02%)#901 |
| 25. | Schaumburg | 32 | 3,955(0.81%)#25 | 200,110(0.02%)#916 |
| 26. | Crystal Lake | 31 | 3,955(0.78%)#26 | 200,110(0.02%)#946 |
| 27. | Lombard | 30 | 3,955(0.76%)#27 | 200,110(0.01%)#970 |
| 28. | Long Grove | 30 | 3,955(0.76%)#28 | 200,110(0.01%)#977 |
| 29. | Bartlett | 28 | 3,955(0.71%)#29 | 200,110(0.01%)#1,013 |
| 30. | Grayslake | 28 | 3,955(0.71%)#30 | 200,110(0.01%)#1,017 |
| 31. | Lincolnwood | 27 | 3,955(0.68%)#31 | 200,110(0.01%)#1,032 |
| 32. | Oak Park | 26 | 3,955(0.66%)#32 | 200,110(0.01%)#1,045 |
| 33. | Glenview | 26 | 3,955(0.66%)#33 | 200,110(0.01%)#1,046 |
| 34. | Schiller Park | 26 | 3,955(0.66%)#34 | 200,110(0.01%)#1,059 |
| 35. | Oak Forest | 25 | 3,955(0.63%)#35 | 200,110(0.01%)#1,080 |
| 36. | Park Ridge | 24 | 3,955(0.61%)#36 | 200,110(0.01%)#1,110 |
| 37. | Morton Grove | 24 | 3,955(0.61%)#37 | 200,110(0.01%)#1,118 |
| 38. | Niles | 22 | 3,955(0.56%)#38 | 200,110(0.01%)#1,177 |
| 39. | Elgin | 21 | 3,955(0.53%)#39 | 200,110(0.01%)#1,199 |
| 40. | Evanston | 21 | 3,955(0.53%)#40 | 200,110(0.01%)#1,201 |
| 41. | Hoffman Estates | 21 | 3,955(0.53%)#41 | 200,110(0.01%)#1,205 |
| 42. | Ottawa | 21 | 3,955(0.53%)#42 | 200,110(0.01%)#1,224 |
| 43. | Carbondale | 18 | 3,955(0.46%)#43 | 200,110(0.01%)#1,312 |
| 44. | Olney | 17 | 3,955(0.43%)#44 | 200,110(0.01%)#1,364 |
| 45. | Northbrook | 16 | 3,955(0.40%)#45 | 200,110(0.01%)#1,383 |
| 46. | Mount Prospect | 15 | 3,955(0.38%)#46 | 200,110(0.01%)#1,422 |
| 47. | Sauk Village | 15 | 3,955(0.38%)#47 | 200,110(0.01%)#1,443 |
| 48. | Bolingbrook | 14 | 3,955(0.35%)#48 | 200,110(0.01%)#1,469 |
| 49. | Streamwood | 14 | 3,955(0.35%)#49 | 200,110(0.01%)#1,472 |
| 50. | Lake Bluff | 14 | 3,955(0.35%)#50 | 200,110(0.01%)#1,497 |
| 51. | Bloomington | 13 | 3,955(0.33%)#51 | 200,110(0.01%)#1,517 |
| 52. | Chicago Ridge | 13 | 3,955(0.33%)#52 | 200,110(0.01%)#1,535 |
| 53. | Sandwich | 13 | 3,955(0.33%)#53 | 200,110(0.01%)#1,542 |
| 54. | Highwood | 13 | 3,955(0.33%)#54 | 200,110(0.01%)#1,546 |
| 55. | Wheeling | 12 | 3,955(0.30%)#55 | 200,110(0.01%)#1,561 |
| 56. | Alton | 12 | 3,955(0.30%)#56 | 200,110(0.01%)#1,570 |
| 57. | Plainfield | 11 | 3,955(0.28%)#57 | 200,110(0.01%)#1,619 |
| 58. | Glen Ellyn | 11 | 3,955(0.28%)#58 | 200,110(0.01%)#1,624 |
| 59. | Lockport | 11 | 3,955(0.28%)#59 | 200,110(0.01%)#1,626 |
| 60. | Libertyville | 11 | 3,955(0.28%)#60 | 200,110(0.01%)#1,630 |
| 61. | Clarendon Hills | 11 | 3,955(0.28%)#61 | 200,110(0.01%)#1,649 |
| 62. | Winnetka | 10 | 3,955(0.25%)#62 | 200,110(0.00%)#1,704 |
| 63. | Wilmette | 9 | 3,955(0.23%)#63 | 200,110(0.00%)#1,745 |
| 64. | Homer Glen | 9 | 3,955(0.23%)#64 | 200,110(0.00%)#1,749 |
| 65. | Wheaton | 8 | 3,955(0.20%)#65 | 200,110(0.00%)#1,793 |
| 66. | Darien | 8 | 3,955(0.20%)#66 | 200,110(0.00%)#1,808 |
| 67. | Western Springs | 8 | 3,955(0.20%)#67 | 200,110(0.00%)#1,815 |
| 68. | Lyndon | 8 | 3,955(0.20%)#68 | 200,110(0.00%)#1,845 |
| 69. | Downers Grove | 7 | 3,955(0.18%)#69 | 200,110(0.00%)#1,857 |
| 70. | Woodridge | 7 | 3,955(0.18%)#70 | 200,110(0.00%)#1,860 |
| 71. | Mundelein | 7 | 3,955(0.18%)#71 | 200,110(0.00%)#1,862 |
| 72. | Highland Park | 7 | 3,955(0.18%)#72 | 200,110(0.00%)#1,864 |
| 73. | Dixon | 7 | 3,955(0.18%)#73 | 200,110(0.00%)#1,874 |
| 74. | Channahon | 7 | 3,955(0.18%)#74 | 200,110(0.00%)#1,875 |
| 75. | Brookfield | 6 | 3,955(0.15%)#75 | 200,110(0.00%)#1,928 |
| 76. | Burr Ridge | 6 | 3,955(0.15%)#76 | 200,110(0.00%)#1,937 |
| 77. | North Utica | 6 | 3,955(0.15%)#77 | 200,110(0.00%)#1,960 |
| 78. | Tinley Park | 4 | 3,955(0.10%)#78 | 200,110(0.00%)#2,019 |
| 79. | Glencoe | 4 | 3,955(0.10%)#79 | 200,110(0.00%)#2,034 |
| 80. | Round Lake Heights | 4 | 3,955(0.10%)#80 | 200,110(0.00%)#2,049 |
| 81. | Kenilworth | 4 | 3,955(0.10%)#81 | 200,110(0.00%)#2,050 |
| 82. | Wyoming | 4 | 3,955(0.10%)#82 | 200,110(0.00%)#2,058 |
| 83. | Tower Lakes | 4 | 3,955(0.10%)#83 | 200,110(0.00%)#2,063 |
| 84. | Melrose Park | 3 | 3,955(0.08%)#84 | 200,110(0.00%)#2,073 |
| 85. | Harwood Heights | 2 | 3,955(0.05%)#85 | 200,110(0.00%)#2,115 |
| 86. | Joy | 2 | 3,955(0.05%)#86 | 200,110(0.00%)#2,142 |
| 87. | Sadorus | 2 | 3,955(0.05%)#87 | 200,110(0.00%)#2,145 |
| 88. | Hartsburg | 1 | 3,955(0.03%)#88 | 200,110(0.00%)#2,179 |
| 89. | Cedar Point | 1 | 3,955(0.03%)#89 | 200,110(0.00%)#2,181 |
Common Questions
What are the Top 10 Cities with the Most Immigrants from Argentina in Illinois?
Top 10 Cities with the Most Immigrants from Argentina in Illinois are:
#1
1,316
#2
170
#3
154
#4
139
#5
134
#6
103
#7
101
#8
88
#9
76
#10
74
What city has the Most Immigrants from Argentina in Illinois?
Chicago has the Most Immigrants from Argentina in Illinois with 1,316.
What is the Total Immigrants from Argentina in the State of Illinois?
Total Immigrants from Argentina in Illinois is 3,955.
What is the Total Immigrants from Argentina in the United States?
Total Immigrants from Argentina in the United States is 200,110.