Cities with the Highest Percentage of Population Enrolled in Nursery / Preschool in Illinois
RELATED REPORTS & OPTIONS
Nursery / Preschool
Illinois
Compare Cities
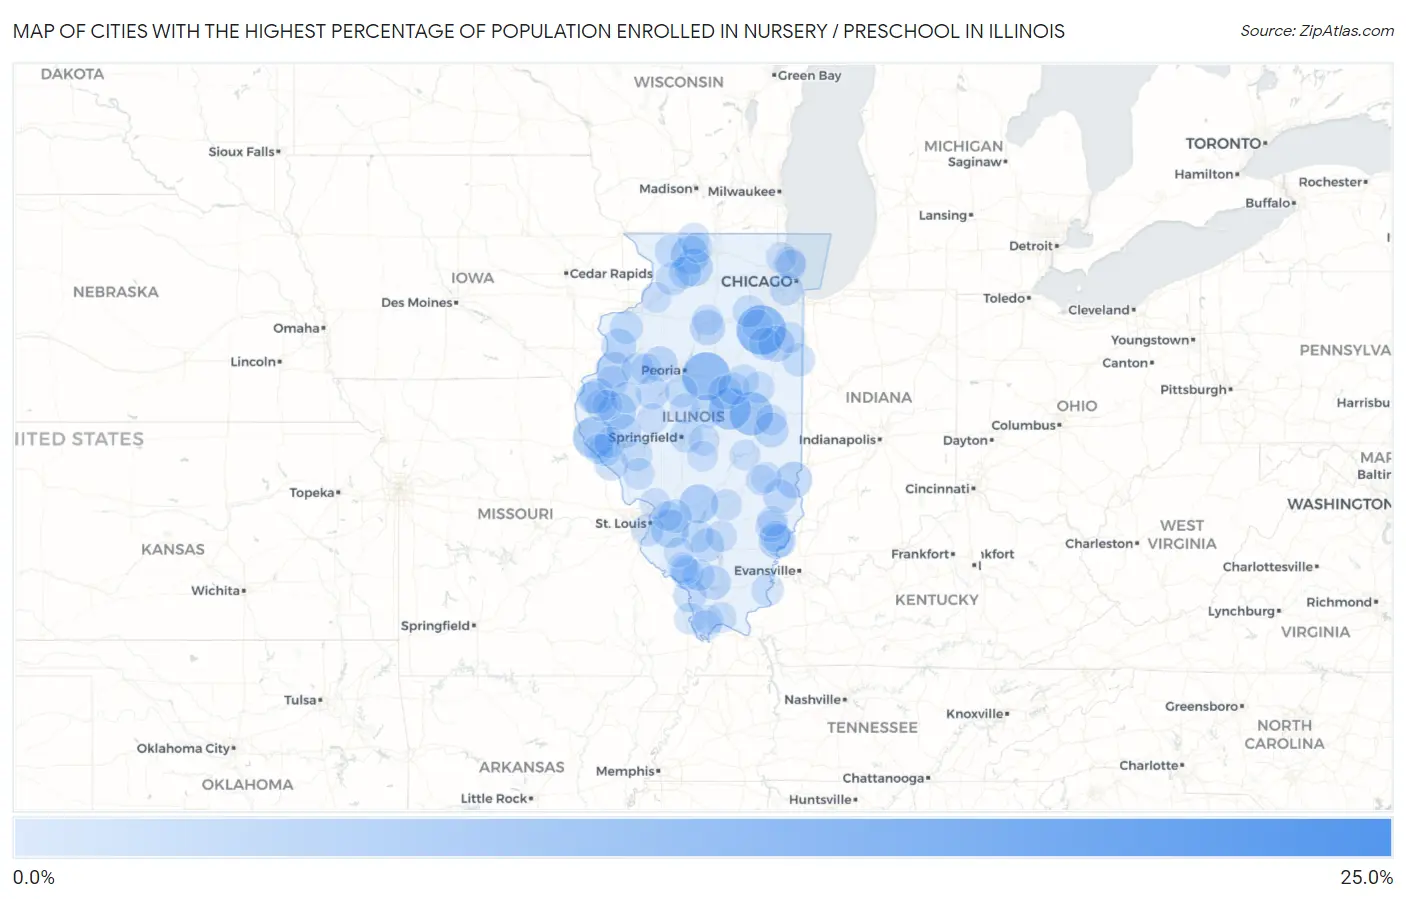
Map of Cities with the Highest Percentage of Population Enrolled in Nursery / Preschool in Illinois
0.0%
25.0%
Cities with the Highest Percentage of Population Enrolled in Nursery / Preschool in Illinois
| City | % in Nursery | vs State | vs National | |
| 1. | Bloomfield | 24.5% | 1.6%(+22.9)#1 | 1.4%(+23.0)#18 |
| 2. | West Liberty | 20.7% | 1.6%(+19.1)#2 | 1.4%(+19.2)#32 |
| 3. | Braceville | 13.3% | 1.6%(+11.7)#3 | 1.4%(+11.8)#103 |
| 4. | Congerville | 12.6% | 1.6%(+11.0)#4 | 1.4%(+11.2)#114 |
| 5. | Alden | 11.3% | 1.6%(+9.68)#5 | 1.4%(+9.86)#159 |
| 6. | Seymour | 10.3% | 1.6%(+8.71)#6 | 1.4%(+8.88)#194 |
| 7. | De Witt | 9.6% | 1.6%(+8.00)#7 | 1.4%(+8.18)#236 |
| 8. | Plainville | 9.4% | 1.6%(+7.77)#8 | 1.4%(+7.95)#251 |
| 9. | Ophiem | 8.6% | 1.6%(+6.99)#9 | 1.4%(+7.17)#308 |
| 10. | Smithboro | 8.1% | 1.6%(+6.52)#10 | 1.4%(+6.70)#351 |
| 11. | German Valley | 7.8% | 1.6%(+6.13)#11 | 1.4%(+6.31)#385 |
| 12. | Scott Afb | 7.7% | 1.6%(+6.08)#12 | 1.4%(+6.26)#389 |
| 13. | Mount Morris | 7.6% | 1.6%(+6.01)#13 | 1.4%(+6.19)#395 |
| 14. | Camden | 7.4% | 1.6%(+5.78)#14 | 1.4%(+5.96)#431 |
| 15. | West Union | 7.1% | 1.6%(+5.48)#15 | 1.4%(+5.66)#478 |
| 16. | Raritan | 6.8% | 1.6%(+5.19)#16 | 1.4%(+5.37)#515 |
| 17. | Irwin | 6.8% | 1.6%(+5.19)#17 | 1.4%(+5.37)#516 |
| 18. | Trivoli | 6.7% | 1.6%(+5.06)#18 | 1.4%(+5.23)#534 |
| 19. | Bentley | 6.7% | 1.6%(+5.04)#19 | 1.4%(+5.22)#542 |
| 20. | Burtons Bridge | 6.6% | 1.6%(+4.94)#20 | 1.4%(+5.12)#559 |
| 21. | Standard | 6.4% | 1.6%(+4.81)#21 | 1.4%(+4.99)#577 |
| 22. | Browns | 6.4% | 1.6%(+4.74)#22 | 1.4%(+4.92)#593 |
| 23. | Yates City | 6.3% | 1.6%(+4.70)#23 | 1.4%(+4.88)#603 |
| 24. | Little York | 6.3% | 1.6%(+4.64)#24 | 1.4%(+4.82)#619 |
| 25. | Longview | 6.2% | 1.6%(+4.55)#25 | 1.4%(+4.72)#646 |
| 26. | Colp | 6.0% | 1.6%(+4.36)#26 | 1.4%(+4.54)#682 |
| 27. | Versailles | 6.0% | 1.6%(+4.34)#27 | 1.4%(+4.51)#691 |
| 28. | Downs | 5.9% | 1.6%(+4.24)#28 | 1.4%(+4.41)#722 |
| 29. | Oblong | 5.8% | 1.6%(+4.14)#29 | 1.4%(+4.32)#746 |
| 30. | Beason | 5.7% | 1.6%(+4.11)#30 | 1.4%(+4.28)#762 |
| 31. | St Jacob | 5.7% | 1.6%(+4.07)#31 | 1.4%(+4.25)#776 |
| 32. | Grand Tower | 5.6% | 1.6%(+4.02)#32 | 1.4%(+4.20)#791 |
| 33. | Pleasant Hill | 5.6% | 1.6%(+3.96)#33 | 1.4%(+4.14)#809 |
| 34. | Lewistown | 5.6% | 1.6%(+3.95)#34 | 1.4%(+4.13)#817 |
| 35. | Ashley | 5.6% | 1.6%(+3.94)#35 | 1.4%(+4.12)#820 |
| 36. | Coleta | 5.5% | 1.6%(+3.90)#36 | 1.4%(+4.08)#835 |
| 37. | Pearl City | 5.5% | 1.6%(+3.90)#37 | 1.4%(+4.07)#837 |
| 38. | Bedford Park | 5.5% | 1.6%(+3.86)#38 | 1.4%(+4.04)#844 |
| 39. | Clear Lake | 5.5% | 1.6%(+3.86)#39 | 1.4%(+4.04)#846 |
| 40. | Matherville | 5.5% | 1.6%(+3.83)#40 | 1.4%(+4.01)#852 |
| 41. | Iroquois | 5.4% | 1.6%(+3.79)#41 | 1.4%(+3.97)#868 |
| 42. | East Carondelet | 5.3% | 1.6%(+3.64)#42 | 1.4%(+3.82)#925 |
| 43. | El Dara | 5.2% | 1.6%(+3.59)#43 | 1.4%(+3.77)#950 |
| 44. | Green Valley | 5.2% | 1.6%(+3.58)#44 | 1.4%(+3.76)#952 |
| 45. | Buckingham | 5.1% | 1.6%(+3.50)#45 | 1.4%(+3.68)#985 |
| 46. | Lisbon | 5.1% | 1.6%(+3.49)#46 | 1.4%(+3.67)#989 |
| 47. | New Minden | 5.1% | 1.6%(+3.49)#47 | 1.4%(+3.67)#991 |
| 48. | Old Shawneetown | 5.1% | 1.6%(+3.45)#48 | 1.4%(+3.62)#1,008 |
| 49. | Alsey | 5.0% | 1.6%(+3.41)#49 | 1.4%(+3.58)#1,033 |
| 50. | Ellsworth | 5.0% | 1.6%(+3.40)#50 | 1.4%(+3.58)#1,037 |
| 51. | St Augustine | 5.0% | 1.6%(+3.37)#51 | 1.4%(+3.55)#1,045 |
| 52. | Campbell Hill | 5.0% | 1.6%(+3.34)#52 | 1.4%(+3.52)#1,065 |
| 53. | Polo | 4.9% | 1.6%(+3.32)#53 | 1.4%(+3.50)#1,068 |
| 54. | Bowen | 4.9% | 1.6%(+3.28)#54 | 1.4%(+3.46)#1,080 |
| 55. | Bellmont | 4.9% | 1.6%(+3.28)#55 | 1.4%(+3.46)#1,081 |
| 56. | Vergennes | 4.9% | 1.6%(+3.27)#56 | 1.4%(+3.45)#1,086 |
| 57. | Basco | 4.9% | 1.6%(+3.25)#57 | 1.4%(+3.43)#1,095 |
| 58. | Parkersburg | 4.9% | 1.6%(+3.24)#58 | 1.4%(+3.42)#1,103 |
| 59. | Elliott | 4.8% | 1.6%(+3.22)#59 | 1.4%(+3.40)#1,118 |
| 60. | East Cape Girardeau | 4.8% | 1.6%(+3.19)#60 | 1.4%(+3.37)#1,131 |
| 61. | Davis | 4.7% | 1.6%(+3.09)#61 | 1.4%(+3.27)#1,184 |
| 62. | Carrollton | 4.7% | 1.6%(+3.08)#62 | 1.4%(+3.26)#1,192 |
| 63. | Winnetka | 4.7% | 1.6%(+3.08)#63 | 1.4%(+3.25)#1,196 |
| 64. | Lowpoint | 4.7% | 1.6%(+3.07)#64 | 1.4%(+3.25)#1,202 |
| 65. | St Peter | 4.7% | 1.6%(+3.03)#65 | 1.4%(+3.21)#1,216 |
| 66. | Dix | 4.6% | 1.6%(+3.01)#66 | 1.4%(+3.19)#1,229 |
| 67. | Blandinsville | 4.6% | 1.6%(+2.98)#67 | 1.4%(+3.16)#1,252 |
| 68. | Industry | 4.6% | 1.6%(+2.98)#68 | 1.4%(+3.16)#1,256 |
| 69. | Anchor | 4.6% | 1.6%(+2.96)#69 | 1.4%(+3.14)#1,265 |
| 70. | Baylis | 4.6% | 1.6%(+2.95)#70 | 1.4%(+3.13)#1,271 |
| 71. | Sun River Terrace | 4.5% | 1.6%(+2.92)#71 | 1.4%(+3.10)#1,289 |
| 72. | Carbon Hill | 4.5% | 1.6%(+2.90)#72 | 1.4%(+3.07)#1,300 |
| 73. | Mount Auburn | 4.5% | 1.6%(+2.88)#73 | 1.4%(+3.06)#1,316 |
| 74. | East Alton | 4.5% | 1.6%(+2.86)#74 | 1.4%(+3.04)#1,332 |
| 75. | Bone Gap | 4.4% | 1.6%(+2.82)#75 | 1.4%(+3.00)#1,363 |
| 76. | Chandlerville | 4.4% | 1.6%(+2.80)#76 | 1.4%(+2.97)#1,372 |
| 77. | Sidney | 4.4% | 1.6%(+2.79)#77 | 1.4%(+2.97)#1,373 |
| 78. | Greenup | 4.4% | 1.6%(+2.77)#78 | 1.4%(+2.95)#1,390 |
| 79. | New Holland | 4.3% | 1.6%(+2.72)#79 | 1.4%(+2.90)#1,418 |
| 80. | Belknap | 4.3% | 1.6%(+2.72)#80 | 1.4%(+2.90)#1,419 |
| 81. | Taylorville | 4.3% | 1.6%(+2.71)#81 | 1.4%(+2.89)#1,425 |
| 82. | Dalzell | 4.3% | 1.6%(+2.69)#82 | 1.4%(+2.87)#1,431 |
| 83. | Kenilworth | 4.3% | 1.6%(+2.68)#83 | 1.4%(+2.85)#1,453 |
| 84. | Allenville | 4.3% | 1.6%(+2.67)#84 | 1.4%(+2.85)#1,455 |
| 85. | Calhoun | 4.3% | 1.6%(+2.67)#85 | 1.4%(+2.85)#1,462 |
| 86. | Erie | 4.3% | 1.6%(+2.66)#86 | 1.4%(+2.84)#1,467 |
| 87. | London Mills | 4.3% | 1.6%(+2.66)#87 | 1.4%(+2.84)#1,468 |
| 88. | Percy | 4.3% | 1.6%(+2.62)#88 | 1.4%(+2.80)#1,498 |
| 89. | Riverwoods | 4.3% | 1.6%(+2.62)#89 | 1.4%(+2.80)#1,499 |
| 90. | Jewett | 4.2% | 1.6%(+2.59)#90 | 1.4%(+2.77)#1,522 |
| 91. | Augusta | 4.2% | 1.6%(+2.56)#91 | 1.4%(+2.74)#1,545 |
| 92. | New Canton | 4.2% | 1.6%(+2.54)#92 | 1.4%(+2.72)#1,561 |
| 93. | Pecatonica | 4.2% | 1.6%(+2.53)#93 | 1.4%(+2.71)#1,575 |
| 94. | Pulaski | 4.1% | 1.6%(+2.49)#94 | 1.4%(+2.67)#1,602 |
| 95. | Ullin | 4.1% | 1.6%(+2.48)#95 | 1.4%(+2.66)#1,606 |
| 96. | Sunnyland | 4.1% | 1.6%(+2.48)#96 | 1.4%(+2.65)#1,610 |
| 97. | Willisville | 4.1% | 1.6%(+2.46)#97 | 1.4%(+2.64)#1,621 |
| 98. | Tilden | 4.1% | 1.6%(+2.45)#98 | 1.4%(+2.63)#1,630 |
| 99. | Ritchie | 4.0% | 1.6%(+2.40)#99 | 1.4%(+2.58)#1,679 |
| 100. | Troy | 4.0% | 1.6%(+2.39)#100 | 1.4%(+2.57)#1,693 |
Common Questions
What are the Top 10 Cities with the Highest Percentage of Population Enrolled in Nursery / Preschool in Illinois?
Top 10 Cities with the Highest Percentage of Population Enrolled in Nursery / Preschool in Illinois are:
#1
13.3%
#2
12.6%
#3
10.3%
#4
9.6%
#5
9.4%
#6
8.1%
#7
7.8%
#8
7.7%
#9
7.6%
#10
7.4%
What city has the Highest Percentage of Population Enrolled in Nursery / Preschool in Illinois?
Braceville has the Highest Percentage of Population Enrolled in Nursery / Preschool in Illinois with 13.3%.
What is the Percentage of Population Enrolled in Nursery / Preschool in the State of Illinois?
Percentage of Population Enrolled in Nursery / Preschool in Illinois is 1.6%.
What is the Percentage of Population Enrolled in Nursery / Preschool in the United States?
Percentage of Population Enrolled in Nursery / Preschool in the United States is 1.4%.