Cities with the Lowest Population Density in Illinois
RELATED REPORTS & OPTIONS
Lowest Population Density
Illinois
Compare Cities
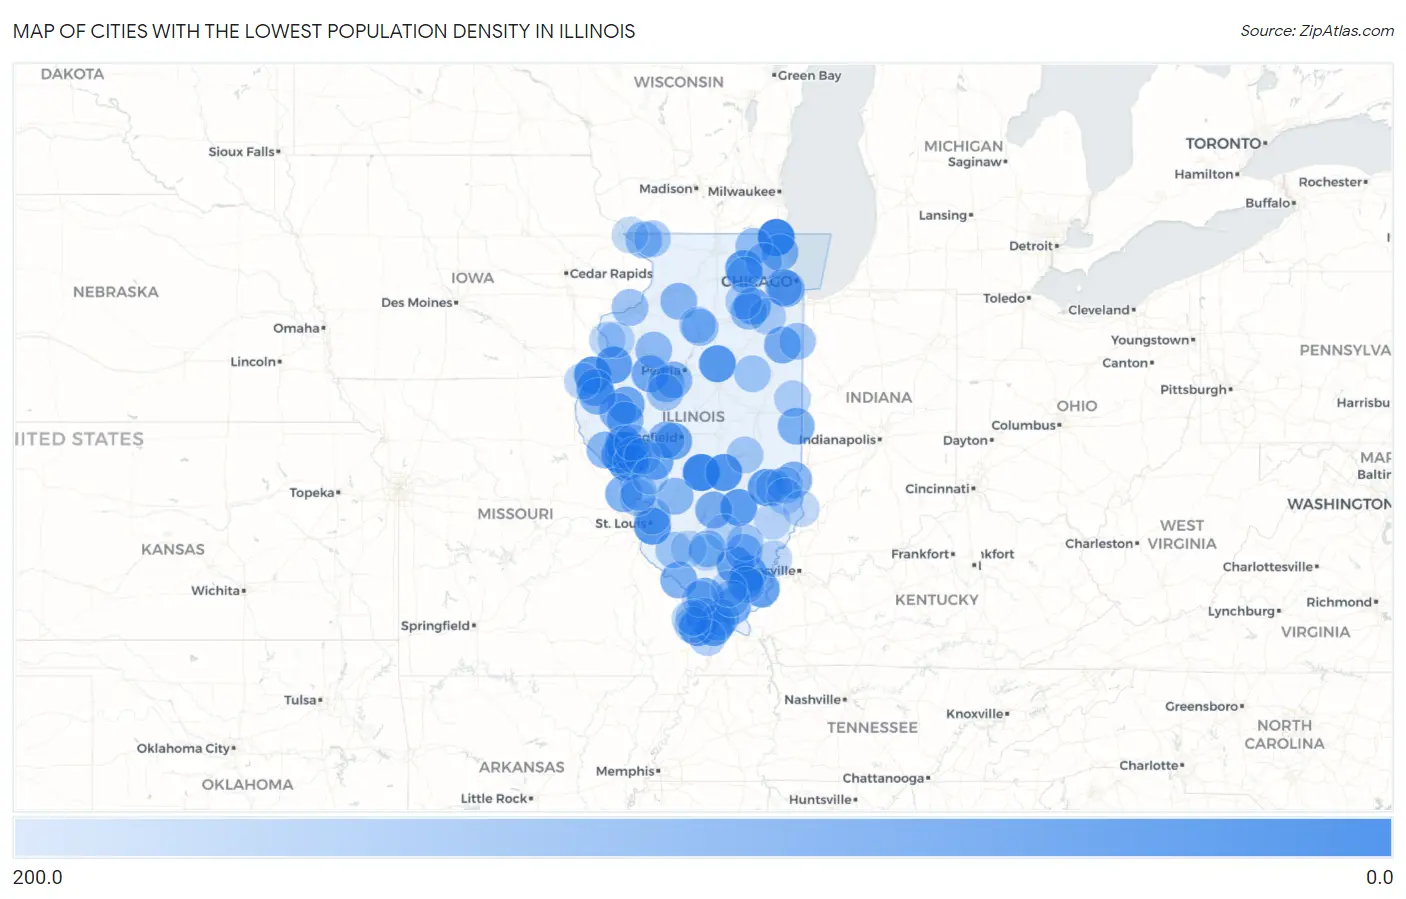
Map of Cities with the Lowest Population Density in Illinois
200.0
0.0
Cities with the Lowest Population Density in Illinois
| City | People / Sq Mi | vs State | vs National | |
| 1. | Old Mill Creek | 11.3 | 229.8(-219)#1 | 0.0(+11.3)#400 |
| 2. | Wenonah | 17.8 | 229.8(-212)#2 | 0.0(+17.8)#606 |
| 3. | Florence | 33.5 | 229.8(-196)#3 | 0.0(+33.5)#1,117 |
| 4. | Lakewood | 48.1 | 229.8(-182)#4 | 0.0(+48.1)#1,543 |
| 5. | Pontoosuc | 50.2 | 229.8(-180)#5 | 0.0(+50.2)#1,599 |
| 6. | Sauget | 54.7 | 229.8(-175)#6 | 0.0(+54.7)#1,721 |
| 7. | Panola | 56.6 | 229.8(-173)#7 | 0.0(+56.6)#1,769 |
| 8. | Pearl | 58.6 | 229.8(-171)#8 | 0.0(+58.6)#1,819 |
| 9. | Iola | 60.2 | 229.8(-170)#9 | 0.0(+60.2)#1,865 |
| 10. | Olive Branch | 61.2 | 229.8(-169)#10 | 0.0(+61.2)#1,885 |
| 11. | Burlington | 62.8 | 229.8(-167)#11 | 0.0(+62.8)#1,937 |
| 12. | Rose Hill | 63.1 | 229.8(-167)#12 | 0.0(+63.1)#1,950 |
| 13. | Media | 66.7 | 229.8(-163)#13 | 0.0(+66.7)#2,042 |
| 14. | Time | 67.1 | 229.8(-163)#14 | 0.0(+67.1)#2,062 |
| 15. | Olmsted | 71.0 | 229.8(-159)#15 | 0.0(+71.0)#2,169 |
| 16. | Junction | 71.5 | 229.8(-158)#16 | 0.0(+71.5)#2,180 |
| 17. | Macedonia | 75.9 | 229.8(-154)#17 | 0.0(+75.9)#2,316 |
| 18. | Ferris | 80.9 | 229.8(-149)#18 | 0.0(+80.9)#2,468 |
| 19. | Scottville | 81.4 | 229.8(-148)#19 | 0.0(+81.4)#2,476 |
| 20. | Broughton | 82.5 | 229.8(-147)#20 | 0.0(+82.5)#2,501 |
| 21. | Littleton | 86.6 | 229.8(-143)#21 | 0.0(+86.6)#2,620 |
| 22. | Curran | 86.7 | 229.8(-143)#22 | 0.0(+86.7)#2,624 |
| 23. | Plattville | 87.0 | 229.8(-143)#23 | 0.0(+87.0)#2,631 |
| 24. | Fairview | 88.8 | 229.8(-141)#24 | 0.0(+88.8)#2,682 |
| 25. | Makanda | 94.0 | 229.8(-136)#25 | 0.0(+94.0)#2,810 |
| 26. | Simpson | 98.9 | 229.8(-131)#26 | 0.0(+98.9)#2,922 |
| 27. | Sammons Point | 99.8 | 229.8(-130)#27 | 0.0(+99.8)#2,948 |
| 28. | Vernon | 100.9 | 229.8(-129)#28 | 0.0(+101)#2,976 |
| 29. | Bedford Park | 102.7 | 229.8(-127)#29 | 0.0(+103)#3,023 |
| 30. | Rockwood | 103.7 | 229.8(-126)#30 | 0.0(+104)#3,056 |
| 31. | Batchtown | 104.7 | 229.8(-125)#31 | 0.0(+105)#3,079 |
| 32. | Olivet | 106.4 | 229.8(-123)#32 | 0.0(+106)#3,125 |
| 33. | Detroit | 108.2 | 229.8(-122)#33 | 0.0(+108)#3,174 |
| 34. | Mettawa | 108.6 | 229.8(-121)#34 | 0.0(+109)#3,185 |
| 35. | Camden | 109.1 | 229.8(-121)#35 | 0.0(+109)#3,199 |
| 36. | West Union | 109.9 | 229.8(-120)#36 | 0.0(+110)#3,221 |
| 37. | Bentley | 110.8 | 229.8(-119)#37 | 0.0(+111)#3,242 |
| 38. | Ripley | 113.6 | 229.8(-116)#38 | 0.0(+114)#3,311 |
| 39. | Mccook | 113.6 | 229.8(-116)#39 | 0.0(+114)#3,313 |
| 40. | Mill Creek | 117.8 | 229.8(-112)#40 | 0.0(+118)#3,403 |
| 41. | Valley City | 118.2 | 229.8(-112)#41 | 0.0(+118)#3,419 |
| 42. | Banner | 118.2 | 229.8(-112)#42 | 0.0(+118)#3,420 |
| 43. | Deer Grove | 120.9 | 229.8(-109)#43 | 0.0(+121)#3,473 |
| 44. | Berlin | 121.4 | 229.8(-108)#44 | 0.0(+121)#3,483 |
| 45. | Raleigh | 122.4 | 229.8(-107)#45 | 0.0(+122)#3,512 |
| 46. | Kingston Mines | 122.6 | 229.8(-107)#46 | 0.0(+123)#3,515 |
| 47. | Radom | 124.2 | 229.8(-106)#47 | 0.0(+124)#3,541 |
| 48. | El Dara | 125.8 | 229.8(-104)#48 | 0.0(+126)#3,583 |
| 49. | Williamson | 126.6 | 229.8(-103)#49 | 0.0(+127)#3,596 |
| 50. | Belle Prairie City | 128.4 | 229.8(-101)#50 | 0.0(+128)#3,653 |
| 51. | Lisbon | 128.5 | 229.8(-101)#51 | 0.0(+129)#3,658 |
| 52. | Belknap | 130.3 | 229.8(-99.5)#52 | 0.0(+130)#3,696 |
| 53. | Oak Run | 130.5 | 229.8(-99.3)#53 | 0.0(+130)#3,706 |
| 54. | New Grand Chain | 132.5 | 229.8(-97.3)#54 | 0.0(+133)#3,749 |
| 55. | Hennepin | 135.3 | 229.8(-94.5)#55 | 0.0(+135)#3,808 |
| 56. | Bull Valley | 136.4 | 229.8(-93.4)#56 | 0.0(+136)#3,839 |
| 57. | Glasgow | 137.6 | 229.8(-92.2)#57 | 0.0(+138)#3,865 |
| 58. | Rock Island Arsenal | 138.4 | 229.8(-91.3)#58 | 0.0(+138)#3,879 |
| 59. | Barrington Hills | 141.0 | 229.8(-88.7)#59 | 0.0(+141)#3,937 |
| 60. | Virgil | 141.4 | 229.8(-88.4)#60 | 0.0(+141)#3,947 |
| 61. | The Galena Territory | 141.7 | 229.8(-88.1)#61 | 0.0(+142)#3,954 |
| 62. | Yale | 146.3 | 229.8(-83.5)#62 | 0.0(+146)#4,058 |
| 63. | Hopkins Park | 146.7 | 229.8(-83.1)#63 | 0.0(+147)#4,067 |
| 64. | Muddy | 147.4 | 229.8(-82.4)#64 | 0.0(+147)#4,088 |
| 65. | Madison | 149.5 | 229.8(-80.3)#65 | 0.0(+149)#4,137 |
| 66. | Marissa | 151.3 | 229.8(-78.5)#66 | 0.0(+151)#4,184 |
| 67. | Strawn | 151.3 | 229.8(-78.4)#67 | 0.0(+151)#4,185 |
| 68. | Hillview | 153.6 | 229.8(-76.2)#68 | 0.0(+154)#4,226 |
| 69. | New Burnside | 154.0 | 229.8(-75.8)#69 | 0.0(+154)#4,236 |
| 70. | Grafton | 154.0 | 229.8(-75.8)#70 | 0.0(+154)#4,237 |
| 71. | Goofy Ridge | 154.6 | 229.8(-75.2)#71 | 0.0(+155)#4,250 |
| 72. | Sims | 154.9 | 229.8(-74.9)#72 | 0.0(+155)#4,256 |
| 73. | Otterville | 156.1 | 229.8(-73.7)#73 | 0.0(+156)#4,283 |
| 74. | Allenville | 156.3 | 229.8(-73.5)#74 | 0.0(+156)#4,288 |
| 75. | Apple Canyon Lake | 161.6 | 229.8(-68.2)#75 | 0.0(+162)#4,406 |
| 76. | Annapolis | 162.7 | 229.8(-67.1)#76 | 0.0(+163)#4,426 |
| 77. | Bureau Junction | 163.9 | 229.8(-65.8)#77 | 0.0(+164)#4,469 |
| 78. | Cairo | 165.9 | 229.8(-63.9)#78 | 0.0(+166)#4,526 |
| 79. | Exeter | 166.9 | 229.8(-62.9)#79 | 0.0(+167)#4,552 |
| 80. | Elwood | 167.6 | 229.8(-62.2)#80 | 0.0(+168)#4,560 |
| 81. | Millbrook | 170.0 | 229.8(-59.8)#81 | 0.0(+170)#4,617 |
| 82. | East Cape Girardeau | 172.2 | 229.8(-57.6)#82 | 0.0(+172)#4,665 |
| 83. | Henning | 172.7 | 229.8(-57.1)#83 | 0.0(+173)#4,677 |
| 84. | Seaton | 173.8 | 229.8(-56.0)#84 | 0.0(+174)#4,700 |
| 85. | Stoy | 173.9 | 229.8(-55.9)#85 | 0.0(+174)#4,702 |
| 86. | Manchester | 174.2 | 229.8(-55.6)#86 | 0.0(+174)#4,708 |
| 87. | Thebes | 176.0 | 229.8(-53.7)#87 | 0.0(+176)#4,750 |
| 88. | Alto Pass | 176.2 | 229.8(-53.6)#88 | 0.0(+176)#4,755 |
| 89. | Phillipstown | 177.6 | 229.8(-52.2)#89 | 0.0(+178)#4,776 |
| 90. | Nauvoo | 178.5 | 229.8(-51.2)#90 | 0.0(+179)#4,807 |
| 91. | Keithsburg | 178.9 | 229.8(-50.9)#91 | 0.0(+179)#4,815 |
| 92. | Mcclure | 179.6 | 229.8(-50.2)#92 | 0.0(+180)#4,831 |
| 93. | Kell | 179.9 | 229.8(-49.9)#93 | 0.0(+180)#4,840 |
| 94. | Russellville | 181.7 | 229.8(-48.1)#94 | 0.0(+182)#4,888 |
| 95. | Crab Orchard | 181.9 | 229.8(-47.9)#95 | 0.0(+182)#4,898 |
| 96. | Rockbridge | 183.5 | 229.8(-46.3)#96 | 0.0(+183)#4,939 |
| 97. | Du Bois | 184.5 | 229.8(-45.3)#97 | 0.0(+184)#4,954 |
| 98. | Menominee | 186.5 | 229.8(-43.3)#98 | 0.0(+187)#5,001 |
| 99. | Calhoun | 186.6 | 229.8(-43.2)#99 | 0.0(+187)#5,002 |
| 100. | Oakdale | 186.7 | 229.8(-43.1)#100 | 0.0(+187)#5,004 |
Common Questions
What are the Top 10 Cities with the Lowest Population Density in Illinois?
Top 10 Cities with the Lowest Population Density in Illinois are:
#1
11.3
#2
17.8
#3
33.5
#4
48.1
#5
50.2
#6
54.7
#7
56.6
#8
58.6
#9
60.2
#10
61.2
What city has the Lowest Population Density in Illinois?
Old Mill Creek has the Lowest Population Density in Illinois with 11.3.
What is the Population Density in the State of Illinois?
Population Density in Illinois is 229.8.