Cities with the Highest Percentage of Population with a Degree in Multidisciplinary Studies in Illinois
RELATED REPORTS & OPTIONS
Multidisciplinary Studies
Illinois
Compare Cities
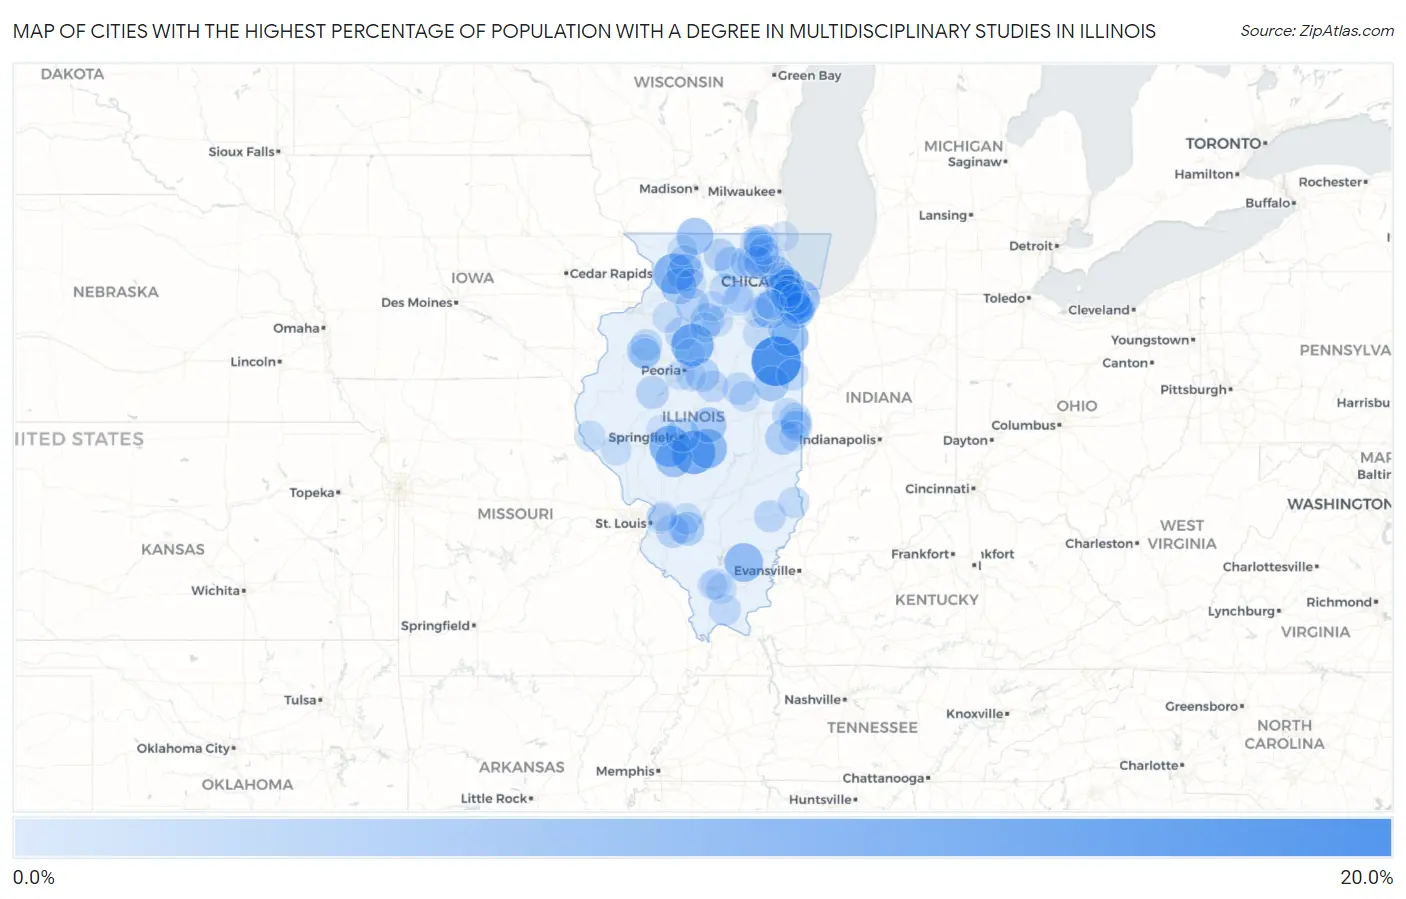
Map of Cities with the Highest Percentage of Population with a Degree in Multidisciplinary Studies in Illinois
0.0%
20.0%
Cities with the Highest Percentage of Population with a Degree in Multidisciplinary Studies in Illinois
| City | % Graduates | vs State | vs National | |
| 1. | Danforth | 19.0% | 0.79%(+18.3)#1 | 0.88%(+18.2)#118 |
| 2. | Kincaid | 13.3% | 0.79%(+12.5)#2 | 0.88%(+12.5)#224 |
| 3. | Sparland | 12.5% | 0.79%(+11.7)#3 | 0.88%(+11.6)#249 |
| 4. | Loami | 11.1% | 0.79%(+10.3)#4 | 0.88%(+10.2)#290 |
| 5. | Milledgeville | 10.9% | 0.79%(+10.1)#5 | 0.88%(+9.99)#302 |
| 6. | Stonington | 9.4% | 0.79%(+8.65)#6 | 0.88%(+8.55)#374 |
| 7. | Mcleansboro | 9.1% | 0.79%(+8.30)#7 | 0.88%(+8.21)#392 |
| 8. | Sun River Terrace | 7.9% | 0.79%(+7.15)#8 | 0.88%(+7.06)#474 |
| 9. | Burnham | 7.9% | 0.79%(+7.06)#9 | 0.88%(+6.97)#485 |
| 10. | Virden | 7.5% | 0.79%(+6.76)#10 | 0.88%(+6.67)#504 |
| 11. | Polo | 7.4% | 0.79%(+6.65)#11 | 0.88%(+6.56)#513 |
| 12. | Preston Heights | 7.4% | 0.79%(+6.59)#12 | 0.88%(+6.50)#519 |
| 13. | Lake Summerset | 7.3% | 0.79%(+6.54)#13 | 0.88%(+6.45)#523 |
| 14. | Mccook | 7.1% | 0.79%(+6.36)#14 | 0.88%(+6.26)#541 |
| 15. | Hazel Crest | 6.9% | 0.79%(+6.07)#15 | 0.88%(+5.97)#579 |
| 16. | Sterling | 6.6% | 0.79%(+5.85)#16 | 0.88%(+5.76)#605 |
| 17. | Wood Dale | 6.2% | 0.79%(+5.46)#17 | 0.88%(+5.37)#651 |
| 18. | Latham | 6.1% | 0.79%(+5.33)#18 | 0.88%(+5.24)#674 |
| 19. | South Chicago Heights | 6.0% | 0.79%(+5.23)#19 | 0.88%(+5.14)#689 |
| 20. | Loda | 5.9% | 0.79%(+5.09)#20 | 0.88%(+5.00)#719 |
| 21. | Hume | 5.5% | 0.79%(+4.67)#21 | 0.88%(+4.58)#801 |
| 22. | Grandview | 5.3% | 0.79%(+4.52)#22 | 0.88%(+4.43)#821 |
| 23. | East Hazel Crest | 5.3% | 0.79%(+4.48)#23 | 0.88%(+4.38)#828 |
| 24. | Fox River Grove | 5.0% | 0.79%(+4.23)#24 | 0.88%(+4.13)#890 |
| 25. | Germantown | 4.9% | 0.79%(+4.14)#25 | 0.88%(+4.05)#912 |
| 26. | East Galesburg | 4.8% | 0.79%(+4.05)#26 | 0.88%(+3.96)#939 |
| 27. | Goodfield | 4.7% | 0.79%(+3.94)#27 | 0.88%(+3.85)#959 |
| 28. | Dalzell | 4.7% | 0.79%(+3.93)#28 | 0.88%(+3.84)#960 |
| 29. | Kingston | 4.7% | 0.79%(+3.90)#29 | 0.88%(+3.81)#968 |
| 30. | Stickney | 4.7% | 0.79%(+3.88)#30 | 0.88%(+3.79)#973 |
| 31. | Ohio | 4.5% | 0.79%(+3.76)#31 | 0.88%(+3.67)#1,007 |
| 32. | Mascoutah | 4.3% | 0.79%(+3.50)#32 | 0.88%(+3.41)#1,073 |
| 33. | Gilberts | 4.3% | 0.79%(+3.47)#33 | 0.88%(+3.38)#1,081 |
| 34. | Forest View | 4.2% | 0.79%(+3.45)#34 | 0.88%(+3.36)#1,088 |
| 35. | Lewistown | 4.1% | 0.79%(+3.31)#35 | 0.88%(+3.21)#1,122 |
| 36. | Chicago Heights | 4.0% | 0.79%(+3.24)#36 | 0.88%(+3.15)#1,137 |
| 37. | Cherry Valley | 3.8% | 0.79%(+3.03)#37 | 0.88%(+2.94)#1,207 |
| 38. | Bradford | 3.6% | 0.79%(+2.83)#38 | 0.88%(+2.74)#1,291 |
| 39. | Arrowsmith | 3.6% | 0.79%(+2.78)#39 | 0.88%(+2.69)#1,311 |
| 40. | Forest Park | 3.2% | 0.79%(+2.46)#40 | 0.88%(+2.37)#1,462 |
| 41. | Forreston | 3.2% | 0.79%(+2.41)#41 | 0.88%(+2.32)#1,491 |
| 42. | Olney | 3.2% | 0.79%(+2.39)#42 | 0.88%(+2.29)#1,505 |
| 43. | Vienna | 3.1% | 0.79%(+2.35)#43 | 0.88%(+2.26)#1,517 |
| 44. | Hampshire | 3.1% | 0.79%(+2.35)#44 | 0.88%(+2.26)#1,519 |
| 45. | Worth | 3.1% | 0.79%(+2.34)#45 | 0.88%(+2.24)#1,532 |
| 46. | Twin Grove | 3.1% | 0.79%(+2.32)#46 | 0.88%(+2.23)#1,537 |
| 47. | Westville | 3.1% | 0.79%(+2.29)#47 | 0.88%(+2.20)#1,559 |
| 48. | Lynwood | 3.0% | 0.79%(+2.24)#48 | 0.88%(+2.15)#1,586 |
| 49. | Hometown | 3.0% | 0.79%(+2.21)#49 | 0.88%(+2.12)#1,603 |
| 50. | Georgetown | 2.9% | 0.79%(+2.12)#50 | 0.88%(+2.02)#1,659 |
| 51. | Milford | 2.9% | 0.79%(+2.09)#51 | 0.88%(+1.99)#1,680 |
| 52. | Ford Heights | 2.9% | 0.79%(+2.07)#52 | 0.88%(+1.98)#1,689 |
| 53. | Wataga | 2.9% | 0.79%(+2.07)#53 | 0.88%(+1.98)#1,690 |
| 54. | South Wilmington | 2.8% | 0.79%(+2.03)#54 | 0.88%(+1.94)#1,711 |
| 55. | Lake Holiday | 2.7% | 0.79%(+1.94)#55 | 0.88%(+1.85)#1,754 |
| 56. | St Rose | 2.7% | 0.79%(+1.91)#56 | 0.88%(+1.82)#1,775 |
| 57. | Burbank | 2.7% | 0.79%(+1.88)#57 | 0.88%(+1.79)#1,805 |
| 58. | Oakwood | 2.6% | 0.79%(+1.81)#58 | 0.88%(+1.72)#1,853 |
| 59. | Shabbona | 2.6% | 0.79%(+1.80)#59 | 0.88%(+1.71)#1,864 |
| 60. | Flat Rock | 2.6% | 0.79%(+1.78)#60 | 0.88%(+1.68)#1,886 |
| 61. | Manteno | 2.6% | 0.79%(+1.77)#61 | 0.88%(+1.67)#1,894 |
| 62. | Bellflower | 2.5% | 0.79%(+1.71)#62 | 0.88%(+1.62)#1,942 |
| 63. | Olivet | 2.5% | 0.79%(+1.71)#63 | 0.88%(+1.62)#1,944 |
| 64. | Knoxville | 2.5% | 0.79%(+1.70)#64 | 0.88%(+1.61)#1,950 |
| 65. | Payson | 2.3% | 0.79%(+1.56)#65 | 0.88%(+1.46)#2,060 |
| 66. | Pistakee Highlands | 2.3% | 0.79%(+1.52)#66 | 0.88%(+1.43)#2,092 |
| 67. | East Dundee | 2.2% | 0.79%(+1.43)#67 | 0.88%(+1.34)#2,188 |
| 68. | Northlake | 2.2% | 0.79%(+1.43)#68 | 0.88%(+1.34)#2,203 |
| 69. | Herrin | 2.2% | 0.79%(+1.42)#69 | 0.88%(+1.33)#2,211 |
| 70. | Pittsfield | 2.2% | 0.79%(+1.38)#70 | 0.88%(+1.28)#2,261 |
| 71. | North Utica | 2.1% | 0.79%(+1.32)#71 | 0.88%(+1.23)#2,334 |
| 72. | Minooka | 2.1% | 0.79%(+1.31)#72 | 0.88%(+1.21)#2,345 |
| 73. | Palos Heights | 2.1% | 0.79%(+1.27)#73 | 0.88%(+1.18)#2,388 |
| 74. | Annawan | 2.0% | 0.79%(+1.23)#74 | 0.88%(+1.13)#2,443 |
| 75. | Wonder Lake | 2.0% | 0.79%(+1.22)#75 | 0.88%(+1.13)#2,452 |
| 76. | Fairmont | 2.0% | 0.79%(+1.17)#76 | 0.88%(+1.08)#2,514 |
| 77. | Collinsville | 2.0% | 0.79%(+1.16)#77 | 0.88%(+1.07)#2,524 |
| 78. | Marion | 1.9% | 0.79%(+1.14)#78 | 0.88%(+1.05)#2,555 |
| 79. | Bartonville | 1.9% | 0.79%(+1.10)#79 | 0.88%(+1.01)#2,613 |
| 80. | Mendota | 1.9% | 0.79%(+1.08)#80 | 0.88%(+0.986)#2,636 |
| 81. | Morton | 1.8% | 0.79%(+1.05)#81 | 0.88%(+0.961)#2,668 |
| 82. | Dixon | 1.8% | 0.79%(+1.03)#82 | 0.88%(+0.937)#2,702 |
| 83. | Mccullom Lake | 1.8% | 0.79%(+0.998)#83 | 0.88%(+0.906)#2,749 |
| 84. | Ringwood | 1.8% | 0.79%(+0.982)#84 | 0.88%(+0.891)#2,779 |
| 85. | Chrisman | 1.7% | 0.79%(+0.959)#85 | 0.88%(+0.867)#2,810 |
| 86. | Sandwich | 1.7% | 0.79%(+0.940)#86 | 0.88%(+0.848)#2,850 |
| 87. | Ashland | 1.7% | 0.79%(+0.929)#87 | 0.88%(+0.837)#2,869 |
| 88. | Freeport | 1.7% | 0.79%(+0.914)#88 | 0.88%(+0.823)#2,887 |
| 89. | Deer Park | 1.7% | 0.79%(+0.885)#89 | 0.88%(+0.794)#2,930 |
| 90. | Crest Hill | 1.7% | 0.79%(+0.876)#90 | 0.88%(+0.785)#2,952 |
| 91. | Albers | 1.7% | 0.79%(+0.873)#91 | 0.88%(+0.782)#2,960 |
| 92. | Mchenry | 1.7% | 0.79%(+0.869)#92 | 0.88%(+0.777)#2,970 |
| 93. | Maryville | 1.6% | 0.79%(+0.825)#93 | 0.88%(+0.734)#3,050 |
| 94. | Carpentersville | 1.6% | 0.79%(+0.819)#94 | 0.88%(+0.728)#3,070 |
| 95. | Zion | 1.6% | 0.79%(+0.806)#95 | 0.88%(+0.714)#3,101 |
| 96. | Island Lake | 1.6% | 0.79%(+0.790)#96 | 0.88%(+0.698)#3,131 |
| 97. | Riverdale | 1.6% | 0.79%(+0.773)#97 | 0.88%(+0.682)#3,166 |
| 98. | Chillicothe | 1.6% | 0.79%(+0.765)#98 | 0.88%(+0.674)#3,182 |
| 99. | Granville | 1.6% | 0.79%(+0.763)#99 | 0.88%(+0.671)#3,190 |
| 100. | Carterville | 1.5% | 0.79%(+0.751)#100 | 0.88%(+0.660)#3,216 |
Common Questions
What are the Top 10 Cities with the Highest Percentage of Population with a Degree in Multidisciplinary Studies in Illinois?
Top 10 Cities with the Highest Percentage of Population with a Degree in Multidisciplinary Studies in Illinois are:
#1
19.0%
#2
13.3%
#3
12.5%
#4
11.1%
#5
10.9%
#6
9.4%
#7
9.1%
#8
7.9%
#9
7.9%
#10
7.5%
What city has the Highest Percentage of Population with a Degree in Multidisciplinary Studies in Illinois?
Danforth has the Highest Percentage of Population with a Degree in Multidisciplinary Studies in Illinois with 19.0%.
What is the Percentage of Population with a Degree in Multidisciplinary Studies in the State of Illinois?
Percentage of Population with a Degree in Multidisciplinary Studies in Illinois is 0.79%.
What is the Percentage of Population with a Degree in Multidisciplinary Studies in the United States?
Percentage of Population with a Degree in Multidisciplinary Studies in the United States is 0.88%.