Zip Codes with the Highest Percentage of Population Employed in Food Preparation & Serving in Springfield, IL
RELATED REPORTS & OPTIONS
Food Preparation & Serving
Springfield
Compare Zip Codes
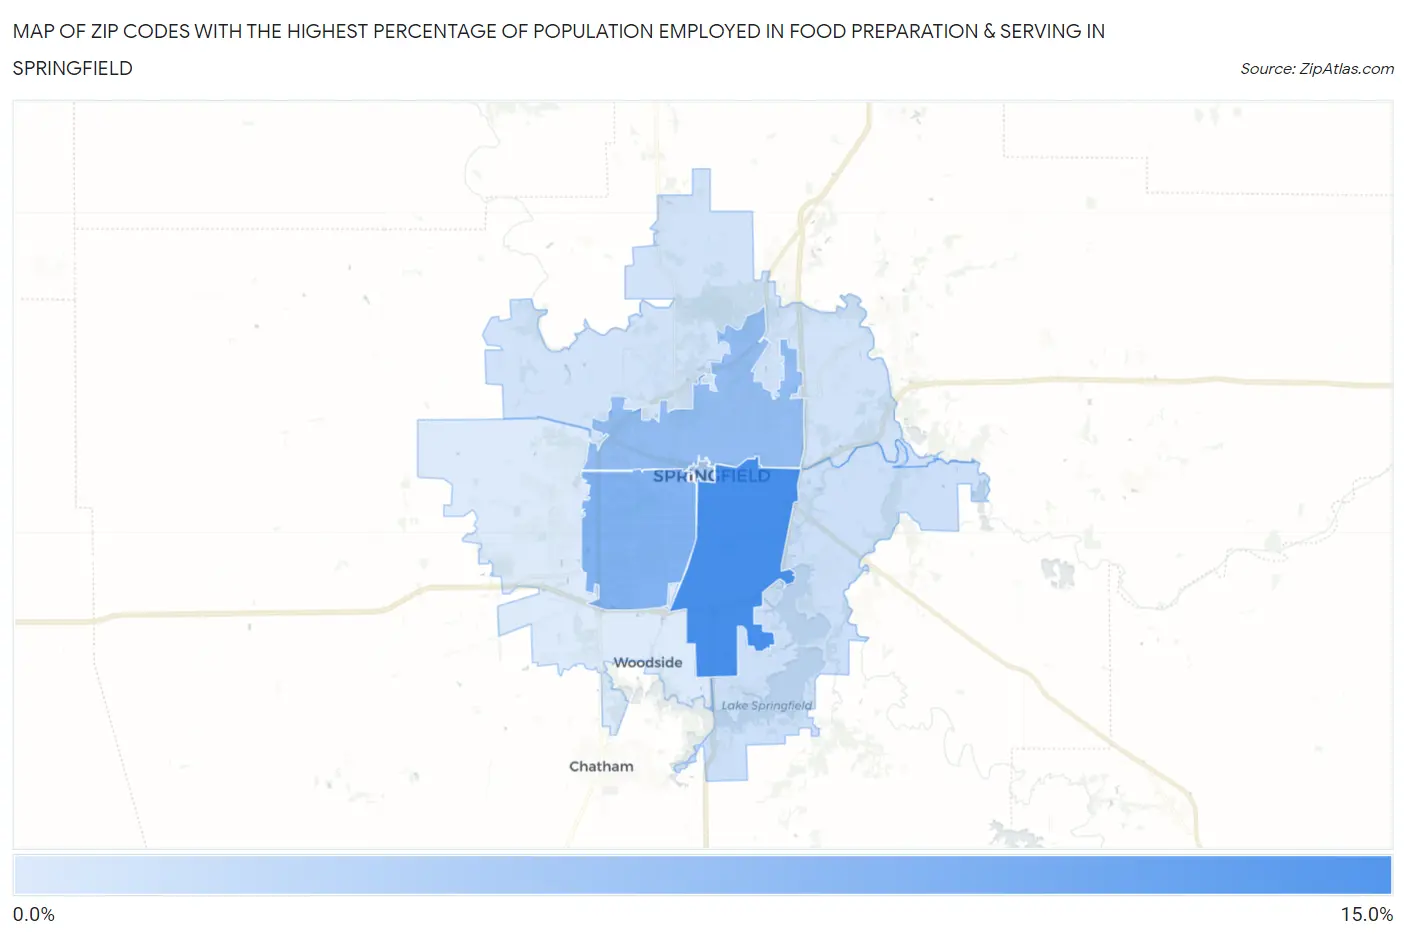
Map of Zip Codes with the Highest Percentage of Population Employed in Food Preparation & Serving in Springfield
1.6%
10.9%
Zip Codes with the Highest Percentage of Population Employed in Food Preparation & Serving in Springfield, IL
| Zip Code | % Employed | vs State | vs National | |
| 1. | 62703 | 10.9% | 5.0%(+5.83)#84 | 5.3%(+5.58)#2,130 |
| 2. | 62704 | 7.3% | 5.0%(+2.24)#238 | 5.3%(+1.99)#5,981 |
| 3. | 62702 | 6.1% | 5.0%(+1.05)#378 | 5.3%(+0.799)#9,071 |
| 4. | 62701 | 5.0% | 5.0%(-0.046)#559 | 5.3%(-0.297)#13,004 |
| 5. | 62712 | 2.5% | 5.0%(-2.50)#1,017 | 5.3%(-2.75)#23,045 |
| 6. | 62707 | 2.3% | 5.0%(-2.69)#1,052 | 5.3%(-2.94)#23,648 |
| 7. | 62711 | 1.6% | 5.0%(-3.44)#1,144 | 5.3%(-3.69)#25,760 |
1
Common Questions
What are the Top 5 Zip Codes with the Highest Percentage of Population Employed in Food Preparation & Serving in Springfield, IL?
Top 5 Zip Codes with the Highest Percentage of Population Employed in Food Preparation & Serving in Springfield, IL are:
What zip code has the Highest Percentage of Population Employed in Food Preparation & Serving in Springfield, IL?
62703 has the Highest Percentage of Population Employed in Food Preparation & Serving in Springfield, IL with 10.9%.
What is the Percentage of Population Employed in Food Preparation & Serving in Springfield, IL?
Percentage of Population Employed in Food Preparation & Serving in Springfield is 6.1%.
What is the Percentage of Population Employed in Food Preparation & Serving in Illinois?
Percentage of Population Employed in Food Preparation & Serving in Illinois is 5.0%.
What is the Percentage of Population Employed in Food Preparation & Serving in the United States?
Percentage of Population Employed in Food Preparation & Serving in the United States is 5.3%.